Development of a New Model for Leak Detection in Pipelines
2019-08-04EkwuemeObibuikeMbakaoguIhekoronye
S. T. Ekwueme; U. J. Obibuike; C. D. Mbakaogu; K. K. Ihekoronye
[a] Petroleum Engineering, Federal University of Technology Owerri, Nigeria.
Abstract The leak of pipelines causes’ product loss which result to environmental damages. This can be minimized through careful pipeline supervision, early detection and location followed by quick responses to the incidence. The Niger delta region ushers an avenue where pipelines are regularly vandalized. These have led to severe environmental degradation as well as huge financial loss for the country. In this work, a mathematical model was developed for leak detection in pipelines. The result of the mathematical model showed good potential for leak detection in pipelines especially when used with alarm generator for better output. The developed model was validated with pipeline data from the Niger Delta region. The research study will be useful in identifying leaks in pipelines as well as reduction in pipeline vandalism.
Key words: Pipeline vandalism; Leak detection; Mathematical model; Environmental degradation
1. INTRODUCTION
It is important to transport fluid from the point of production to the areas of end use. This has led to the increase in the number of pipe lines that are being designed, constructed and modeled. Routine pipeline monitoring and pipeline surveillance should be made mandatory. With the increase in Niger Delta pipeline vandalism,deterioration by thief and oil bunkering, there is need to safeguard these pipeline. In addition, model leak detection in natural gas pipelines that can help solves the problems of oil vandalism and thief. These problems have led to severe environmental degradation and huge financial loss for the country. Scott and Barrufet (2003)observed that software-based methods use fully transient computer simulations and steady state modeling techniques.
Acoustic monitoring techniques typically utilize acoustic emission sensors to detect leaks base on changes in the background noise pattern. The advantages of the system include detection of the location of the leaks as well as non-interference with the operation of the pipelines. In addition, they are easily ported to various sizes of pipes. However, a large number of acoustic sensors are required to monitor an extended range of pipelines. The technology is also unable to detect small leaks that do not produce acoustic emissions at levels substantially higher than the background noise. Attempts to detect small leaks can result in many false alarms. Hardware and software are methods used to classify pipeline leak detection monitoring. Hardware methods include acoustic monitoring (Chis, 2005; Klein, 1993); gas sampling (Sperl, 1991), soil monitoring (Ikoku, 1982), flow monitoring (Turner, 1991; Bose and Olson, 1993).
The method make use of flow pressure, temperature and other data provided in the supervisory control and data acquisition unit (SCADA) system (Bose, 1993; Turner, 1991) while the Software method monitors various flow parameters at different locations along the pipeline. These flow parameters presence in a model helps to determine the natural gas leaks in the pipeline.
Gas sampling methods typically use a flame ionization detector housed in a hand held or vehicle mounted probe to detect methane or ethane. The primary advantage of gas sampling methods is that they are very sensitive to very small concentrations of gases. Therefore, even very tiny leaks can be detected using gas sampling methods. The technique is also immune to false alarms. The disadvantages of the technology are that detection is very slow and limited to the local area from which the gas is drawn into the probe for analysis.Therefore the cost of monitoring long pipelines using gas sampling methods is very high. In soil monitoring methods, the pipeline is first inoculated with a small amount of tracer chemical. This tracer chemical will seep out of the pipe in the event of a leak. This is detected by dragging an instrument along the surface above the pipeline. The advantages of the method include very low false alarms, and high sensitivity. However, the method is very expensive for monitoring since trace chemicals have to be continuously added to the natural gas.In addition, it cannot be used for detecting leaks from pipelines that are exposed. Flow monitoring devices measure the rate of change of pressure or the mass flow at different sections of the pipeline. If the rate of change of pressure or the mass flow at two locations in the pipe differs significantly, it could indicate a potential leak.The major advantages of the system include the low cost of the system as well as non-interference with the operation of the pipeline. The two disadvantages of the system include the inability to pinpoint the leak location,and the high rate of false alarms.
1.1 Objective of the Study
· Develop a mathematical model that can address leak detection problems
· Validate the generated equation using data obtained in the Niger Delta field
1.2 Study Scope
The model only considered steady state condition. The model also depends on the accuracy of the flow meters and pressure gauge instruments. The model assumes Steady state flow, No kinetic energy change, Constant compressibility factor, Isothermal flow
2. METHODOLOGY
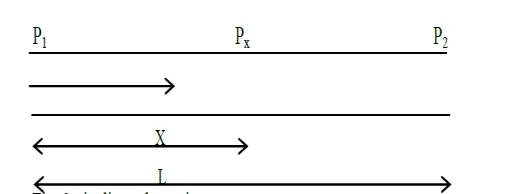
Figure 1: Pipeline schematic of the research work.
2.1 Three Dimensional Steady Flows

2.2 Applying Partial Differential

Simplifying
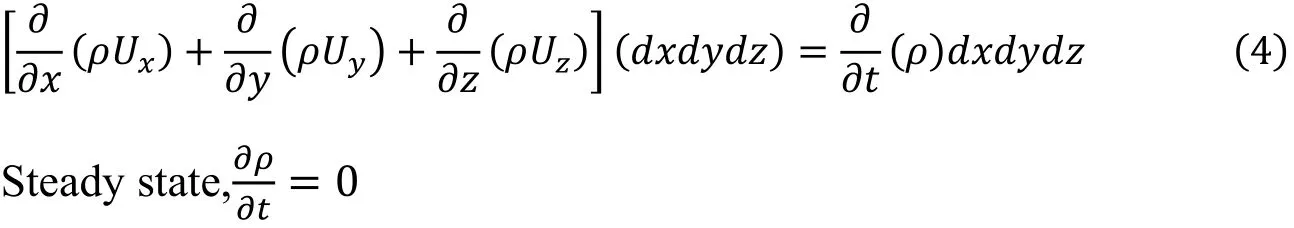
2.2 Energy Equatıon
Energy possessed by the natural gas is given as

Assuming a steady state

3. RESULT PRESENTATION AND EQUATION VALIDITY

Table 1 Pipeline data in the Niger delta
Where
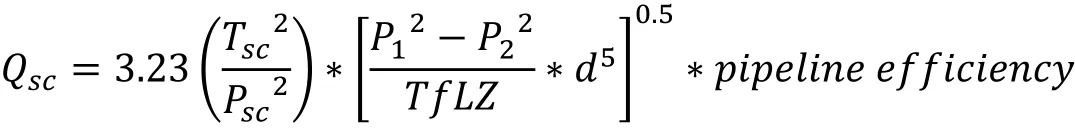
Maximum gas velocity = 50ft/sec, Pipeline efficiency = 0.96, Base temperature = 60 ° F, Base pressure 14.70psia, Compressibility factor = standing-Katz, Operating temperature = 80 degrees Fahrenheit
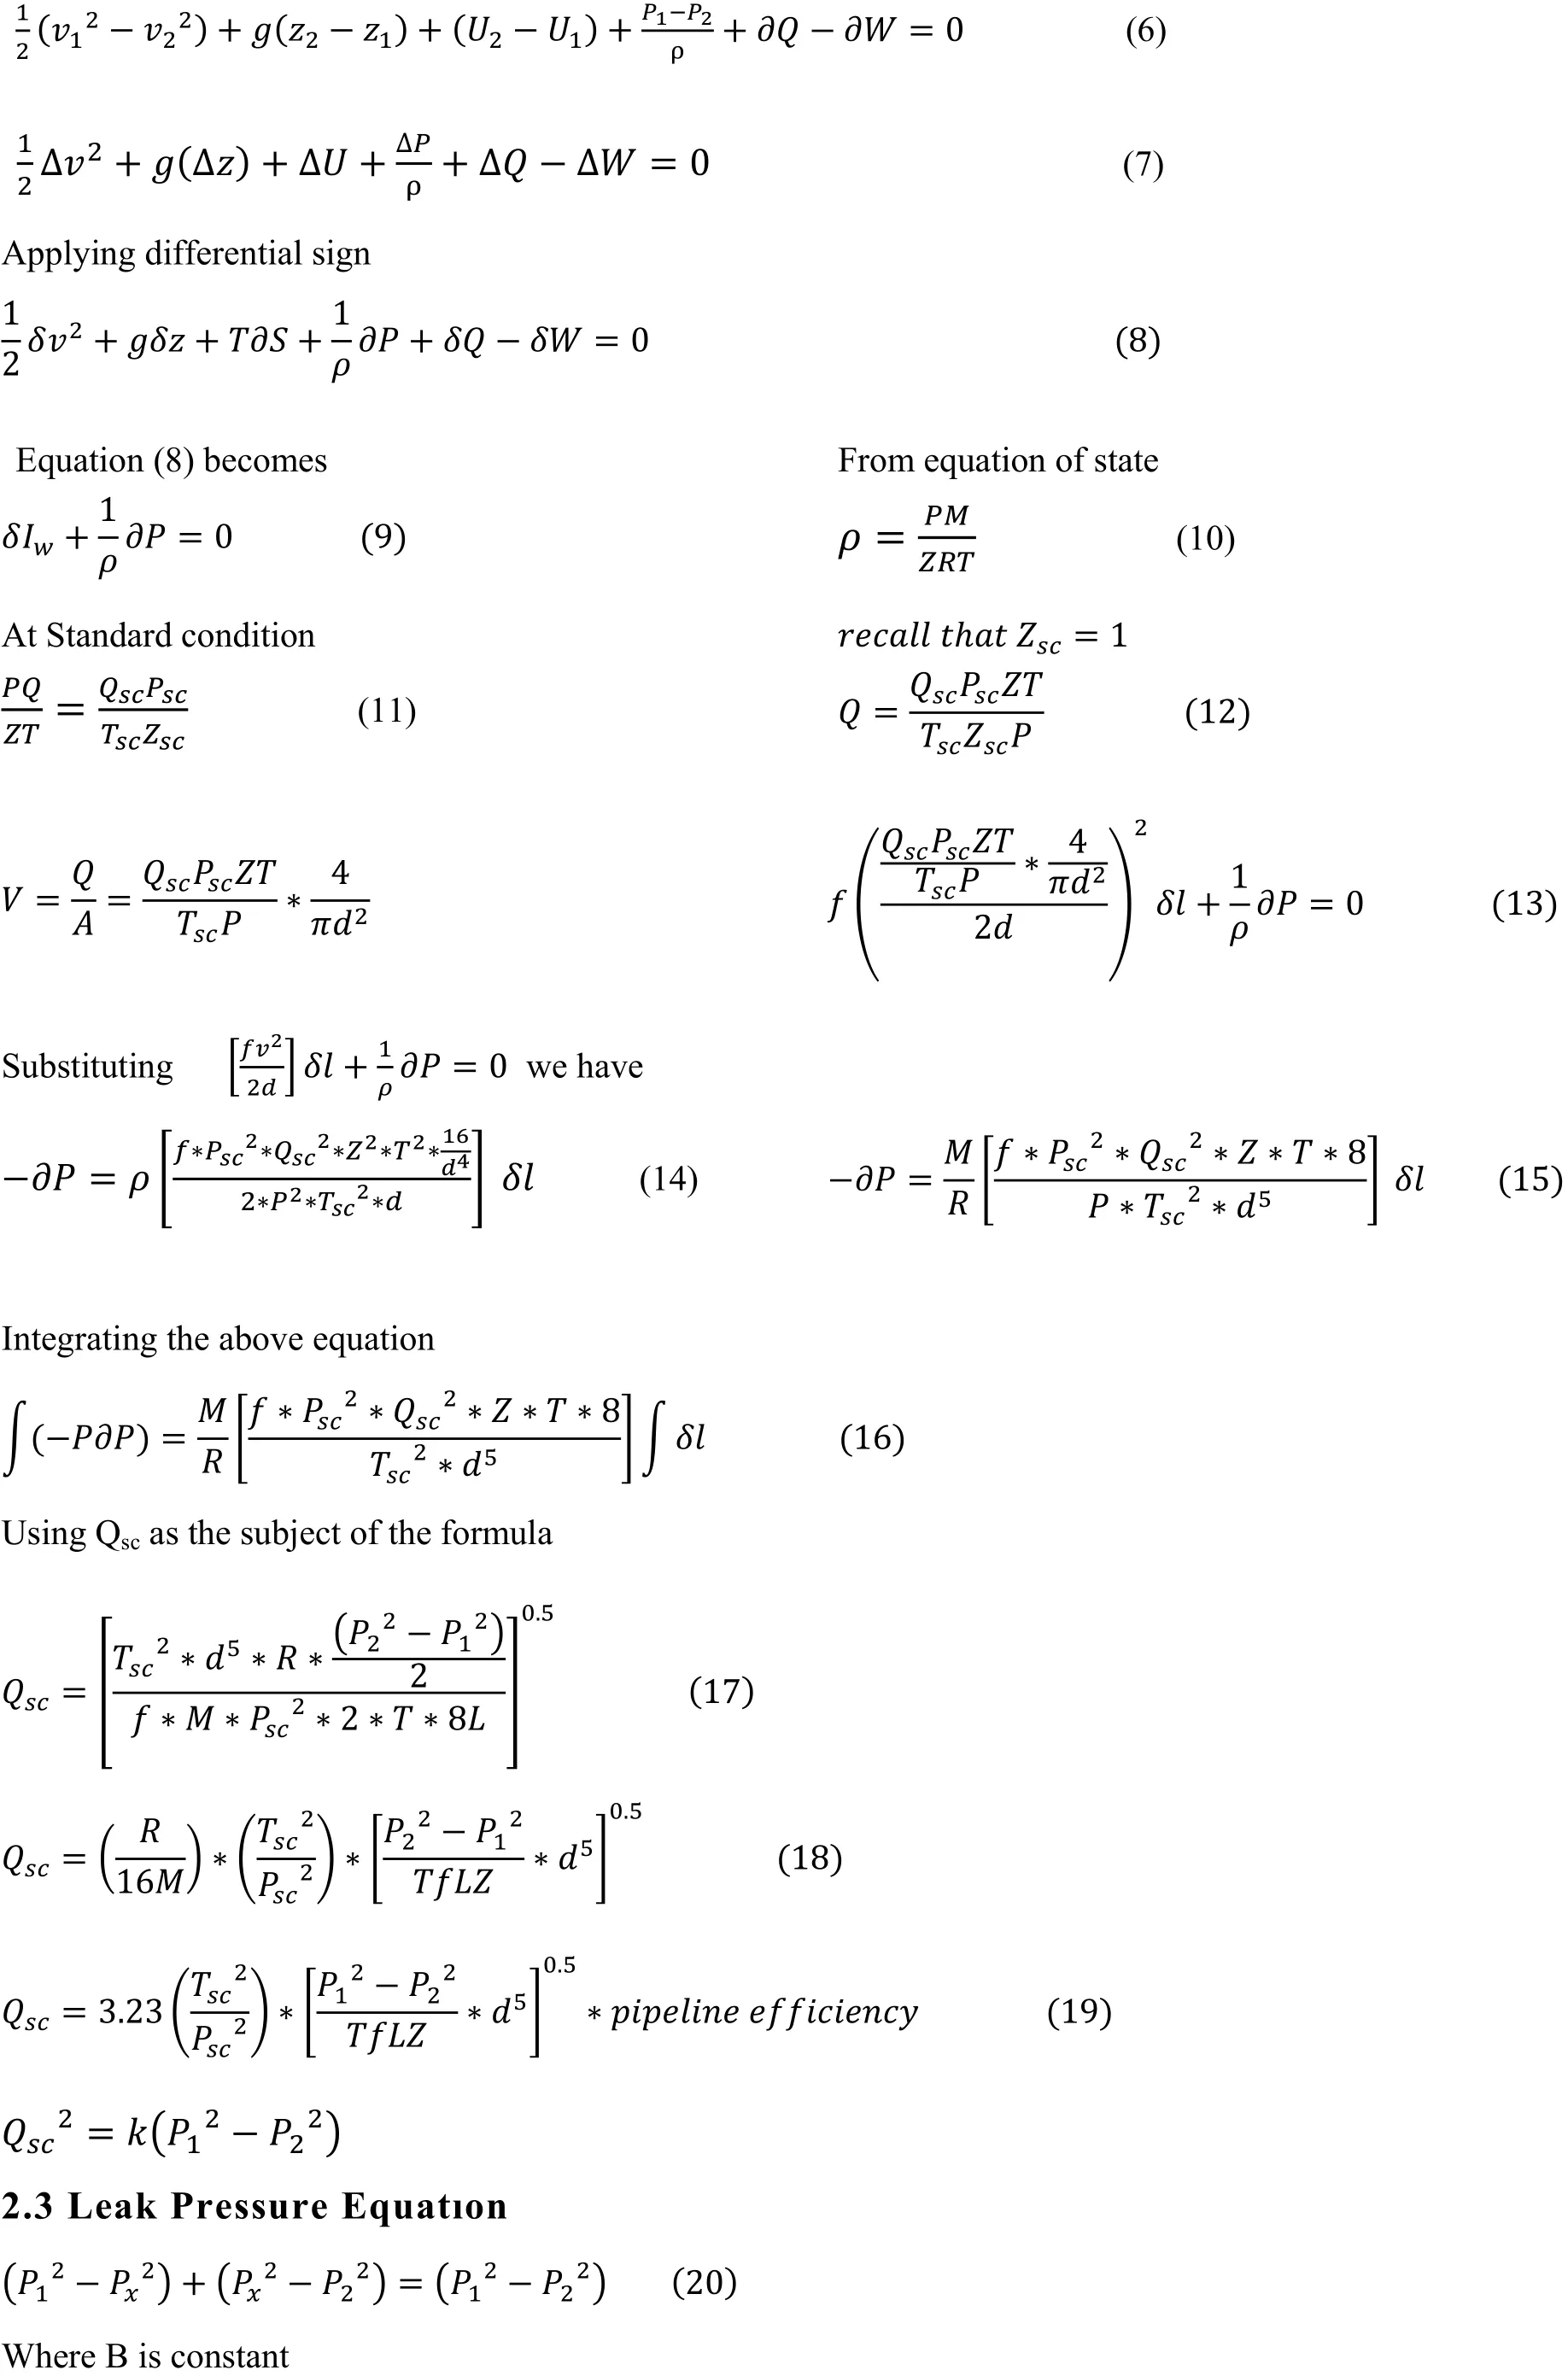
3.1 Gas Composition
Table 2 Gas compositions

Table 3 Determination of molecular weight
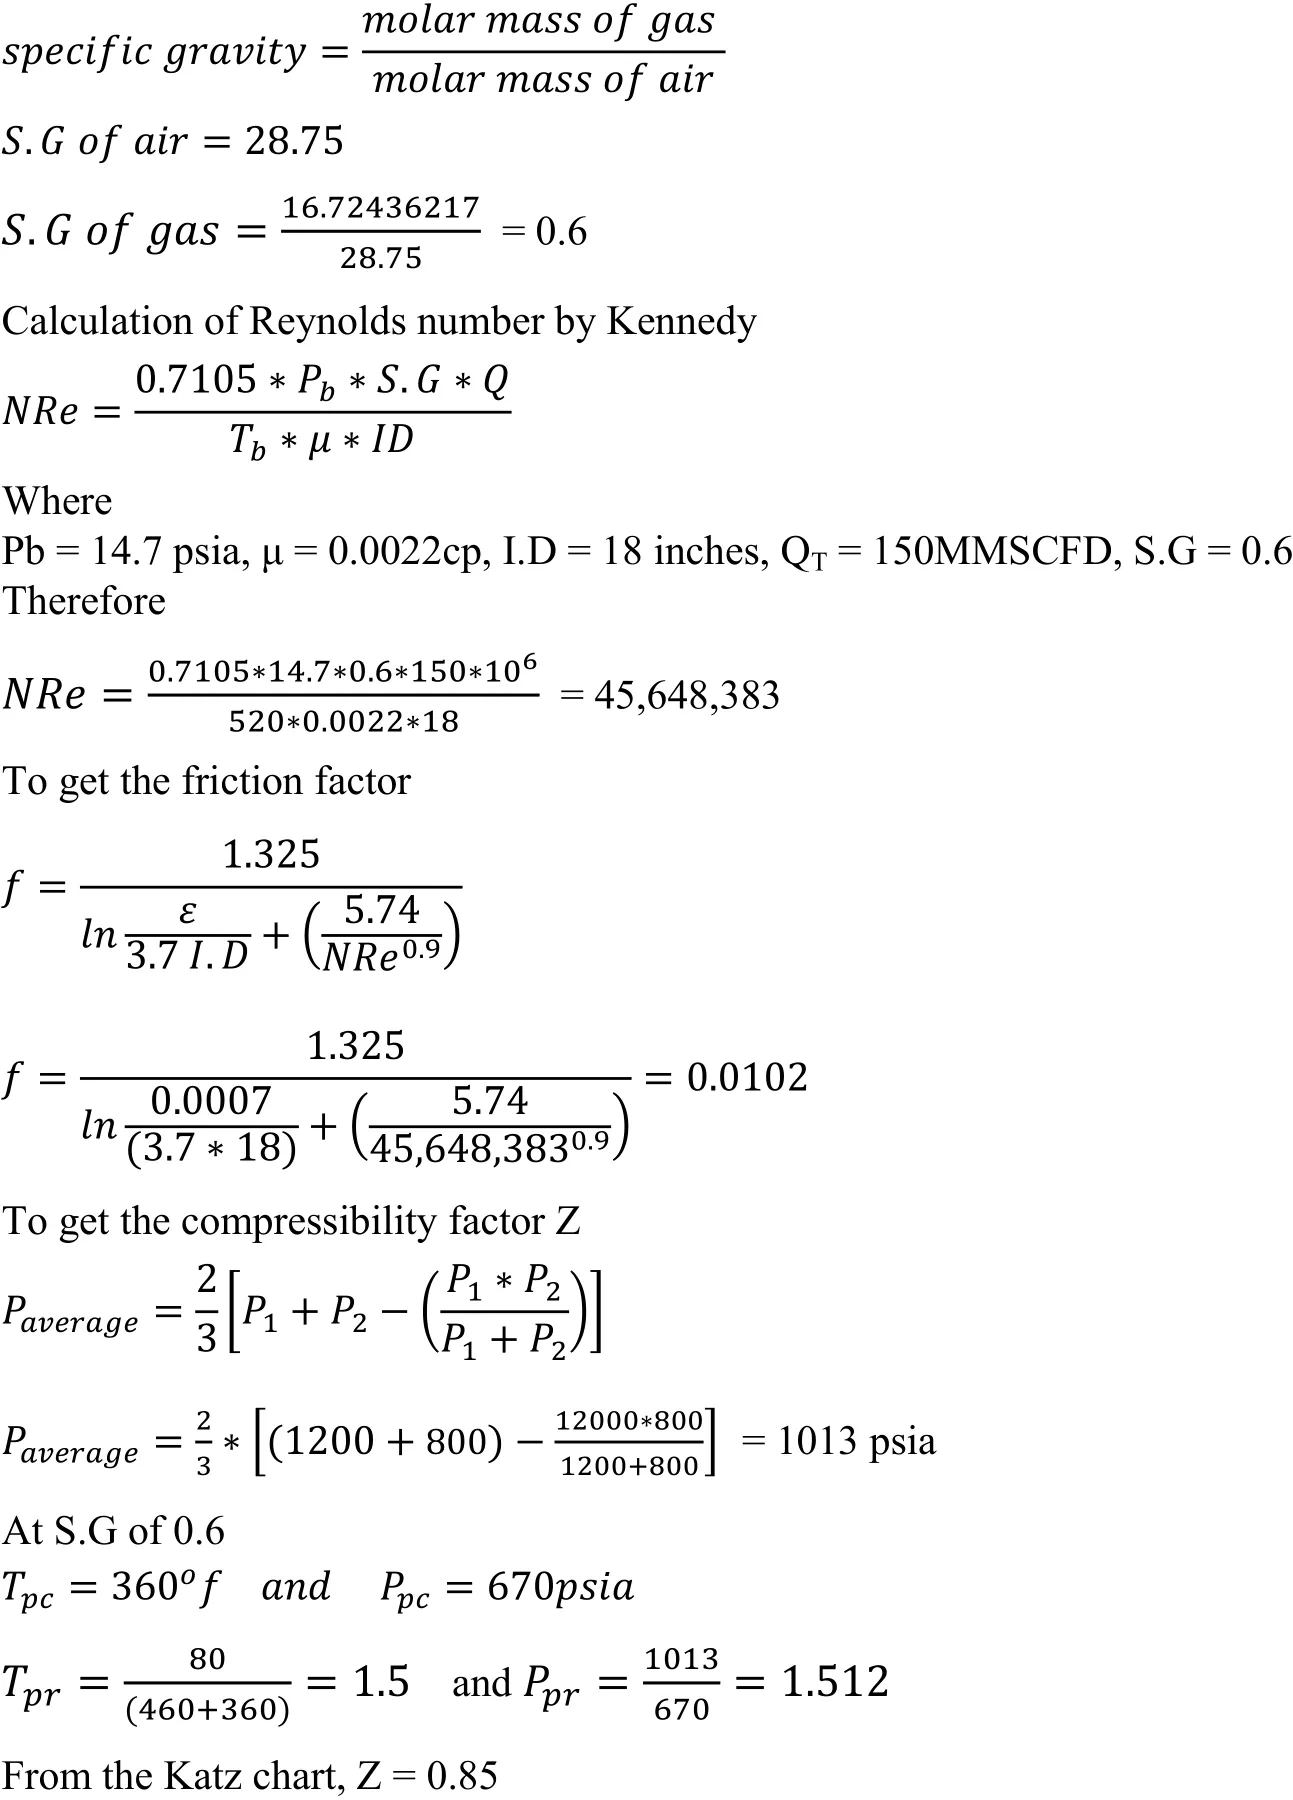
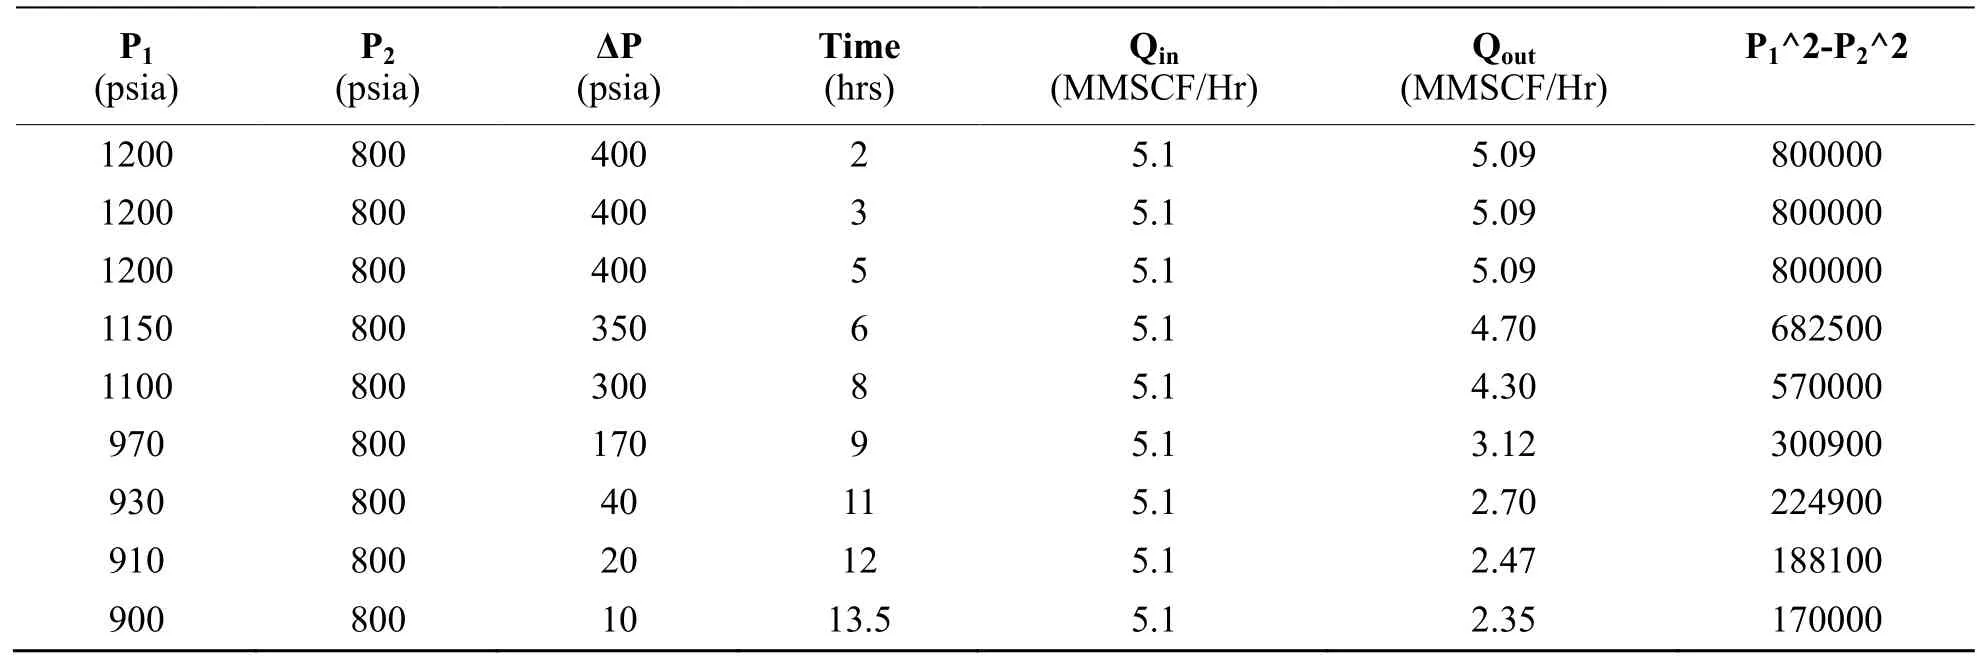
Table 4 For values for flow rate, pressure drop and time
The above table was generated using the equation
3.2 Pressure Drop Along the Pipeline


Table 5 Pressure drop along the pipeline
Equation used to generate the above table is P=1200−0.84*L
The pipeline under study is confined by fixed inlet flow rate (Qin) and outlet pressure (Pout), but inlet pressure(Pin) and outlet flow rate (Qout) are allowed to vary once a leak is introduced in the system.
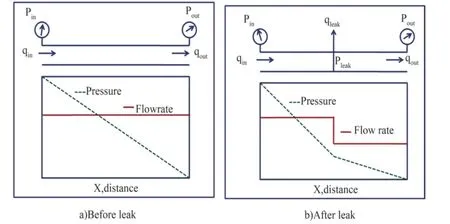
Figure 2: Schematic diagram of natural pipeline before and after leakage
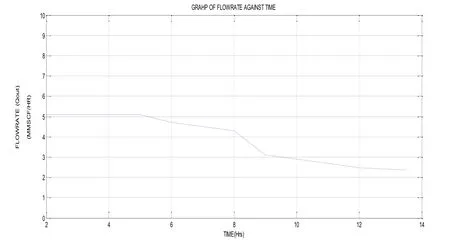
Figure 3: Graph of flow rate against time.
3.3 Determination of Leak

Converting to kilometers, it becomes 64.8 * 1.609 = 104.26Km
Pressure at leak location, Px(using equation 30)

From the equation derived above

Total volume in = 45.9MMSCF/Hr
Total volume out = 34.9MMSCF/Hr
Therefore volume of leak = 45.9 – 34.9 = 11MMSCF/Hr
Recall that gas density at standard condition is
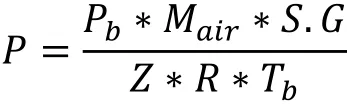
Where
Pb= base pressure i.e. 14.7psia
Mair= molar mass of air (28.75)
S.G = specific gravity of gas
R = gas constant i.e. 10.73psift3/lb. MolesoR
Therefore

ρ=0.0454lb/ft3
Mass flow rate = density * volume flow rate.
Mass flow rate =0.0454 *11*106
Mass flow rate =499400lbs/hr
Therefore mass of leak per hour = 499400lbs of Gas.
CONCLUSION
The following conclusions can be drawn from this study.
i. The developed model can be used to reduce leaks in pipelines.
ii. The generated model will be effective when used with alarm generator for effective output.
iii. The model only considered steady state conditions.
CONTRIBUTION TO KNOWLEDGE
Mathematical model was established in this study for leak detections in natural gas pipelines in the Niger Delta region in order to reduce environmental degradation and pipeline vandalism which causes severe loss of life,property and loss of money to the country.
杂志排行

Advances in Petroleum Exploration and Development的其它文章
- Description of Shale Pore Fracture Structure Based on Multi-Fractal Theory
- Comparative Analysis of Abnormal Pore Pressure Prediction Models for Niger Delta Oil and Gas Fields Development
- Optimizing Production in Brown Fields Using Re-Entry Horizontal Wells
- Economic Analysis of Low Salinity Polymer Flooding Potential in the Niger Delta Oil Fields
- Using Shallow Platform Drilling Technology to Tap the Reserves of the Below Constructed Area of Fuyu Oilfield:Taking Chengping Block 12 as an Example
- Prediction Study of Niger-Delta Brown Fields Using Simulation Horizontal Wells Technology