Comparative Analysis of Abnormal Pore Pressure Prediction Models for Niger Delta Oil and Gas Fields Development
2019-08-04BonifaceOrijiAmieyeoforiOladamolaIbifaka
Boniface A. Oriji; Amieyeofori Oladamola Ibifaka
[a] Department of Petroleum and Gas Engineering, University of Port Harcourt, Nigeria.
[b] Institute of Petroleum Studies, University of Port Harcourt, Nigeria.
Abstract Carrying out pore pressure estimation in abnormally pressured zones is very essential for a successful well drilling operation. These zones can cause serious drilling incidents, increase the cost of drilling, increase non-productive time if not predicted and estimated accurately before and while drilling. To mitigate these effects and also to ensure safe drilling operations, it is important to be fully aware of the depths at which these zones will be encountered. The use of Eaton’s model for pore pressure estimation in Niger Delta could result in some degree of error because the Eaton's model was developed using data from Gulf of Mexico. In Niger Delta oil fields, frequent kicks are experienced because of the drawback of the existing model employed for evaluating pore pressure. In this study, data from case study wells in Niger Delta were used to propose the most accurate model of estimating abnormal pore pressure through a comparative analysis of three d-exponent based models (Rehm and McClendon, Eaton, Nweke and Dosunmu). These models were used to calculate abnormal pore pressure at different depths of the well, and the estimated abnormal pore pressure resulting from the use of these respective models were compared with measured data from the case study well. The abnormal pore pressure values estimated by using Rehm and McClendon when compared with measured data resulted in an average error percent of 21.852% while Ben Eaton and Nweke and Dosunmu resulted in an average error percent of 8.686% and 5.887% respectively. The study from the comparative analysis showed that Nweke and Dosunmu’s model gave the closest result to measured data.
Key words: Pore pressure; Comparative analysis; Rehm and McClendon; Eaton; Nweke and Dosunmu
1. INTRODUCTION AND BACKGROUND INFORMATION
The superficial effects of abnormal pressures have been ever important in petroleum exploration. Abnormally pressured zones are often encountered when drilling in petroleum exploration and they cause technical difficulties.Abnormal pressures have been a worldwide phenomenon because most of the world's petroleum provinces face these same issues with abnormally pressured zones. It is important to state that almost all sedimentary basins possess varying degrees of abnormal pressure. The effects of abnormal pressure could possibly be desirable or undesirable as regards to exploration of oil and gas. From the point of hydrocarbon migration, abnormal pressures are desirable because of the hydrodynamic gradient. They also help guard petroleum accumulations by reinforcing the reservoir seal. Sometimes they are undesirable because they are often unpredictable or unquantifiable.Exploration drilling may sustain heavy losses in both human and financial terms because of the incomplete knowledge of formation pressure (Mouchet and Mitchell, 1989). Knowledge about formation pressures goes a long way in determining the drilling programme quality. Constantly estimating correctly the formation pressure and readjusting the drilling programme to fit in is very essential when drilling through risky zones prone to abnormal pressures. Estimation of formation pressures in shale has been basically through indirect means as there are no techniques that directly evaluate the formation pressure in shales (Yoshida, Ikeda, & Eaton, 1996). Some of the indirect methods that are usually used in estimating formation pressure in shale includes the Bowers' method(Bowers, 1995), the D-exponent method (Jorden & Shirley, 1966), and the Eaton's method (Eaton, (1972). Despite having numerous models for estimating formation pressure indirectly, using the D-exponent technique seems to be more popular as it estimates formation pressure better than most others during drilling. A major setback of this method is the need for interpretation of the Normal Compaction Trend (NCT) from the dataset (Mouchet &Mitchell, 1989). Hence the interpreter's judgment plays a key role in obtaining the results using this technique(user bias). Nweke and Dosunmu (Nweke, 2013) worked on eliminating this user bias and its related uncertainty by using the effective stress to D-exponent ratio instead.
A lot of shallow reservoirs in Niger Delta, Nigeria has been explored, produced for several years and depleted over time. The operators of these fields are still interested in producing from these reservoirs which can only be achieved by drilling deeper into such formation. As drilling goes deeper, it is almost certain that the mud weight window gets narrower thereby needing a more sophisticated drilling process. Hence, hitting abnormal pressures would almost cause some drilling problems such as: loss of circulation; kicks; stuckpipe; wellbore instability etc.These drilling challenges will leave a huge burden of Non Productive Time (NPT) and eventually lead to an increased well cost. This can be avoided when there’s a high level of accuracy in estimating pore pressure. The term pore pressure is very important to achieve a successful drilling operation. It is hence imperative that a reliable tool is used to efficiently predict abnormal formation pressures.
Drilling activities usually carry some degree of risk, but this risk can be greatly increased if drilling through abnormally pressured zones. In such conditions, successful drilling requires the use of every means of detection at our disposal. A number of methods are available for the qualitative or quantitative assessment of abnormal pressure. The first concern must be to study local structure and lithostratigraphy to reveal any closed system which may be present. This initial phase may be able to detect zones of potential risk, and must be incorporated into the preparatory stages of the drilling programme, even though it can give no guarantees about the presence and magnitude of abnormal pressure. In abnormally pressured zones, trapped formation water usually finds its way out until the eventual re-absorption of the excess pressure. This is so because rocks are usually permeable no matter how little (Hubbert & Rubey, 1959). The importance of the thermal effect in the creation of abnormal pressure is a matter for great controversy. Some believe its role is negligible (Chapman, 1980) while others see it as a factor of some significance (Magara, 1975; Gretener, 1977; Sharp, 1983). It was suggested by Hanshaw and Zen (Hanshaw & Zen, 1965) that closed environment abnormal pressure development may have risen due to osmosis. Several authors, particularly Young and Low (Young & Low, 1965) and Oslen (Olsen, 1972), proved experimentally that clay could be considered a semi-permeable membrane. Its effectiveness in this respect was patchy however, to such an extent that an increased content of very fine quartz in the clay was enough to cause a noticeable reduction in efficiency.
Laboratory tests have proven that osmotic effects are real; the evidence for their existence in nature is far less certain. Laboratory trials only used thin membranes of pure clay and strongly contrasting saline solutions.Although diagenetic processes cause a significant increase in water volume, the part they play in the creation of abnormal pressure remains to be proven, but is probably only marginal (Kern & Weisbrod, 1964). In order to evaluate abnormal pressures linked to compaction anomalies it is necessary to define a normal compaction trend for reference purposes. Pure clays with identical mineralogical composition and texture theoretically show a unique compaction trend. In reality clays and shales have widely varying facies. If all else is equal, penetration rate gradually declines as depth increases due to the decreasing porosity caused by the weight of overlying sediments. The method has the potential to detect any significant porosity changes. According to Mouchet and Mitchell (Mouchet & Mitchell, 1989), the Rate of Penetration (ROP) increases when undercompacted shale is drilled into. Field work has shown that, short of using computer, the solution known as the “d exponent” method is the simplest and most reliable (Mouchet & Mitchell, 1989). This technique was formulated in the Gulf Coast shales and takes major variable into account. It has proved to be so successful that it is still, with some refinements, the most frequently used method.
It has been observed that the d-exponent increment rate with depth tend to reduce when abnormal pressure zone is hit, showing a deviation from the NCT. The complete reversal of the NCT is also possible whereby the d-exponent reduces with depth. After Jorden and Shirley (Jorden & Shirley, 1966) completed the fine work of d-exponent, Rehm and McCledon (McClendon & Rehm, 1971) modified the d-exponent and came up with a more sophisticated model. This modified model accounted for mud density variation, the bit weight, diameter of bit and the rotary speed. To quantitatively estimate pore pressure, Rehm and McClendon (McClendon & Rehm, 1971)recommended plotting the modified d-exponent values against depth, D, on Cartesian scale. Eaton (Eaton, 1972)proposed this model to compute the pore pressure based on travel times. Sonic measurements, or travel times, of normal compacted sediments decreased with depth due to decrease in porosity. Similar to Eaton’s resistivity method, a normal compaction trend is applied to the sonic measurements. Travel times that decrease less than the normal compaction trend suggest an overpressure due to pore fluids being unable to escape as rapidly as necessary.Eaton’s sonic method uses the difference in travel times and compaction trend to calculate the pore pressure. It was suggested by Zamora (Zamora, 1972), that depth should be scaled on the Cartesian scale while the modified d-exponent should be scaled on a log scale. Zamora went further to state that the normal pressure trend line slope showed only little variation and with no reference to geologic age or location. Eaton (1972) observed that the overburden stress and formation pressure gradients directly have influence on the petrophysical log data parameters. He also observed that overburden stress gradient effects should be incorporated into the Hottman and Johnson relationship (Hottman & Johnson, 1965). An empirical relationship that predicts the abnormal pressure of Hottman and Johnson was developed by Eaton. This led to the factor of 1.2 being used in the Eaton's model. At the time the Eaton's model was developed, it was believed that it predicted the pore pressure to within 0.5 ppg of the equivalent mud density for any geologic environment provided the input data were of good quality. An assumption is made that the salinity of water is constant throughout the formation. Changes in salinity, and thus in the resistivity log, suggest a change in the shale porosity. Eaton’s resistivity method uses the differences in resistivity and the normal compaction trend to find the pore pressure. Using seismic data for formation pressure estimation requires that the average acoustic velocity must be determined as a function of depth (Bourgoyne, et al,1991). For normal pressure zones, it can be simply gotten by multiplying the pressure gradient for that area by the depth of interest. In dealing with abnormal pressure zones, the basis of most of the models were hinged on the fact that there is less compaction in abnormally pressure formations thereby resulting in increased porosities as against normally pressured formations at same depth. Thus, the pore pressure for this zone is porosity dependent.According to Bourgoyne et al (Bourgoyne, et al, 1991), there are basically two methods in predicting abnormal formation pressures: the first method assumes that similar formations which have equal porosity-dependent variable value are under equal matrix stress; while the other method proposed some mathematical relationships.The empirical correlations are thought to be more accurate than the assumption of equivalent matrix stress at depths having equal values for the porosity dependent parameter. Similar to Eaton’s method, Bower’s method3uses a compaction trendline and finds the difference in measurements to estimate the pore pressure.However, Bower observed that some abnormal pressures beginning at or near the mudline in deep water showed curved normal compaction trend. This was the case with seismic interval velocity data for offset and prospect wells. Vahid and Mark (Vahid and Mark, 2012) designed a model for Carbonate reservoirs. They stated that in carbonate rocks, abnormal pressure may not be related to the porosity. Their new approach proposed using the compressibility attribute of the reservoir for calculating effective stress. The basis of their approach hinges on the fact that pore spaces affect the formation pressure which happens to be a direct function of the compressibility of the rock. That is the pore pressure increases as the pore spaces reduces due to compaction. Nweke and Dosunmu(Nweke, 2013) came up with a new approach that corrected the NCT used by other correlations. They used the observation of Bowers (Bowers, 1995) to modify the Eaton's correlation (Eaton, 1972). They used the effective stress to velocity ratio in evaluating pore pressure for normally pressured formations and hence outside the NCT indicated abnormal formation pressure. They developed a more robust NCT that eliminated the dependence on d-exponent. The method of using d-exponent is dependent on an adjustment exponent that ranges between 1.2 and 1.5, while in the case of Niger Delta brown fields; an objective exponent of adjustment was derived ranging from 0.6 to 1. A power law function was used to define a new NCT that was more objective. Nweke et al (Nweke, Oriji,and Dosunmu, 2016) basically split their model into two categories; one used before drilling and the other after drilling. The first was purely based on geological and geophysical data while the second was based on data from well logging and drilling.
2. METHODOLOGY
The data for this study were obtained from a field in the Niger Delta and it contained, true vertical depth, rate of penetration, weight on bit, bit size, pore pressure from MDT. The data are shown in Table 1.

Table 1 Drilling MDT data from a field in the Niger delta

Continued
A computer software program was developed to compute the abnormal pore pressure from three pore pressure models (Eaton model, Nweke and Dosunmu model, Rehm and McClendon model) and their results compared with MDT data. The program was developed using visual basic.net programming language so as to make it simple and easy for users to operate an excel file into the software. The software estimated the percentage errors for the three models in reference to the MDT pore pressure data.
To effectively compensate for the effect of drilling parameters such as weight on bit, rotary speed, bit diameter that may influence penetration rate, the d-exponent was calculated using Equation 1 shown below.

Where,
R = penetration rate, ft/hr, N = rotary speed, RPM, W = weight on bit, K-lbf, db= bit diameter, inches, dexp=d-exponent
2.1 Ben Eaton Model
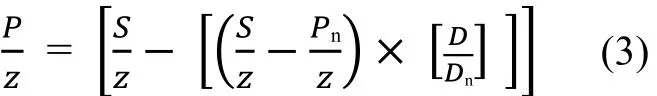
The Ben Eaton model equation is given in Equation 2 below

Where,
P = Pore pressure (psi), Z = depth (ft), Pn= normal pressure (psi), S = Overburden pressure (psi),the adjustment parameter.
Overburden gradient is 1.0 psi/ft, the adjustment correlation parameter

2.2 Nweke and Dosunmu’s Model
The normal compaction trend using this method is derived from the plot of effective stress versus d-exponent.
All parameters are the same as in Eaton's model.
2.3 Rehm and McClendon Model
The modified d-exponent was calculated to remove the effect of mud-density changes.

ρn= the mud density equivalent to a normal formation pore pressure gradient, ppg
ρc= the equivalent mud density at the bit while circulating, ppg
To quantitatively estimate pore pressure dmodvalues were plotted against depth, D, on Cartesian scale. Hence,the normal pressure trend line was given by

m = slope, (dmod)o= intercept
The slope was fairly constant with changes in geologic hence, pore pressure was gotten from Equation 6 shown below

Where;
(dmod)n= dmodread from the normal pressure trend line at depth of interest
(dmod) = dmodread from the actual pressure trend line at depth of interest gpExpressed in ppg
The following assumptions were made in the course of this estimation model:
A rule of thumb is to assume the overburden gradientto be equal to 1.0 psi/ft
Normal pressure gradient of 0.433psi/f
4. RESULT AND DISCUSSION
This section presents the summary of the results gotten from utilizing the three models and compared with the MDT data. The goal is to identify the pore pressure model that gave the closest result to that of MDT pore pressure data. The result summary obtained from the software was extracted and displayed in Table.

Table 2 Result summary from the three models compared with reference to MDT data baseline

Continued
From Table 2, the pore pressures estimated at the various depth intervals using the three pore pressure models are clearly shown. The developed software carried out the error percent analysis from comparing each of the models against the MDT data pore pressure. The average percentage error gotten when using the Rehm and McClendon model for the whole depth was estimated to be 21.89% as compared to the MDT data. For the Ben Eaton model, the average percentage error for the whole depth was estimated to be 8.84%. When using the Nweke and Dosunmu’s model, the average percentage error gotten when the results were compared against the MDT data pore pressure for the whole depth was estimated to be 5.58 %. The Nweke and Dosunmu’s model therefore proved to be the better in estimating pore pressure. Also, the NCT which is the ratio between d-exponent and effective stress used in Nweke and Dosunmu’s model proved to be more precise than the NCT of the other three models for Niger Delta brown fields.
CONCLUSION
The main aim of this study is to apply the concepts of d-exponent method of estimating pore pressure to develop a model using visual basic application (vb.net) that can accurately estimate abnormal pore pressure required to mitigate drilling hazards during drilling in the Niger Delta. This study is limited to the following three pore pressure models (Eaton, Nweke and Dosunmu, Rehm and McClendon). The software was simulated to estimate abnormal pore pressure real time while drilling. This approach will help in saving drilling time and thereby resulting in effective drilling cost management and will also reduce well construction risk.
Based on this study, it was concluded that; an accurate estimation of abnormal pore pressure was very necessary for a successful drilling operation. Estimating abnormal pore pressure using Ben Eaton and Nweke and Dosunmu models were relatively close and good for Niger Delta fields irrespective of the terrain and the shape of the well.However, Nweke and Dosunmu’s model proved to be better when compared to Ben Eaton model. The tool developed in this study presents an easy to use and better means of optimizing and estimating abnormal pore pressure for a successful drilling operation. The importance of mitigating drilling hazards cannot be overemphasized. The problems of lost circulation, borehole instability, kick and stuck pipe remains the major cause of NPT and should be properly managed, controlled and avoided. Hence, the ability to accurately estimate abnormal pore pressure will help in minimizing these problems.
杂志排行

Advances in Petroleum Exploration and Development的其它文章
- Description of Shale Pore Fracture Structure Based on Multi-Fractal Theory
- Development of a New Model for Leak Detection in Pipelines
- Optimizing Production in Brown Fields Using Re-Entry Horizontal Wells
- Economic Analysis of Low Salinity Polymer Flooding Potential in the Niger Delta Oil Fields
- Using Shallow Platform Drilling Technology to Tap the Reserves of the Below Constructed Area of Fuyu Oilfield:Taking Chengping Block 12 as an Example
- Prediction Study of Niger-Delta Brown Fields Using Simulation Horizontal Wells Technology