Sediment transport in pure acceleration-skewed oscillatory sheet flow *
2019-01-05XinChen陈鑫FujunWang王福军GenfaChen陈根发LiuchaoQiu邱流潮
Xin Chen (陈鑫), Fu-jun Wang (王福军), Gen-fa Chen (陈根发), Liu-chao Qiu (邱流潮)
1. College of Water Resources and Civil Engineering, China Agricultural University, Beijing 100083, China
2. Beijing Engineering Research Center of Safety and Energy Saving Technology for Water Supply Network System, China Agricultural University, Beijing 100083, China
3. China Institute of Water Resources and Hydropower Research, Beijing 100044, China
Abstract: In the present study, an analytical concept model is built, using a two-phase model for the sediment transport in a pure acceleration-skewed oscillatory sheet flow. The analytical model is based on the asymmetric wave theory, the irregular boundary layer theory and the exponential concentration distribution theory, to be used for analyzing the phase lag and the boundary layer development related to the acceleration skewness. The two-phase model is applied for the calculations of the instantaneous erosion depth, the sediment flux, the boundary layer thickness and the sediment transport rate, as well as the differences between the positive acceleration stage and the negative acceleration stage caused by the acceleration skewness, as very important in the net current and sediment transport. The effects of the sediment diameter and the phase lag are explained by a comparison with the instantaneous type empirical formula, as is closely related to the acceleration skewness. With the analytical concept model and the two-phase model, the generation of the net sediment transport in the pure acceleration-skewed flows is clearly explained. The phase lag effect is important for the instantaneous sediment transport in the pure acceleration-skewed flow, whereas the boundary layer development difference between the positive acceleration stage and the negative acceleration stage plays a major role in the determination of the net sediment transport.
Key words: Acceleration skewness, analytical concept model, boundary layer thickness, two-phase model, sediment transport rate
Introduction
Generally, the nearshore oscillatory flows induced by waves have a positive acceleration skewness with a steep frontal slope and a gentle rear slope when the waves enter the surf zone. The study of the sediment transport under the oscillatory sheet flows with an acceleration skewness is important because of its large transport rate and the micro mechanisms are not clearly understood, which are very important in the determination of the coastal topography evolution.In the sheet flow layer, the Shields parameter is large0.8-1.0), and the sediment volumetric concentration is extremely high (0.08-0.65), so the interaction between the sediment and the water, and the collision between the sediment particles are very strong. The accurate knowledge concerning the net sediment transport in the acceleration-skewed oscillatory sheet flows is an important part of the environmental and morphological requirements in the coastal and estuarine engineering. Therefore, the studies of the sediment transport should be related to the acceleration skewness caused by the wave propagation and transformation.
The studies of the sediment transport under the acceleration-skewed oscillatory sheet flow conditions were numerous. Experiments were carried out for understanding, developing and validating of complex sediment transport models, including the pure acceleration-skewed flows[1-3]and the mixed flows with velocity skewness and acceleration skewness[4-6].Large net sediment transport rate is observed in the case of high acceleration skewness, and the obtained development of the boundary layer thickness[7]and the shear stress[8-9]are different in the positive acceleration stage and in the negative acceleration stage. Nielsen[10]first noticed the influence of the fluid acceleration on the boundary layer thickness and the bed shear stress as expressed in the sediment transport formula. On the basis of experiments, the influence of the acceleration is considered into the empirical models for the sediment transport in accelerationskewed oscillatory sheet flows, including the quasisteady types without the phase lag due to the concentration and the flow velocity[11-13]and the semi-unsteady types accounting for the phase lag in some extent[1,3-15].
For the net sediment transport prediction, Drake and Calantoni[11]proposed to use the acceleration skewness in a periodic averaged formula based on the discrete particle modeling of the coarse sediment in oscillatory flows. Hoefel and Elgar[12]recalibrated the Drake and Calantoni[11]formula for optimal parameters based on the sandbar migration data in the surf zone. Similarly, Puleo et al.[16]adjusted the discrete particle formula to predict the acceleration effect in the swash zone. All these models did not include the phase lag. Watanabe and Sato[1]added the velocity leaning indices representing the acceleration effect in a half period- averaged phase residual model, in which the sediment transport includes the sediment entrained and transported during the current half period and the sediment entrained during the preceding half period but transported during the current half period. In recent years, the modification of the model of Watanabe and Sato[1]was made by Dong et al.[3]. van der A Dominic et al.[15]also applied a similar formula and considered the acceleration skewness effect on the Θ through a wave friction factor. However, many models including the phase residual model are not easy to implement due to the difficulties in the determination of the appropriate model parameters,especially when complex parameters are involved.
For an instantaneous sediment transport prediction, Nielsen[10]proposed an empirical formula by setting Θ to be a weighted summation of the near bed velocity and acceleration. Modifications of the Θ were later introduced to consider the boundary layer turbulence influence. Later, Nielsen[13]recalibrated the model parameter in accordance with the experiments conducted by Watanabe and Sato[1].Gonzalez-Rodriguez and Madsen[14]formula was also proposed based on the Nielsen[10]type formula, and the acceleration effect and the phase shift were contained in the bed shear stress. In these models,various methods were used for the sediment transport to account for the acceleration skewness effect, due to an asymmetrical development of the boundary layer thickness between the positive acceleration stage and the negative acceleration stage. Although many empirical formulas were proposed, none of them can be applied for analyzing the instantaneous sediment transport process because the phase residual has not been included. Furthermore, some key factors such as the net flow current generated by the acceleration skewness are still not considered.
To improve the theory and the related micro mechanism about the acceleration skewness, an analytical concept model and a two-phase turbulent numerical model[17]are applied for the sediment transport in pure acceleration-skewed oscillatory sheet flows. With the implementation of the analytical concept model, the influence of the phase lag and the boundary layer thickness on the acceleration skewness can be clearly shown for the sediment transport in pure acceleration-skewed oscillatory sheet flows. The two-phase turbulent model is validated for various velocity and acceleration skewness conditions, and can be used for the instantaneous and averaged sediment flux and the sediment transport rate. Based on the previous validation[17]of the temporal and spatial variations of velocity, concentration and erosion depth, the present study focuses on the effects of the acceleration skewness on the sediment transport over the mobile bed within the wave period.
1. Analytical concept model
To analytically explain the net sediment transport rate generated by the acceleration skewness, an analytical concept model[18]is applied on the basis of the asymmetric wave theory[15], the irregular boundary layer theory[10]and the exponential concentration approximation theory[19].

An analytical approximation[5]is presented to the velocity-skewed and acceleration-skewed asymmetric waves from the imagery part of the function where the boldfaced notation represents a vector, U0is the amplitude of the free steam velocity, p and φ are the wave form parameters, tis the time, andis the angular frequency, T is the wave period. In this study, to account for other waves, such as Sawtooth waves, the complex near-bed free stream velocity is expressed more generally as Following Nielsen[10], the irregular complex velocity in the boundary layer can be obtained as


where the subscript B denotes the boundary layer,y is the vertical coordinate with the origin at the initial undisturbed bed, α is the phase lead parameter at the immobile bed surface, Δ is the erosion depth, andBδ is the boundary layer thickness. The exponential law approximation of the concentration profile with consideration of the mass conservation[19]can be applied, that is

where S is the sediment volumetric concentration,and the subscript m denotes the maximum value.The approximation is a balance between a complex physics problem and an engineering application. Only in a region very near the immobile bed level,significant errors can be observed by using Eq. (4) as compared with the real profile, where the velocity is very close to 0, that would cause very small influence on the transport rate.
The complex sediment transport rate is

In an actual turbulent sediment-laden flow, the phase lead between the immobile bed surface and the outer free stream velocity is small. For a further engineering application, a zero phase lead may be acceptable as in the widely used classical instantaneous type formulas[10,13-14,18]because the phase lead is actually minimal in practice. If =0α and =U Im()U , then the instantaneous transport rate from the imagery part of Eq. (5) is reduced to the following form

The wave boundary layer thicknessBδ is directly included in the sediment transport model in this paper. In this equation, the effect of the phase lag can be seen from Δ, and the importance ofBδ can be clearly seen from the fact that a largeBδ corresponds to a small transport rate for the same flows.
In a wave period, the instantaneous transport rate can usually be approximated asGenerally, all their conclusions can be reached with the present concept model as follows:n decreases with the increase of the phase residual effects[5,6,18-19]. If the phase residual is so large that the periodic Δ is almost constant, =1n . If the phase residual is small, n corresponds to 3-5
2. Two-phase numerical model
The concept analytical model might be used for analyzing the phase shift, the phase residual and the boundary layer development effect. But it cannot be directly used because inBδ and Δ are included the phase lag, the acceleration and the sediment size and others that have not been known. The difficulty in the determination ofBδ and Δ should be overcome for the analytical model application in engineering in the future study, where the asymmetric nature of the boundary layer thickness[7]and the shear stress[8-9]would be emphasized. In the present study, a twophase turbulence model[17]based on the Euler-Euler theory is applied instead. The fluid phase and the sediment phase are coupled according to their interaction forces including the drag force, the inertia force and the lift force. The traditional -kε model is applied for the turbulence closure of the fluid phase,while an algebraic particle turbulence model is applied for the sediment phase. For more validations, 81 pure acceleration-skewed flow data are collected in Table 1,including the approximation obtained by takingin Eq. (2).

Table 1 Data for sediment transport rate validation
The free stream velocity and acceleration in the present study are shown in Fig. 1, in which the positive and negative directions denote onshore and offshore, respectively. In the present pure acceleration-skewed flow, the parameter for the degree of the acceleration skewnessand the third moment of the accelerationthe third moment of the velocitywhere the angle brackets denote the periodic average.

Fig. 1 Pure acceleration-skewed flow

Fig. 2 Net sediment transport rate
The data cover the cases with the sediment diameters=0.15-0.74 mm , the maximum free stream velocities= 0 .77-1.45m/s and the wave periods3-9s . The experimental net sediment rates are all positive as a whole in Fig. 2, which shows that the most data are for regions around the solid line representing accurate predictions by the two-phase model. The positive net sediment transport is for the phase residual[2]related to the acceleration skewness,from the negative flow trough to the positive flow crest, a large amount of the sediment entrained in the negative flow stage remains in movement after the flow reversal due to the smalldtT corresponding to a large acceleration, then it is carried away in the positive flow stage. While from the positive flow crest to the negative flow trough, a largedcT corresponding to a small acceleration makes less sediment remaining in movement after the flow reversal and is carried away in the negative flow stage. The phenomenon means an enhanced effect when β increases or D decreases, which leads to an increase of the phase residual[2]related to the acceleration skewness. Furthermore, a large velocity would also increase the phase residual because the sediment would be entrained to a place very high that it cannot completely settle down before the flow reversal, and the positive net transport is observed to increase with the increase ofmU[1,2,5].
3. Results and discussions
In the following we mainly focus on the contribution of the phase lag and the boundary layer development in the sediment flux and the transport rate for pure acceleration-skewed sheet flows based on experiments[2]in the same situation of =6 sT andhe experiments cover the cases =β 0.58-0.70 and=0.15-0.46 mm, which corresponds to a wide range of acceleration skewness and phase lag parameters. In the following discussions, the instantaneous sediment flux isThe above mentioned phase lag includes three parts:(1) the phase shift between the erosion depth and the free stream velocity, (2) the phase residual of the sediment entrained during the current half period but transported after the flow reversal, and (3) the bottom shear stress and the velocity phase lead to the free stream velocity.
3.1 Erosion depth and sediment flux
The phase shift and the phase residual can be seen from the instantaneous bottom (S =0.99 Sm)and top (S =0.08) of the sheet flow layer in Fig. 3 in the fine case of D =0.15 mmand the medium case of D =0.27 mm. The bottom of the sheet flow layer is also the erosion depth. Large Um, short T and small D would cause a significant phase lag[6,19].Correspondingly, at the time of reaching the minimum Δ, the phase shift in the fine case of D =0.15 mm in Fig. 3(a) is about 0.09t/ T, which is larger than 0.04t/ T in the case of D =0.27 mmin Fig. 3(b).Due to the phase residual, the classical linear relation Δ/D ∝ Θ cannot be used again in the oscillatory sheet flows. The phase residual represented by the minimum Δ at the time close to the flow reversal in the fine case of D =0.15 mmis also larger than that in the case of D =0.27 mm. The periodic variation of Δ is very small as seen in Fig. 3(a) due to the large phase residual, similar to the case of FA5010 in O’Donoghue and Wright[20], and the variation in Fig.3(b) is much significantly larger. Notice that the maximum Δ near the flow crest is larger than that near the flow trough, and the minimum Δ at the time near t /T = 0 is almost the same as that at the time near t /T = 0.5 in both the fine and medium cases. This means that the amount of sediment remaining in the movement after the flow reversal in the positive flow stage due to a smalldcT is close to that remaining in the movement due to a largedcT. The positive net sediment transport may not only be related to the van der[2,5]conclusion about the phase residual.
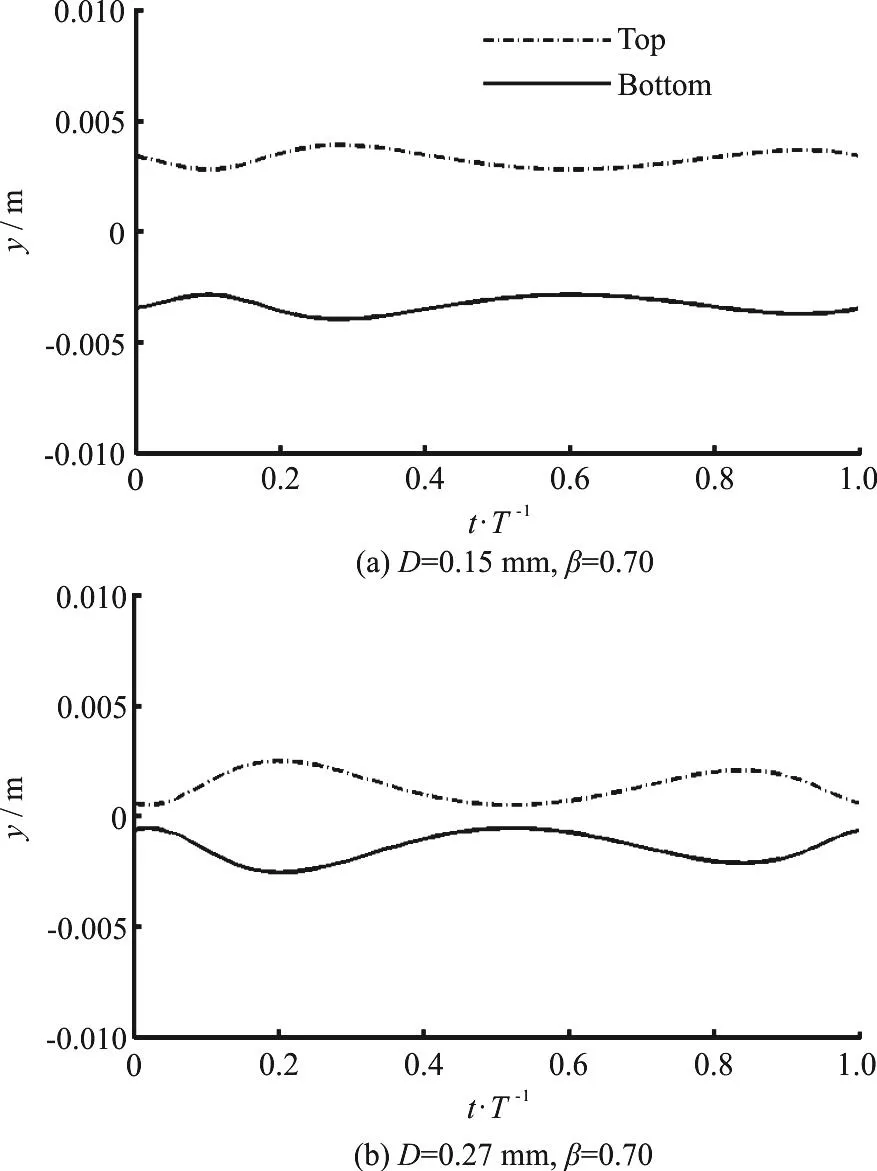
Fig. 3 Instantaneous erosion depths in pure acceleration-skewed flow
As illustrated by Nielsen[10], due to the acceleration skewness, the boundary layer takes less timeto develop to the stage when U reaches the positive flow crest, but takes much more timeatT to develop to the stage when U reaches the negative flow trough. The value ofBU near the flow crest is larger than that near the flow trough with relatively smallerBδ as shown in Eq. (3). The value ofBδ decreases near the flow crest and increases near the flow trough with an increase of β, leading to a large difference ofBδ between the flow crest and the flow trough. Thus, the crest shear stress is larger than the trough one as observed by Suntoyo et al.[8]and is included in the formula definition[5,6,19]. So in Fig. 3,Δ near the flow crest is larger and more sediment is carried up than that near the flow trough, which is an important reason for the positive net transport rate.The effect of the acceleration would be related to the development of the boundary layer.
Figure 4 shows the computed periodic averaged sediment flux φ for the cases=0.58-0.70,0.15 mm, 0.27 mm. The averaged φ is also shown mainly near the initial bed as in the cases in the pure velocity-skewed flow[19-20]. All profiles of the averaged φ in the figure have the same shape, taking positive values at any location, and the maximum value is taken in places a little under the initial bed,with different positions for different sediment sizes because the sediment amounts in the movement are different. The averaged φ decreases with the increase of D in places both above and under the initial bed for the same β, and decreases with the decrease of β for the same D. The dec- rease with D is in accordance with the decrease of Δ in Fig. 3.The decrease with β is in accordance with the development of the boundary layer related to the acceleration skewness, where the boundary layer difference between the flow crest and the flow trough is decreased by the decrease of the acceleration skewness and β. Otherwise, all averaged φ is zero without the acceleration skewness, and the free stream is reduced to a sinusoidal flow.

Fig. 4 Period averaged sediment fluxes in pure accelerationskewed flow
Figure 5 shows the two-phase result about the instantaneous sediment flux profile for different D with the same=0.70 . The four time sections correspond to the flow reversathe flow crestand the flow trough) as seen in Fig. 1. The flux at the flow crest (/t T=0.18) is larger than that at the flow troughin Fig. 3, even whencorresponding to the cases of Ruessink et al.[4]also pointed out that the sediment transport process may be correlated to the flow acceleration, suggesting that Δ is larger and more sediment is mobilized at the flow crest than at the flow trough. The phase lead effect could be seen from the instantaneous sediment flux in Fig. 5. Obvious sediment flux exists at the time of the flow reversal due to the bottom shear stress and the velocity phase lead related to U. The flux at the time of the flow reversal / =0t T is larger than that at the timebecause a smaller Tdtmakes more sediment remain in the movement and a smaller δBcorresponding to a larger bottom UBand a larger shear stress at the time t/ T =0 than at the time t/ T =0.50[5-6]. The sediment flux at each time shown in Fig. 5(a) is larger than that shown in Fig.5(b), because the corresponding Δ in Fig. 3 for D =0.15 mm is larger than that for D=0.27 mm.

Fig. 5 Instantaneous sediment fluxes in pure acceleration-skewed flow for β =0.70
3.2 Boundary layer development
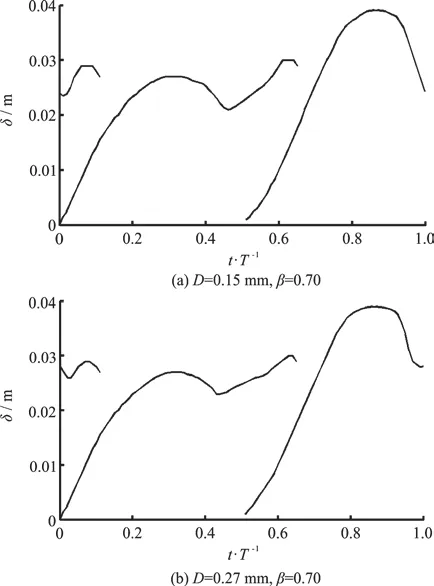
Fig. 6 Boundary layer thicknesses in pure acceleration-skewed flow
For a convenient illustration of the boundary layer development in the pure acceleration-skewed oscillatory sheet flow sediment transport, Fig. 6 shows the commonly defined boundary layer thickness δ as the distance from the immobile bed surface to the elevation at which the velocity defect is equal to 0.01mU, which is positively correlated toBδ and is equal toBδ at the flow crest as defined in Eq. (3).Two values are taken after the flow reversal because the boundary velocity is in a damped oscillation propagating upwards[7], where the top one is newly snapped in the current half period and the bottom one is developed in the previous half period. The newly snapped δ representingBδ grows with the increase of the flow velocity and disappears near the next flow peak. The boundary layer developments in the positive acceleration stage and the negative acceleration stage are different due to the acceleration skewness,and the value ofBδ near the flow crest is smaller than that near the flow trough. This is reasonable because, and the value ofBδ is positively proportional to the oscillatory flow orbital amplitude related to the acceleration timeacT ordcT .Thus in many studies, for a good description, the boundary layer is assumed to develop from the flow reversal to the flow peak[5-6,19], similar to that induced by a quarter of the sinusoidal velocity amplitudemU and the period 4acT or 4dcT , based on the assump-tion that the boundary layer development history before the flow reversal is neglected.

Fig. 7 Net current and periodic averaged φ for D=0.15mm and β =0.70
The difference of δBbetween the positive acceleration stage and the negative acceleration stage caused by acceleration skewness would lead to a net current, as shown in Fig. 7 in terms of the averaged periodic velocity based on y + Δ and y, respectively. β = 0.70 corresponds to the case in Fig. 6. If δBtakes a constant value, the development of δ is symmetrical within a period, and the net current based on y + Δ in Eq. (3) is 0 at every location. For the case in Fig. 7(a), δBnear the flow crest (t/ T=0.18) is smaller than that near the flow trough(t/ T =0.82) due to the fact that Tac Fig. 8 Comparison of instantaneous sediment transport rates with empirical formulas In Fig. 8, the instantaneous sediment transport rate q is compared with the results calculated with various formulas including: (1) Ribberink without consideration of the acceleration skewness[22]. (2)Nielsen and Gonzalez-Rodriguez with consideration of the acceleration skewness[13-14], and Fig. 9 shows the effects of various n in Sign()| / |nm U U U . For convenience, the Sign is neglected andthe offshore stage is mirrored in the opposite direction for comparison. The value of q calculated based on the two phase assumption follows the free stream velocity very well with a proper phase lead and a phase shift, and the value near the flow crest is always larger than that near the flow trough, leading to a positive net transport rate. For the same D in Fig. 8,the increase ofcq and the decrease oftq enlarge the positive net rate with the increase of β as measured in experiments, because the difference of Bδ between the positive acceleration stage and the negative acceleration stage is enlarged. When D increases, the computed q decreases because the shear stress decreases and less sediment is entrained instead of being carried away. This is in accordance with the decrease of Δ in Fig. 3. These are important reasons for the good estimation of the net transport rate in Fig. 2, whereas the approach of Ribberink cannot predict the difference between the positive acceleration stage and the negative acceleration stage without consideration of the acceleration skewness effect[5]. From the results of Nielsen and Gonzalez-Rodriguez, an obvious difference can be seen between the positive acceleration stage and the negative acceleration stage[5], as well as the tendency with β. However, the phase residual is not included in all these empirical formula and their results increase with the increase of D, even when the shear stress decreases, so their predicted result cannot be in good agreement with the experimental data of O’Donoghue and Wright[20]for all sediment sizes. The positive net transport rates increase with the decrease of D and the increase of β, as observed by van der[2]. The value ofBδ, which takes less time to develop at the flow crest, is smaller than that at the flow trough. Thus,BU and the shear stress near the flow crest are larger than those near the flow trough,as described by Eq. (3), and Δ near the flow crest is also larger with more sediment carried up than near the flow trough as shown in Fig. 3. The differences of Bδ and the relatedBU, the shear stress and Δ between the positive acceleration stage and the negative acceleration stage are the key factors for the positive net transport rate generated in pure acceleration-skewed flows. The effect of the acceleration skewness is mainly the results of the asymmetrical development of the boundary layer between the positive acceleration stage and the negative acceleration stage[6,21]. Fig. 9 Comparison of instantaneous sediment transport rates with U/ U m The instantaneous q can usually be approxi-In a pure accelerationskewed flowcalculated with the two-phase model can be approximated only in the positive flow stage as shown in Fig. 9, whereas in the negative flow stage, we have to consider /tq q because the trough ratetq is relatively smaller than /mq q due to the previous mentioned asymmetrical boundary layer development. The two-phase result for the positive flow in the fine case of=0.15 mm can be approximated by taking =1n , as shown in Figs. 9(a),9(b), in accordance with Eq. (5), because the phase residual is so large that the periodic Δ variation is small. While in the coarse case of=0.46 mm ,n =3 may be applied because the phase residual is much smaller than=0.15 mm , as shown in Figs.9(c), 9(d). This is also in agreement with Eq. (5) when the erosion depth can almost be approximated by the relation2 Δ∝U , as in agreement with the formulas[14,22]of Ribberink and Gonzalez-Rodriguez,wherewithout consideration of the phase lag in Figs. 8(c), 8(d). This implies that the positive net q still exists without the phase lag due to the acceleration skewness. The present work studies the sediment transport under pure acceleration-skewed oscillatory sheet flow conditions with a new analytical concept model and a developed two-phase model. The sediment transport almost follows the free stream velocity and is affected by the phase lag and the boundary layer development related to the acceleration skewness. In the analytical concept model, the approximated formulacan generally be unified as n decreases with the increase of the phase residual. The approximation is only validated in the positive flow stage for the pure acceleration-skewed flow, whereas in the negative flow stage,should be used instead becausedue to the asymmetrical boundary layer development. The concept model also shows the importance of the boundary layer thicknessBδ in the sediment transport. For the pure acceleration-skewed flow, the net transport rate is always positive, because the boundary layer development in the positive acceleration stage takes less time than in the negative acceleration stage due to the acceleration skewness,andBδ near the flow crest is smaller than that near the flow trough. The difference ofBδ between the positive acceleration stage and the negative acceleration stage leads to a net current and a net sediment flux penetrating fully into the sheet flow layer. The direction of the net current almost determines the total sediment flux direction, accompanying with a larger shear stress, Δ and the correlated sediment concentration near the flow crest than near the flow trough. The smallerBδ leads to largerBU, shear stress and Δ in the positive acceleration stage than in the negative acceleration stage, which is a key factor for the positive net transport rate generated in the pure acceleration-skewed flow. In conclusion, for the sediment transport in the pure acceleration-skewed oscillatory sheet flow, the effect of the acceleration skewness is mainly the results of the asymmetrical development of the boundary layer between the positive acceleration and negative acceleration stages. This work was supported by the Open Research Fund Program of State Key Laboratory of Hydroscience and Engineering of China (Grant No.sklhse-2015-C-03).3.3 Sediment transport rate


4. Conclusions
Acknowledgement
猜你喜欢
杂志排行

水动力学研究与进展 B辑的其它文章
- Call For Papers The 3rd International Symposium of Cavitation and Multiphase Flow
- Bubble dynamics and its applications *
- Experimental investigation of flow past a circular cylinder with hydrophobic coating *
- Transient peristaltic diffusion of nanofluids: A model of micropumps in medical engineering *
- High-speed experimental photography of collapsing cavitation bubble between a spherical particle and a rigid wall *
- Flow induced structural vibration and sound radiation of a hydrofoil with a cavity *