Experimental and numerical investigations of the aerodynamic noise reduction of automotive side view mirrors *
2018-09-28XinChen陈鑫ShuoWang汪硕YuanqiangWu吴元强YanyangLi李延洋HuaiyuWang王怀玉
Xin Chen (陈鑫), Shuo Wang (汪硕), Yuan-qiang Wu (吴元强), Yan-yang Li (李延洋),Huai-yu Wang (王怀玉)
State Key Laboratory of Automobile Simulation and Control, Jilin University, Changchun 130012, China
Abstract: This paper studies the aeroacoustics of the side view mirrors by wind tunnel tests and numerical simulations. The mirror is placed on a table in the wind tunnel test. Based on the experiment results, a numerical analysis model is established to analyze the acoustic field in the wake of the side view mirror by the Large Eddy Simulation (LES). The flow field and the noise level of two different side view mirrors are compared in the simulation. It is shown that, with the serration structures applied onto the mirror surface, the turbulence zone and the pressure fluctuation in the wake of the bionic model are improved effectively, which helps its flow control and noise reduction. Meanwhile, as is shown in the noise spectra, when the noise frequency is over 500 Hz, for the bionic mode,the noise is reduced to a lower level than with the original one, which further shows its effectiveness in the noise reduction.
Key words: Aerodynamic noise, side view mirror, flow field, acoustic field, bionic, noise reduction
Introduction
The wind noise generated by speeding cars is a main cause that disturbs the drivers and the passengers,so it is very important to reduce noise in the design of vehicles. The wind noise is generated by the external unsteady flow around the automotive body[1-2]. The side view mirrors are known to be one of the main wind noise sources[3-4]. The airflow separates at the edge of the mirror surface and leads to a severe pressure fluctuation on the side window[5]. Thus, to control the flow field near the side window is one of the measures to reduce the wind noise.
Some experiments were conducted to study the characteristics of the flow field and the acoustic field in the wake of the side view mirror. Chen et al.[6],measured the wind noise level of two production mirrors at the GM Aerodynamic Lab wind tunnel.Also, the unsteady flow field behind two side view mirrors and the wake structures around an external mirror of a passenger car were investigated experimentally[7]. Due to the high cost of experiments,numerical simulations based on the computational fluid dynamics (CFD) are widely used to deal with the vehicle aeroacoustics design issues. Some numerical simulation methods were proposed[8-9]to study the wind noise source and its generating mechanism[10-11].Lepley et al.[12], simulated the transient flow field around a mirror. Thorsten et al.[13], examined different combinations of meshing strategies and turbulence models in order to evaluate a ranking process for the noise generation. Yoshihiro et al.[14], proposed a method for performing the aeroacoustic simulation, in which the acoustic field is split from the flow field around a mirror placed on a plane. Both experiments and numerical simulations show that the extremely complex turbulence in the wake of the side view mirror is the key noise source. Some modifications of the shape of the mirror were suggested to improve the flow field, some with a good practicality[15-16].However, the noise reduction effect of these modifications seems not enough.
Owls are well known for their silent flight because of the unique geometry and structures of the wings. Three special features of their wings are found to be most essential for the performance, the velvet-like surface, the leading edge serrations and the trailing edge fringes[17]. They play a vital role in the noise reduction during the flight of owls[18]. In recent years, engineering applications inspired by the features of owls were made. Chen et al.[19]presented a hybrid optimization method for the determination of the optimal geometry parameters which can minimize the A-weighted sound pressure level of the bionic fan under the condition that the mass flow rate of the bionic fan is as high as possible. Ge et al.[20]designed a kind of active dimples/pimples to reduction drag force. It is shown that the noise level of the bionic blade in the 50-2 000 Hz frequency range is remarkable lower than that of the original blade. Chong et al.[21]studied the airfoil self-noise reduction by non-flat plate type trailing edge serrations and found that the non-flat plate serration not only reduces the broadband self-noise significantly but also eliminates the high-frequency noise. However, the application of the serration structures to the side view mirror remains an issue to be studied. On the one hand, the shape of the side view mirror is more complex as compared with airfoils and fan blades. It is difficult to build a model with serrations and conduct the wind tunnel test.On the other hand, the wind noise becomes a main noise source inside the car only at a high speed.
In this paper, a bionic side view mirror model is built, as inspired by the serrated structures of owls, to investigate the effects of the serrations on the wind noise generated by the mirror. The flow fields and the noise level are the main focuses.
1. Experiment setup
The experiments are conducted in the Automotive Wind Tunnel of Jilin University, which is a return circuit wind tunnel. The dimension of the rectangular test section is 2.2 m×4 m×8 m with a turntable to yaw suitably sized model. The range of the wind speed is from 5m/s to 60m/s. The background noise is considered in the design of the wind tunnel, so some improvements were made on the flow deflector at the tunnel corner to reduce the background noise.
The mirror used in the test is a typical production car mirror, placed on a table in the open test section as shown in Fig. 1. The legs and edges of the table are aerodynamically shaped to minimize non-mirror wind noise. Instead of securing the mirror to the table top directly, it is attached to a disk with a radius of 0.2 m.The disk is mounted on the centerline of the table surface.
The table is placed in the test section to hold the mirror and to facilitate the installation of the measuring instruments with the dimension of 1.2 m(length)×1.0 m (width). Figure 2 shows the arrangement of the measuring points on the table top. An array of pressure transducers are distributed on the table plane in the wake of the mirror (see Fig. 3). They are arranged in a circular arc of 400 mm in radius from the mirror bottom center within ±45° with an increment of 15°.
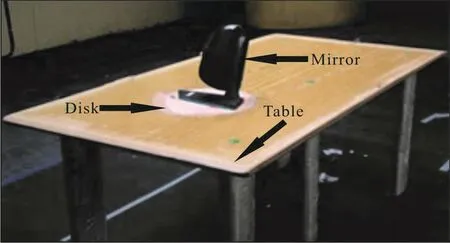
Fig. 1 (Color online) The test table with the mirror attached to it
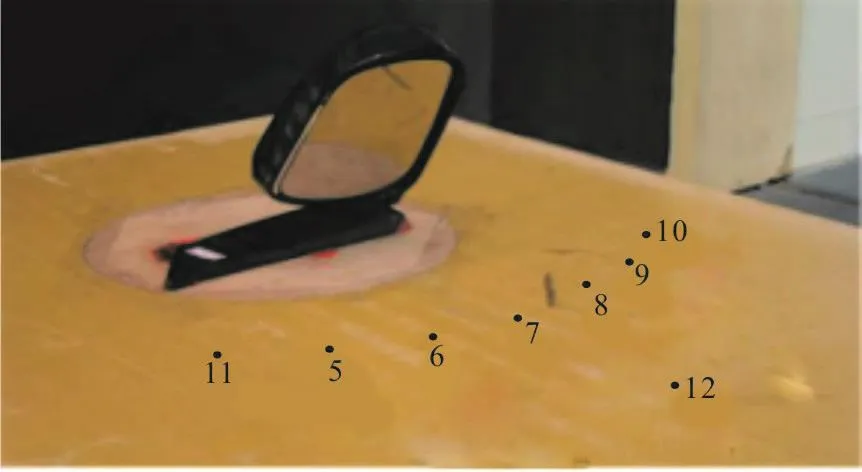
Fig. 2 (Color online) The measuring points on the table plane
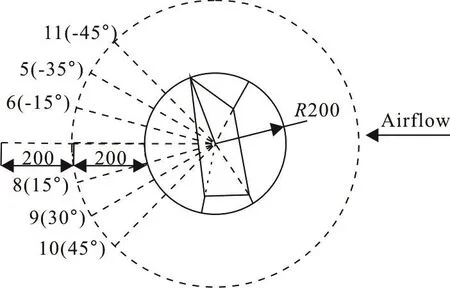
Fig. 3 Layout of the unsteady pressure transducers on the surface
2. Numerical setup
2.1 Methodology
The acoustic analogy (AA) is generally used as an effective approach to predict the aerodynamic noise.This method involves two steps: the simulation of the fluid domain using the large eddy simulation (LES)and the calculation of the noise based on the unsteady pressures recorded in the flow simulation.
In the LES, a filter function is used to filter out the eddies of scales smaller than the filter width used in the computation. The filtering variable is defined by
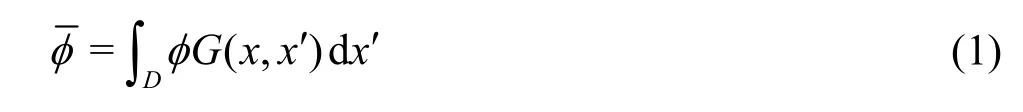
where D is the fluid domain, x′ is the spatial coordinates and x is the filtered spatial coordinates,G( x, x′) is the filter function, which determines the scale of the resolved eddies.
The filter function, G( x, x′) can be expressed as
where V is the volume of a computational cell. Then the filtered Navier-Stokes equation and the filtered continuity equation are obtained as

In the second step, the acoustic analogy of Ffowcs-Williams and Hawkins is used to calculate the sound spectrum at the acoustics receiver. The Ffowcs-Williams and Hawkins (FW-H) equation is
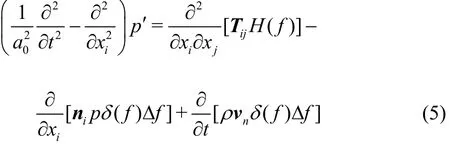
where p′ is the sound pressure, Tijis the Lighthill tensor and vnis the normal velocity.
2.2 Modeling and computational domain
The serrated structures were studied for aeroacoustic issues in various fields, like the airfoils and the fan blades. It is shown that the serrations do play an important role in the flow control and the noise reduction[22].
In this paper, the serrations are applied to the side-view mirror as described in Fig. 4. They are simulated under the same condition for the original model and the modified model, and the results are compared in term of the sound field and the flow structure in the wake. Figure 5 shows a unit of serration of 6 mm high, 5 mm wide, and a thickness consistent with the side-view mirror cover edge.Figure 6 shows the computational domain in the numerical simulation. The computational domain is set as follows: 10.2 m in length, 4.0 m in width,and 1.2 m in height. The mirror is arranged in a plate of 1.2 m in length, and 1.0 m in width. The distance between the inlet and the plate is three times of the length of the plate.
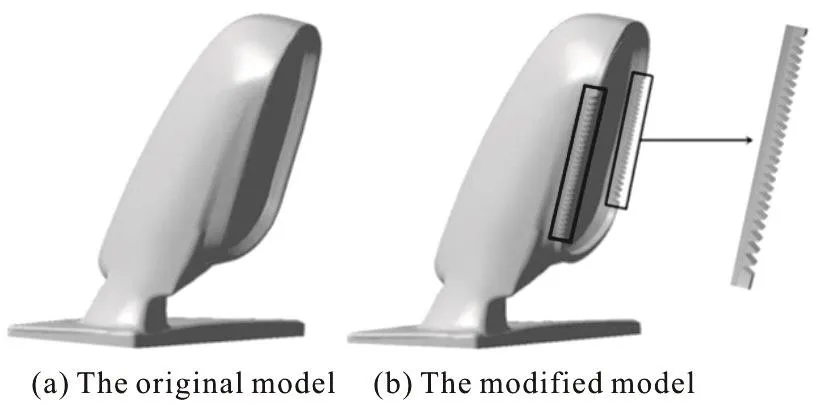
Fig. 4 Profiles of the two mirrors
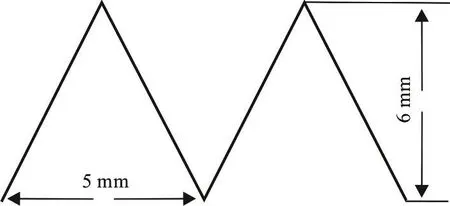
Fig. 5 Unit of serration
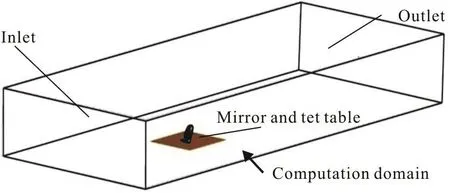
Fig. 6 (Color online) Computational domain
2.3 Mesh generation and turbulence model
Because the triangular surface mesh is more suitable for generating a complex-shaped model than the mesh with quadrilaterals or multi-sided polygons,a type of triangular mesh is applied in the present work. In the serration part of the mirror, smaller meshes are used with the size of 1 mm to simulate the flow characteristics accurately and the boundary layer meshes are generated to capture the airflow in the boundary layer region. The space in the whole computational domain is filled with semi-structured and unstructured meshes for the boundary layer calculation. Figure 7 shows the mesh distribution on the symmetry plane.
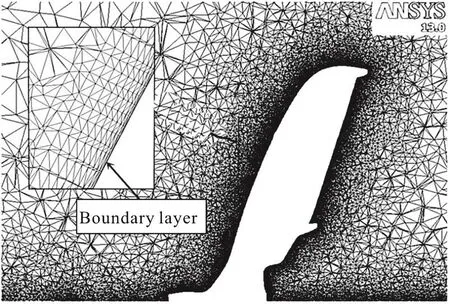
Fig. 7 Mesh distribution on the symmetry plane
In the steady calculation, the k-ω SST model is applied and the LES is used in the transient simulation process. In the LES simulations, the Smagorinsky-Lilly SGS model and the dynamic stress option are chosen for the calculation. Table 1. is the boundary condition setting table.
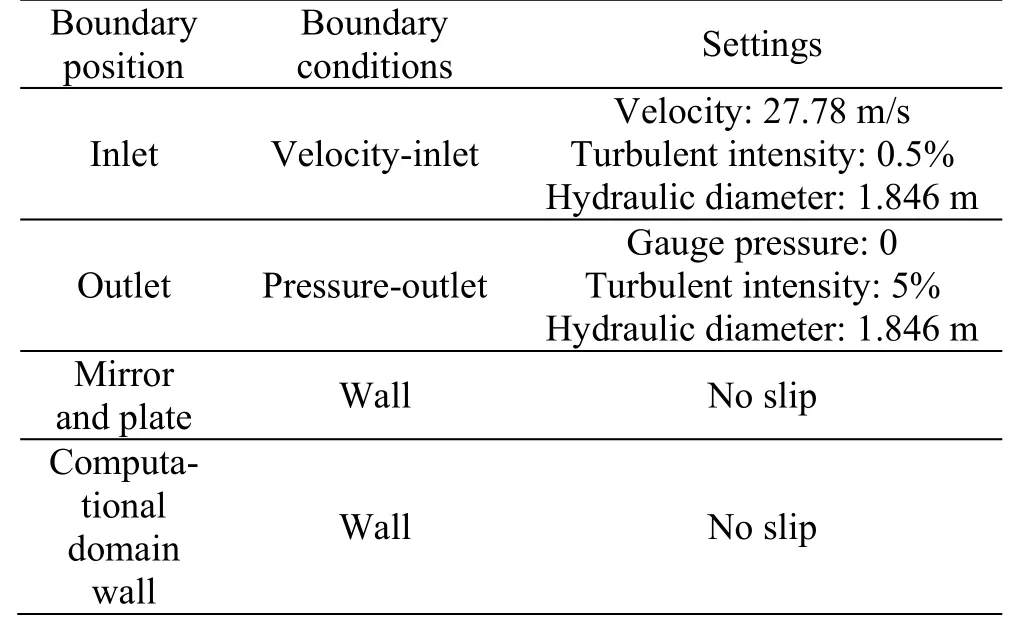
Table 1 Boundary conditions
3. Results and discussions
3.1 Test data
The test is conducted at four flow speeds (60 km/h,80 km/h, 100 km/h and 120 km/h). The veloci- ties used here are relatively high because the aerodynamic noise becomes a main problem only when the cars are running on the motorway at a high speed. During the test, the unsteady pressures are measured with microphones distributed on the table top. Then the pressure data are transformed into the sound pressure level (SPL) by the FFT. The noise spectra presented as the 1/3 octave SPL are shown in Figs. 8, 9. There are two measuring points on the centerline of the table behind the mirror.
The figures suggest that the noise level increases when the flow speed goes up for most cases in the frequency range. Furthermore, there is a sharp increase of the noise level when the flow speed rises from 60-80 km/h, while the increase is rather flat for other speeds.
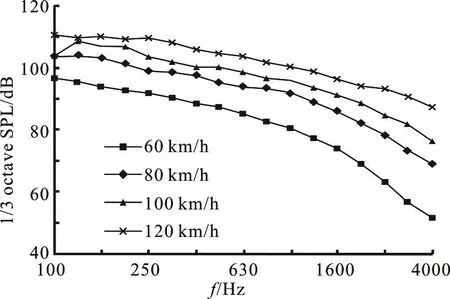
Fig. 8 Noise spectra at Point 7 for all four speeds
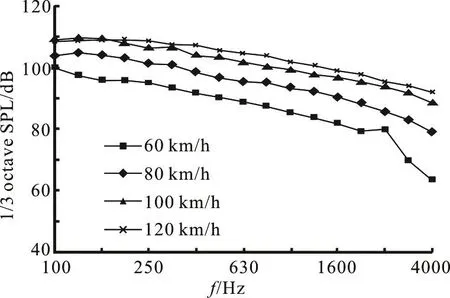
Fig. 9 Noise spectra at Point 12 for all four speeds
Compared with that at Point 7, the noise level at Point 12 is much higher, especially for frequencies above 400 Hz. As seen in Fig. 3, Point 7 and Point 12 are on the same line in the wake of the mirror but Point 12 is farther away from the mirror. It indicates that Point 12 is located in the area where there is a severe pressure fluctuation and a strong turbulent flow,meaning that the separation zone covers a long distance in the wake of the mirror.
To investigate the directivity of the sound source behind the mirror, six microphones (±45°, ±30°,±15°) are arranged in a circular arc pattern, with 15°between adjacent microphones on both sides of the centerline. Figure 10 shows the noise spectra at the six locations for all four speeds. As seen in the pictures,the sound spectra at each point are different, particularly in the lower frequency range. For a frequency below 1600 Hz, the two points where the SPL is the highest are Point 6 (-15°) and Point 8 (15°) which are closer to the centerline and the least noisy points are Point 9 and Point 10. This is due to the fact that Point 6 and Point 8 locate right in the recirculation zone behind the mirror and there the turbulence of the airflow is stronger. For a frequency above 2 500 Hz,there is no apparent distinction of the SPL for all four speeds. The results suggest that the sound directivity cannot be ignored for a low frequency but is not noticeable for a high frequency.
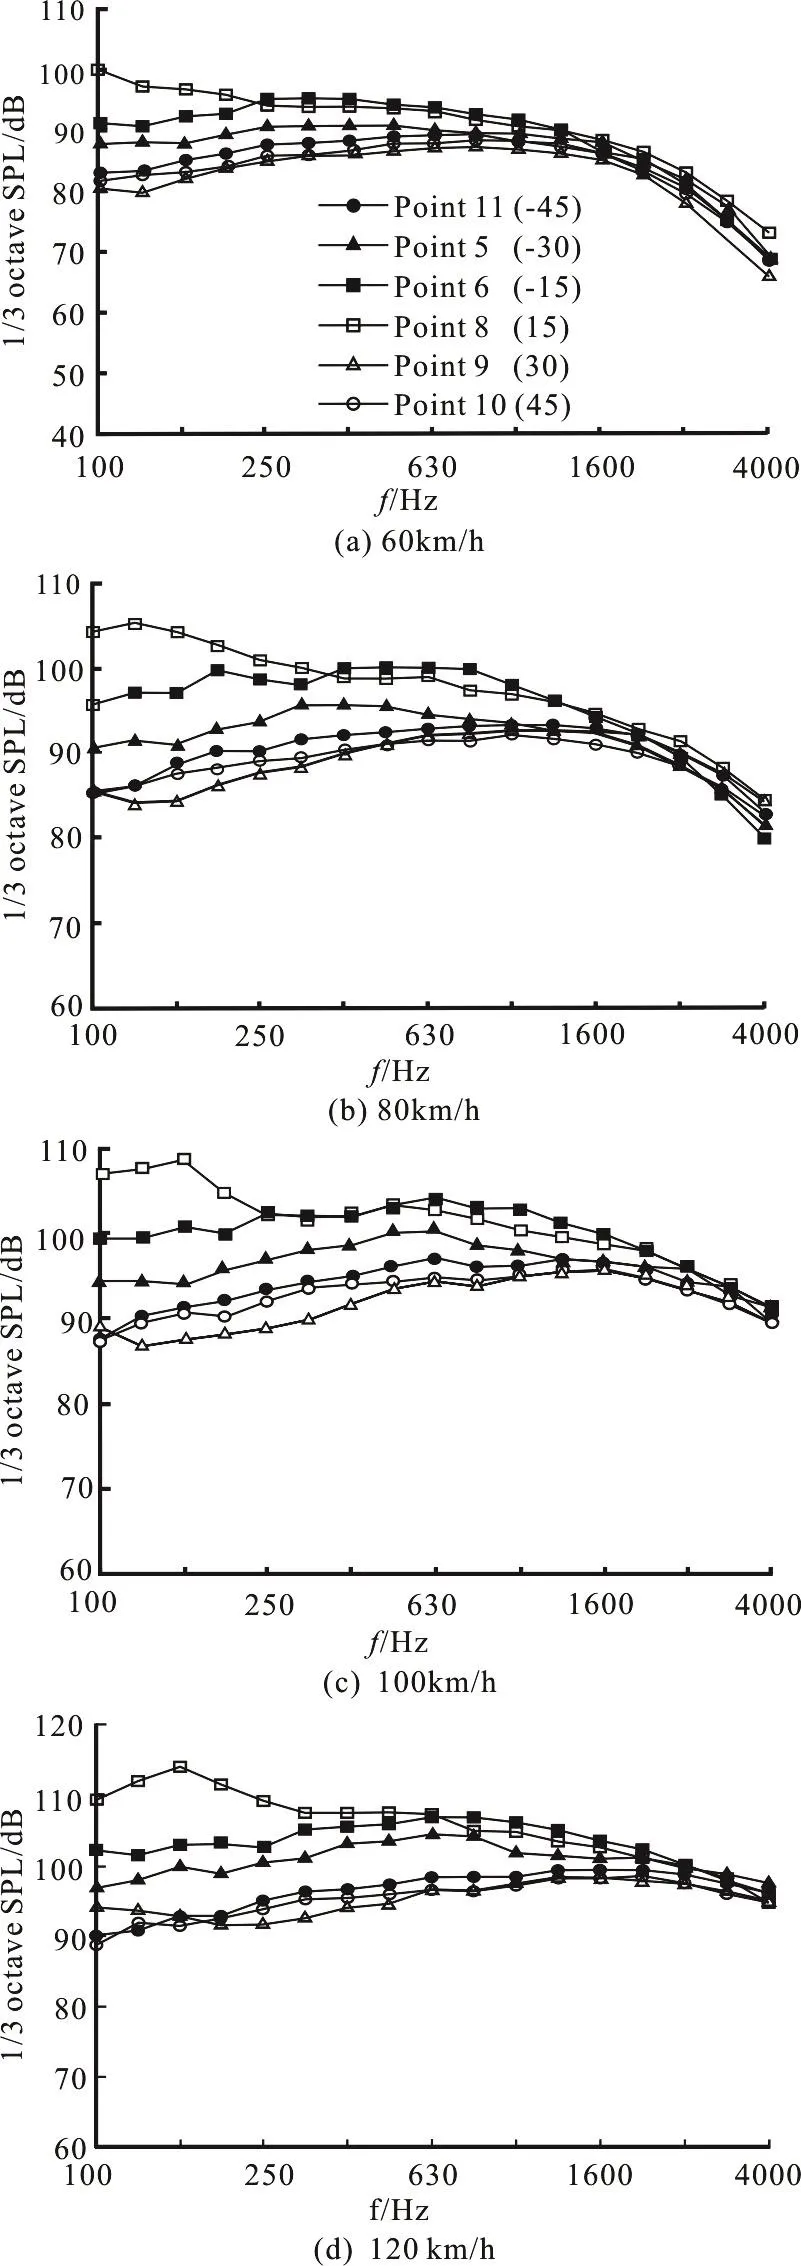
Fig. 10 Noise spectra for the surface microphones at “±45°”,“±30°” and “±15°” for flow speeds: 60 km/h, 80 km/h,100 km/h and 120 km/h
3.2 Numerical results
3.2.1 Noise prediction
Figure 11 shows the noise spectra at the measuring points for the inlet velocity of 100 km/h obtained by both experiments and simulations. The arrangement of the measuring points behind the model is the same as in the experiment. It can be seen in the pictures that the simulation results are in a good agreement with the experiment, whichshows the accuracy of the noise prediction by the CFD.
3.2.2 Flow field characteristics
To study the flow structure in the wake region,the mean velocity fields on a vertical and a horizontal plane (see Fig. 12) are presented in Fig. 13. The unsteadiness of the wake flow can be observed clearly from the pictures. On the vertical plane there are two main low-velocity zones in the wake region, one is right behind the reflective surface and the other one is much smaller and is caused by the mirror base. The flow separates at the top of the mirror and the shear layer downward remains almost parallel to the ground.On the horizontal plane, the flow separates on both sides and two low-velocity centers are formed behind the mirror. This phenomenon reveals the existence of the vortex flow, which is the cause of the aerodynamic noise.
Figure 13(b) shows the mean velocity field of the modified model. Compared with the original one, the turbulent region in the wake of the mirror is smaller in size. It indicates that the serration structures help the control of the flow field in the recirculation zone,which is beneficial for the noise reduction.
The instantaneous velocity fields on the vertical plane at different moments are shown in Fig. 14.Apparently they are more complicated and more disordered than the mean velocity field shown in Fig.13. Small vortex structures can be observed in the main separation zone behind the mirror and the vortices keep separating from the flow and move further downstream. In addition, the wall boundary layer behind the mirror is another turbulent region,which interacts with the main separation zone. Figure 14 shows the development of the vortices in the wake of the mirror.
Figure 15 compares the instantaneous vortex core region in the wake of the two mirror models. It indicates that the vortices form after the flow separates from the mirror surface and keep moving downwards. The difference between the two mirrors is that there are more small vortices near the modified mirror edge while the vortices of the original mirror are relatively larger in size. According the previous study of the owl feathers, the serration structures act as vortex generators to generate turbulence in microturbulences[21]. It is coincident with the phenomenon observed in Fig. 15(b).

Fig. 11 (Color online) Noise spectra on the table surface for inlet velocity of 100 km/h
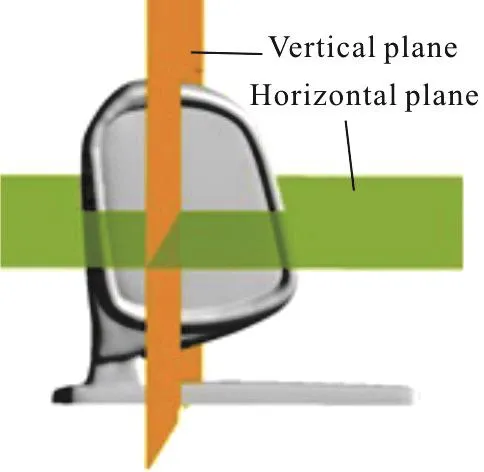
Fig. 12 (Color online) Two planes cutting through the mirror model
Figures 16, 17 show the mean surface pressure distribution for the two mirror models on the vertical plane and the mirror surface. Obviously, the fluctuation of the static pressure behind the original mirror is more severe than that behind the modified mirror and the pressure fluctuation area is larger. However, the pressure distributions on the mirror surface of the two models show little difference. The flow separates on the side of the mirror before reaching the edge for both mirror models. It is shown that the negative pressure zone in the wake of the mirror helps the form of vortex structures and the pressure fluctuation on the side window is the main source of the aerodynamic noise.
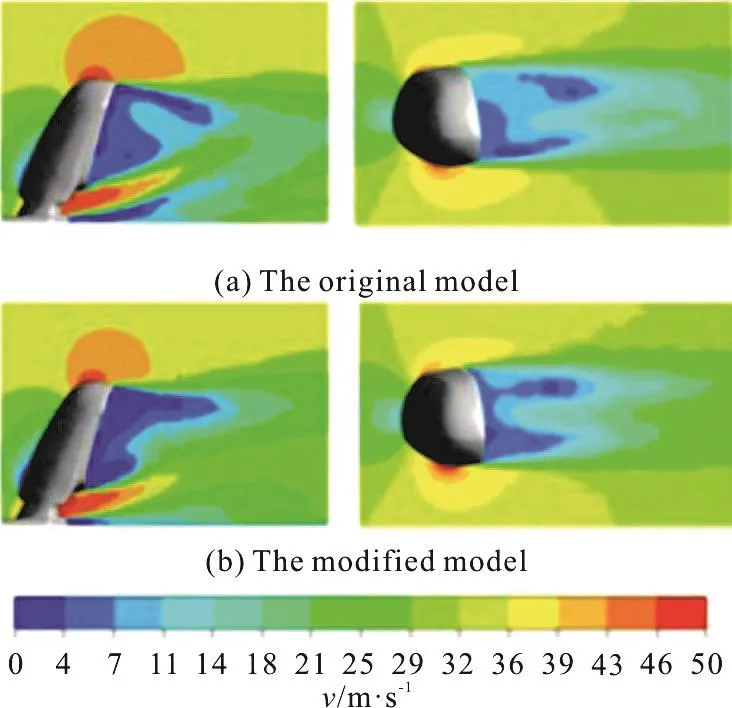
Fig. 13 (Color online) Mean velocity fields on the vertical and horizontal planes
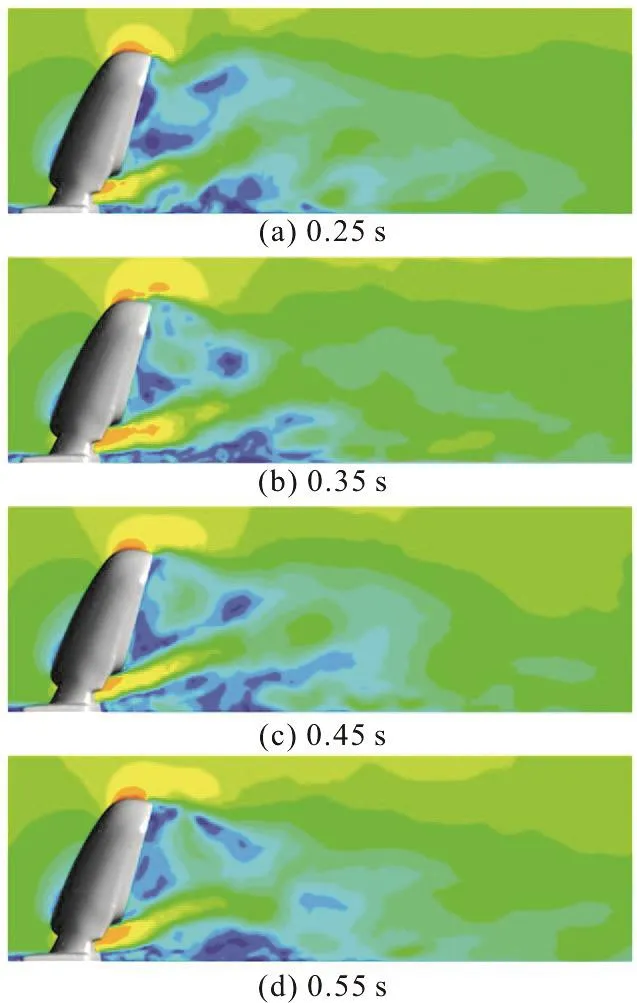
Fig. 14 (Color online) Instantaneous velocity fields on the vertical plane at four different moments
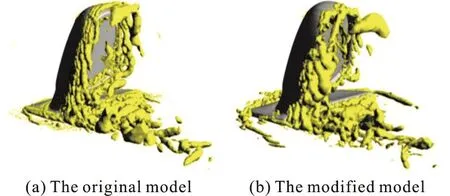
Fig. 15 (Color online) Instantaneous vortex core regions around the mirror
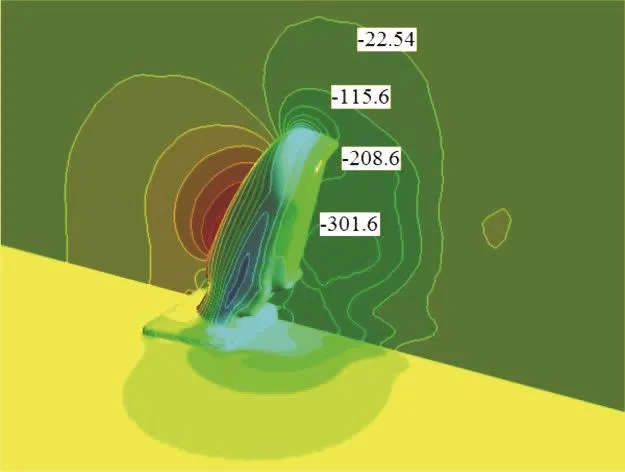
Fig. 16 (Color online) Mean surface pressure distribution of the original model (Pa)
The distributions of the turbulence kinetic energy on the vertical and horizontal planes are shown in Fig.18 together with the streamlines in the recirculation zone. The correlation between the vortices and the turbulence kinetic energy can be clearly seen in the figures. The turbulence kinetic energy is much higher in the centers of the vortices except for the larger vortex on the vertical plane. It indicates that the turbulence intensity goes up where vortices form in the vertical flow. The difference between the two models is that the turbulence kinetic energy in the wake of the modified model is lower than the original model, which means that the flow is less turbulent.And this is in a good agreement with the pressure distribution shown in Fig. 17.

Fig. 17 (Color online) Mean surface pressure distribution of the modified model (Pa)
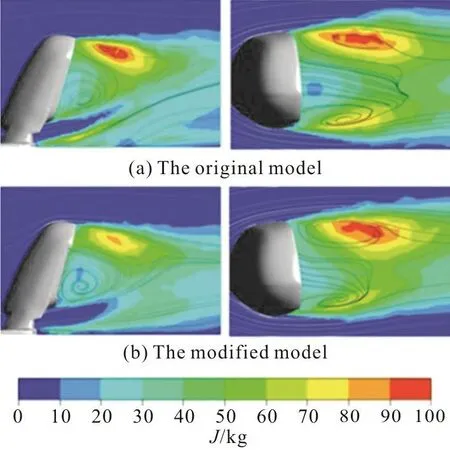
Fig. 18 (Color online) Distributions of turbulence kinetic energy on two planes
3.2.3 Noise analysis
The noise spectra at the measuring points in the simulations are presented in Fig. 19. It suggests that the noise level of the modified model is lower than that of the original model on the whole. The noise spectra have an obvious reduction for most of the frequencies at Point 5, Point 6, Point 10 and Point 11 and there is no much distinction for the other measuring points. Furthermore, for the frequency range below 500 Hz, the effect of the modification is much weaker as compared with the frequency range from 500 Hz to 5 000 Hz. It demonstrates that the noise source in the wake of the mirror has a great impact on the noise in the high frequency range above 500 Hz.
According to the above discussions, the less noisy points (Point 5, Point 6, Point 10 and Point 11)are on both sides of the mirror downstream and the serration structures are also on the sides of the mirror edge. Therefore, it can be concluded that the serration structures have a great effect on the noise sources near the sides of the mirror.
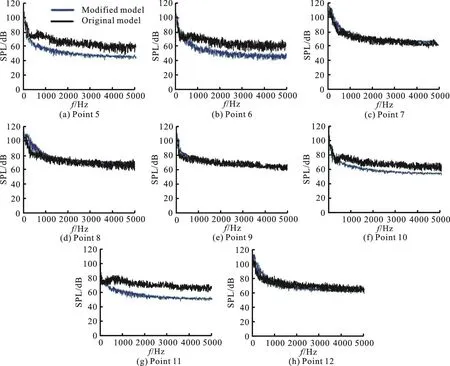
Fig. 19 (Color online) Noise spectra of the two models obtained by simulation for inlet velocity of 100 km/h
4. Conclusions
(1) In the tunnel test, the results gathered from different measuring points show that the noise levels vary according to the flow speeds and the SPL increases along with the speed. The noise peak behind the mirror is observed in the range between the 15°and -15°, revealing that the region directly behind the mirror is the chief source of the noise. The sound directivity can be observed in a low frequency range for this mirror.
(2) The test data and the computational data are compared in this paper. The noise spectra show a good agreement bet ween the experimental data and the simulation data, which provides a benchmark to validate the current CFD development.
(3) To investigate the generating mechanism of the wind noise and the noise reduction methods, the flow field characteristics of the original and modified models are analyzed in the simulation. The results suggest that there is a large separation zone behind the mirror model and the vertical flow structures are observed in this region, which is the main cause of the wind noise. The turbulence zone and the pressure fluctuation in the wake of the bionic model are improved effectively.
(4) The noise spectra of the two models are compared. It shows that, for frequencies above 500 Hz,the noise level of the modified model is lower than that of the original one. This shows that the serration structure on the mirror helps the flow control and the noise reduction.
The results of this paper provide a new direction to optimize the side view mirror design and might help the industrial applications.
Acknowledgements
Thanks for Shen Chuan-liang’s discussions and exchange of academic thoughts during the past few years. The authors would also like to thank Wang Jia-ning and Ruan Xin-jian for their assistances in preparing the manuscript.
猜你喜欢
杂志排行

水动力学研究与进展 B辑的其它文章
- Call For Papers The 3rd International Symposium of Cavitation and Multiphase Flow(ISCM 2019)
- Investigation of the hydrodynamic performance of crablike robot swimming leg *
- Determination of epsilon for Omega vortex identification method *
- Transient curvilinear-coordinate based fully nonlinear model for wave propagation and interactions with curved boundaries *
- Tracer advection in a pair of adjacent side-wall cavities, and in a rectangular channel containing two groynes in series *
- Numerical simulation of transient turbulent cavitating flows with special emphasis on shock wave dynamics considering the water/vapor compressibility *