Experimental and simulation study of nylon 6 solid-liquid extraction process☆
2018-06-29ChunxiQinJieTangFengleiBiZhenhaoXiLingZhao
Chunxi Qin ,Jie Tang ,Fenglei Bi,Zhenhao Xi,2,Ling Zhao ,2,*
1 Shanghai Key Laboratory of Multiphase Materials Chemical Engineering,East China University of Science and Technology,Shanghai 200237,China
2 State Key Laboratory of Chemical Engineering,East China University of Science and Technology,Shanghai 200237,China
1.Introduction
Solid-liquid extraction has attracted great interest due to it wide use in industrial processes,such as food engineering,bioengineering and polymer engineering[1].In polymer engineering,solid-liquid extraction processes are often applied to eliminate small molecules,i.e.,monomers and oligomers,from the polymer.The industrial extraction process of nylon 6 is a typicalsolid-liquid extraction,in which caprolactam(CL),cyclic dimers(CD)and cyclic trimers(CT)[2]are eliminated by hot water or CL-water solutions to meet the demands of industrial applications.
Nylon 6 solid-liquid extraction is a heterogeneous mass transfer process in which small molecules diffuse from the polymer phase to the solvent phase.Thus,it is of great importance to acquire the accurate mass transfer parameters of small molecules.Tai[2]and Seavey[3,4]estimated the CL diffusion coefficients in the nylon 6 melting system.Gaglione[5]acquired solubility data of CD in water and its CL solutions by molecular simulation.He found that the solubility of CD in water was larger than that in the CL-water solution,which contrasted with the similarity intermiscibility theory.Meanwhile,over the past few decades,simulations of nylon 6 extraction towers have drawn considerable attention.Chen simulated a nylon 6 extraction tower.However,due to the lack of detailed diffusion coefficients and equilibrium constants of CL,CD and CT,their simulations deviated from practice.Seavey[6]used Aspen Plus to simulate an extraction tower based on the work of Gaglione,which may not reproduce the CD extraction behavior in the tower due to the abovementioned inaccurate estimation of the CD solubility.
In industry,nylon 6 solid-liquid extraction often occurs in a countercurrent extraction tower,in which the polymer phase moves down and the solvent phase,water or its CL solution, flows upward.To improve the extraction efficiency,a new type of extraction tower was designed[7].At the top of this tower,the polymer particles are extracted by a high-concentration CL-water solution to eliminate most of the CD and CT.As the polymerparticles move down,CL and trace amounts of residual CD and CT are then extracted by water.Therefore,the whole extraction tower can be generally divided into two parts,i.e.,extraction of CD and CT with the CL-water solution and extraction of CL with water.To optimize this extraction process,it is of great importance to obtain the diffusion coefficients and equilibrium constants of CL diffusing from the polymer phase to water,as well as those of CD and CT diffusing from the polymer phase to the CL-water solution.
In this paper,nylon 6 particles were extracted by water and its CL solution separately to acquire the equilibrium constants and internal diffusion coefficients of CL,CD and CT.Then,with the acquired parameters,a simple but efficient numerical model was developed to simulate an industrial countercurrent extraction tower.Hopefully,the acquired parameters and established numerical model generate fundamental data and provide valuable insight to the industrial nylon 6 solid-liquid extraction process.
2.Experimental Method
2.1.Materials
Raw unextracted nylon 6 particles of which the shape was cylinder with a diameter of 0.70 mm and a height of 3.00 mm were provided by FangYuan Polymer Fiber Co.,Ltd.(Zhejiang,China).Other physical properties were listed in Table 1.The other reagents,including methanol and CL(analytically pure,>99%),were purchased from Aladdin(Shanghai,China).

Table 1 Physical properties of the unextracted nylon 6 particles
2.2.Experimental procedure
To investigate the extraction processes of CL and its oligomers(CD and CT),nylon 6 particles were separately extracted by water and its CL solution at a temperature of industrial interest,namely,338-383 K.All experiments were conducted in a 500 ml homemade glass batch vessel equipped with vigorous mechanical stirring.The mechanical stirring instrument was provided by ShenSheng Biotech Co.,Ltd.(Shanghai,China).
In a typical experiment,the weighed unextracted nylon 6 particles and solvent(water or CL-water solution at a specified concentration)were placed in the vessel to give a fixed liquid-solid(L-S)ratio of 3.Then,the vessel was placed in an electric heating bowl to maintain the system at the desired temperature within±1 K,and the mechanical stirring was set at an agitation rate of900 r·min-1to eliminate external mass transfer resistance.After a given time,samples of the solvent and polymer particles were extracted separately.Finally,the samples of the polymer particles were vacuum-dried in an oven at338 K for 48 h to ensure that the particle mass reached to a constant value.
2.3.Sample analysis
High-performance liquid chromatography(HPLC)(Waters 1525),equipped with an Agilent C18 column(4.6 mm i.d.,200 mm,particle size 5 μm)and an ultraviolet detector(Waters 2487,detection wavelength 210 nm),was used to quantify the concentration of CL,CD and CT in the solvent samples.The detailed analytical method was described in the literature[8].Then,the mass fractions of CL,CD and CT extracted from the polymer particles were acquired by mass conservation.
To monitor the variation in the microstructures of the polymer particles,scanning electron microscopy(SEM)(Nova NanoSEM 450,provided by FEI,America)and mercury intrusion porosimetry(PoreMaster33,supplied by Quantachrome,America)were applied.The pressure applied in mercury intrusion porosimetry(MIP)was in the range of 10 kPa-135 MPa,which corresponded to a pore radius range of 10-200000 nm.With the assumptions of cylindrical pores,480 mN·m-1surface tension and 141.3°contact angle,the mathematical relationship between pressure and the pore radius distribution was calculated using the Washburn equation[9].
3.Mathematical Models
3.1.Batch extraction models
The batch extraction models are developed under the following hypotheses:(1)The particles are isotropic,and diffusion only occurs in one dimension,i.e.,in the radial direction.(2)The equilibrium constant and diffusion coefficient are two invariant constants at fixed operation conditions.(3)The equilibrium correlation between the polymerand solvent phases is linear.
Forthe extraction experiments in a batch vessel,the extraction rate of CL,CD and CT can be described by the mass transfer equation under the hypothesis of(3),as shown in Eq.(1).Meanwhile,the mass conservation between the polymer and solvent phases is described by Eq.(2).Substituting Eq.(2)into Eq.(1)and then integrating Eq.(1),the extracted mass fractions of CL,CD and CT can be expressed as Eq.(3).Accordingly,using Eq.(3)to fit the experimental data,the equilibrium constants of the small molecules at different operation conditions can be determined.
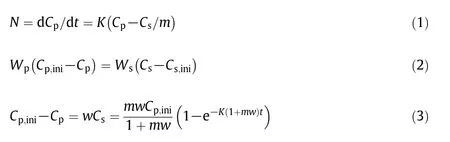
whereK,wandmrepresent the mass transfer coefficient,liquid-solid ratio and equilibrium constant,respectively;CandWare the mass concentration and mass;and the subscripts p,s and ini represent the polymer phase,solvent phase and initial moment,respectively.
To acquire the diffusion coefficients,Fick's law under the hypotheses of(1)and(2)is adopted,as shown in Eq.(4).From the work of Crank[10],Eq.(4)can be resolved analytically under the initial and boundary conditions of Eq.(5).Its result is shown in Eq.(6).Thus,applying Eq.(6)to reliably reproduce the experimental data,the diffusion coefficients of the small molecules at different operation conditions can be acquired.

whereDis the diffusion coefficient,qnare the positive,non-zero roots of Eq.(7),andais expressed as Eq.(8).
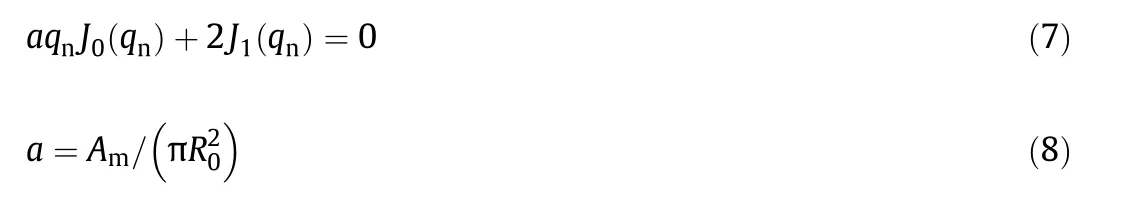
whereJ0andJ1are the Bessel functions of the first kind of orders 0 and 1,R0andAmrepresent the particle radius and submerged area of total particles,respectively.At the L-S ratio of 3,the particles can be considered to be completely immersed.
3.2.Model of the extraction tower
In the nylon 6 extraction tower,the velocities of the liquid and solid phases are approximately 1 mm·s-1,which indicates a low particle Reynolds number(approximately 10).In the condition of a packed bed,the effect of axial dispersion can be neglected because the Peclet number is approximately 30[11].Furthermore,the non-significance of axial dispersion has been also verified by cold-model experiments(see ‘Supplementary Material’for details).Thus,both the polymer and solvent phases are assumed to move in plug flow.Other assumptions are the same as those mentioned in Section 3.1.
For countercurrent extraction,the mass balance between the particle inlet and any other height(Fig.1a)can be written as Eq.(9).


Fig.1.Mass balance between the particle inlet and any other height(a)and schematic diagram of small molecules diffusing from the polymer interior to the solvent(b).
where φvindicates the mass flow,the subscripts av.,i and 0 represent the average concentration of particles extracted at the same time,the particle interface and the particle inlet,respectively.
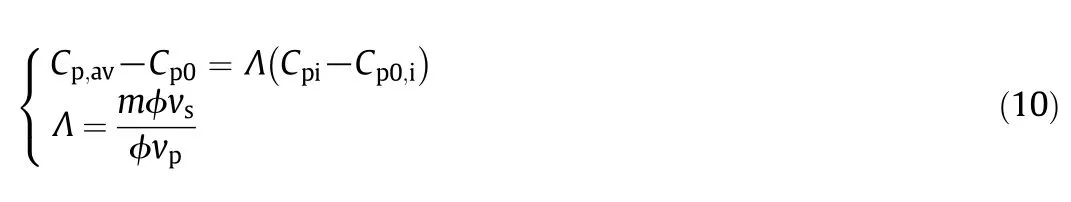
The mass conservation equation can be transformed into Eq.(10),in which the dimensionless number Λ is the capacity factor.
The nylon 6 solid-liquid extraction process in the tower can be characterized by unsteady internal diffusion in the polymer phase accompanied by a mass transfer process between the polymer surface and the surrounding solvent phase,as shown in Fig.1b.Thus,the internal diffusion of small molecules and their initial and boundary conditions can be written as Eqs.(11)and(12).Clearly,as shown in Eq.(12),the rate of small molecules diffusing from the particles is equal to the mass transfer rate between the polymer interface and the solvent phase.

whereksrepresents the mass transfer coefficient at the polymer interface.Since particles in the nylon 6 extraction tower move very slowly,kscan be estimated through the empirical correlation acquired from a packed bed,as displayed in Eqs.(13)and(14)[12,13].

where

By introducing four dimensionless numbers,θ,Ft,yandBim,which represent the dimensionless concentration,dimensionless time,dimensionless radius and ratio of internal and external diffusion resistance,respectively,Eqs.(11)and(12)can be transformed into Eqs.(16)and(17)correspondingly.

Solving Eq.(16)by Laplace transform,the average dimensionless concentration of small molecules in the particles can be obtained as follows[14]:when Λ≠1
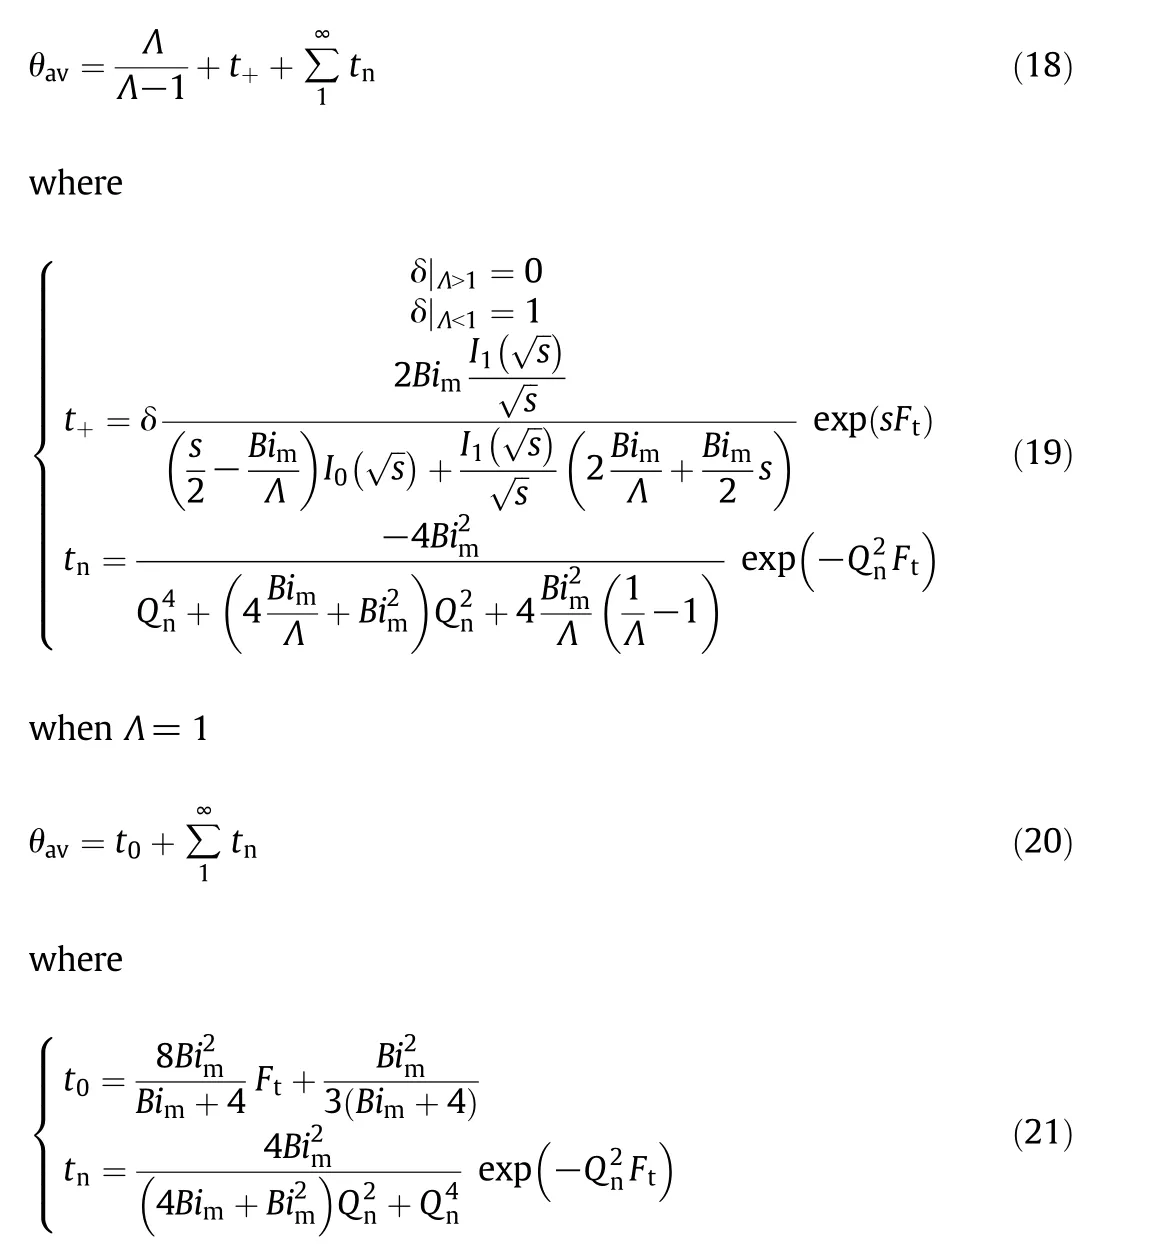
whereI0andI1represent the modified Bessel function of the first kind of orders 0 and 1,respectively,andsandQnare the positive roots of Eq.

Then,two other dimensionless numbers,the dimensionless concentrations of polymer phaseXand solvent phaseY,involved in the mass balance of the extraction tower and the diffusion model of a single particle are defined in Eqs.(23)and(24).In the extraction tower,Ftis a function of tower height,as shown in Eq.(25).Ultimately,the mass fraction of small molecules in the polymer and solvent phases at different tower heights are acquired by substituting θavandFtinto Eqs.(23)and(24),respectively.

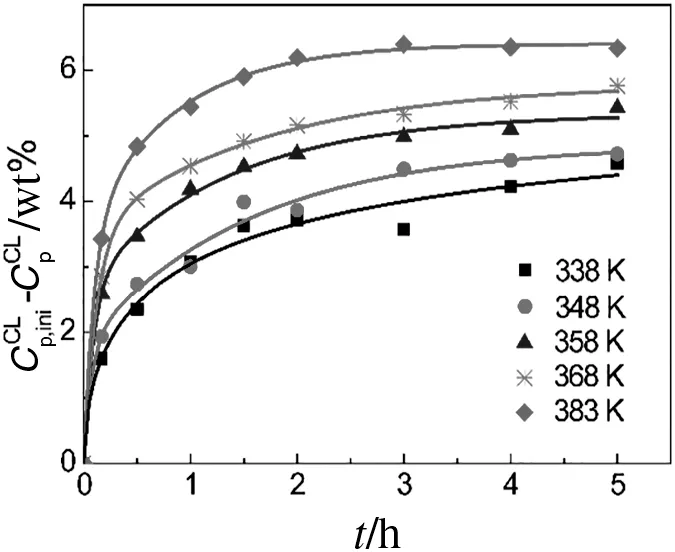
Fig.2.Temperature effects on the extracted CL mass fraction with water and a L-S ratio of3.
4.Results and Discussion
4.1.Batch extraction behavior
The extraction rate in the batch extraction experiments can be described by Eq.(1).For nylon 6 solid-liquid extraction process,the small molecules diffuse out from solid phase into liquid phase continuously.The concentration of small molecules in the liquid phase,namelyCs,increases with the extraction proceeded,while that in the solid phase,namelyCp,decreases,resulting in the reduced driving force of mass transfer,as shown in Eq.(1).Thus,the extraction rate is close to zero with a long extraction time,and the profiles of extracted mass fraction of small molecules increase firstly,along with an equilibrium tendency subsequently,as shown in Figs.2 and 3.
Figs.2 and 3a display the temperature effects on the extracted mass fraction of CL and CD using water and 20 wt%CL-water,respectively.The figures clearly show that the extraction rate is accelerated by an increase in temperature because the molecular thermal-motion is enhanced.Fig.3b displays the effects of the CL-water concentration on the elimination of CD at a temperature of 358 K.It is obvious that the extraction rate of CD is insensitive to the CL-water concentration.This is because the extraction rate is mostly influenced by the internal diffusion resistance after eliminating the external resistance by stirring.Because nylon 6 particles do not swell in CL-water solutions[15],the internal diffusion rate is not influenced by the CL-water concentration.Meanwhile,as shown in Figs.2 and 3,the equilibrium extracted CL mass fraction is significantly enhanced with increasing temperature,while that of CD is improved by increases in both the temperature and the CL-water concentration.
As the extraction proceeds,the porous structure at the particle surface becomes clearer,as shown in Fig.4.Moreover,the pore size distributions of the particles measured by MIP are displayed in Fig.5.The distributions clearly show that macro-pores larger than 10000 nm begin to appear at approximately 10 min and obviously increase as the extraction proceeds.This phenomenon reveals that in the initial 10 min,surface diffusion,which represents the dissolution of small molecules attached to the polymer surface,is dominant.Then,small molecules gradually diffuse from the particle interior,forming an increasing amount of macro-pores,which indicates that the process controlling extraction shifts from surface diffusion to internal diffusion.
As discussed above,two distinctsteps,characterized as surface diffusion and internal diffusion,indeed occur in our batch extraction experiments.To reproduce the experimental data,studies have noted that these two distinct steps should be described by two different diffusion coefficients[16-18].Thus,it is necessary to determine the demarcation point between these two steps.Table 2 lists the CL mass fraction extracted from the polymer particles using 20 wt%and 40 wt%CL-water at 368 K.It is obvious that 2.7 wt%CL can be extracted,although the 20 wt%and 40 wt%CL-water solutions highly exceed the equilibrium concentration.Thus,this 2.7 wt%CL can be regarded as the amount of substance attaching to the particle surface and is supposed to be the demarcation point between the surface diffusion and internal diffusion steps.Accordingly,the demarcation time is displayed in Table 3,based on 2.7 wt%CL as the demarcation point.It clearly presents that the demarcation time at 368 K is 7.2 min,which is consistent with the MIP result in which macro-pores begin to appear in the range of 6-10 min.This further proves that regarding 2.7 wt%CL as the demarcation point is credible.Similarly,the demarcation point of CD and CT are determined by the same method,and as shown in Table 2,their values are 0.12 wt%and 0.13 wt%,respectively.

Fig.3.Temperature effects on the extracted CD mass fraction with 20 wt%CL-water and a L-S ratio of 3(a)and CL-water concentration effects on the extracted CD mass fraction at 358 K and a L-S ratio of 3(b).
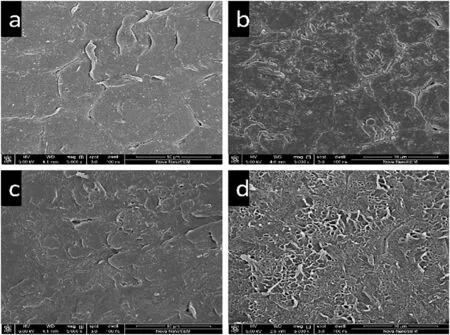
Fig.4.Microstructures of the particle surface at different extraction times(a.6 min,b.10 min,c.30 min,and d.60 min;extraction conditions:368 K,water solvent,L-S ratio of 3).

Fig.5.Pore size distributions of the particles extracted at different times(extraction conditions:368 K,water solvent,L-S ratio of 3).

Table 2 Extracted CL,CD and CT mass fraction at different times with different solvents(extraction conditions:368 K,L-S ratio of 3)

Table 3 Demarcation time at different temperatures
By applying two different diffusion coefficients,the experimental data are well reproduced by the diffusion model,as shown in Fig.6.It is clear that the surface diffusion coefficient is much larger than the internal diffusion coefficient.In industry,substances attached to the particle surface are removed in the pre-extraction tower.In Section 4.2,our simulation focuses on the main-extraction tower,in which only internal diffusion occurs.Therefore,only the internal diffusion coefficients are displayed here.

Fig.6.Assuming 2.7 wt%CL as the demarcation point to reproduce the experimental data(extraction conditions:348 K,water solvent,L-S ratio of 3).
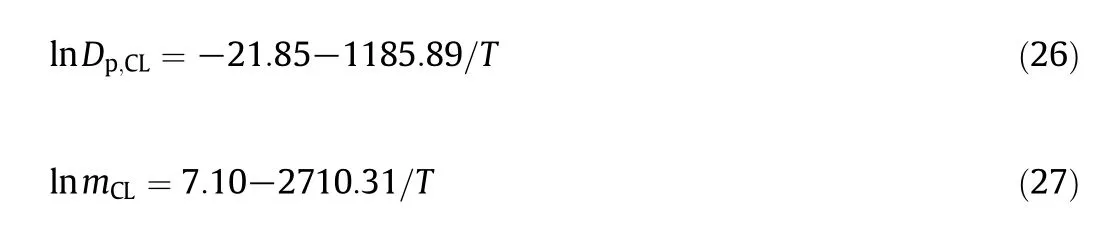
Applying the mass transfer mechanism[Eq.(3)]and the diffusion model[Eq.(6)]of the two distinct steps,i.e.,surface diffusion and internal diffusion,to fit the experimental data shown in Fig.2 separately,the equilibrium constants and internal diffusion coefficients of CL can be acquired,as shown in Fig.7.It can be clearly seen that both the internal diffusion coefficients and equilibrium constants of CL increase with temperature.In addition,they can be expressed in the form of the Arrhenius equation[Eqs.(26)and(27)].
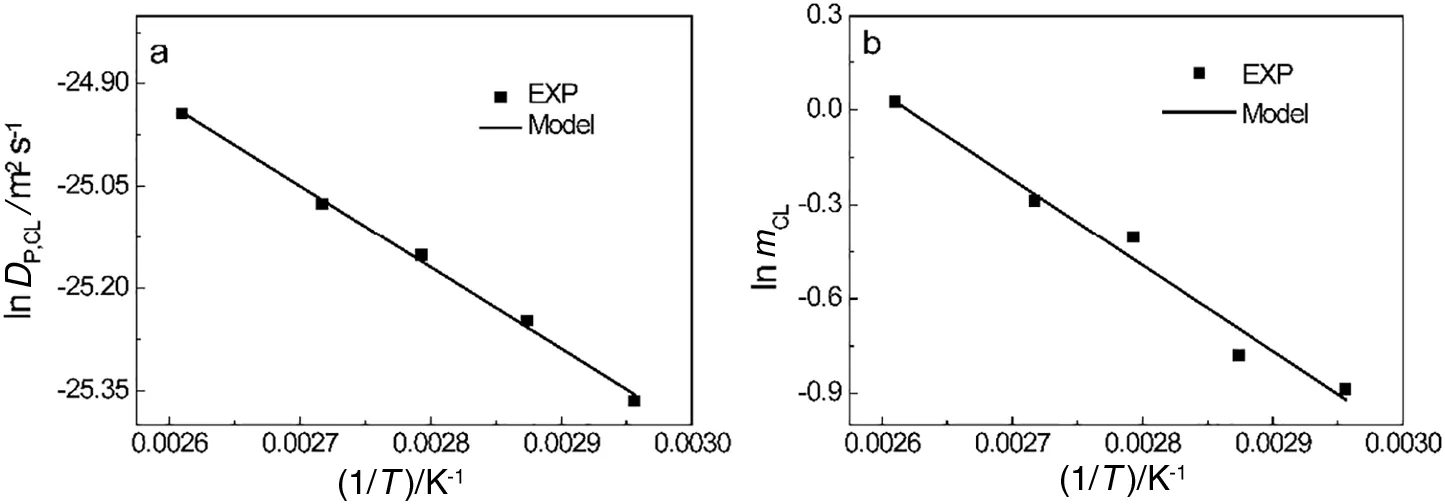
Fig.7.Internal diffusion coefficients(a)and equilibrium constants(b)of CL with respect to temperature using water to the extract particles.
Similarly,the equilibrium constants and internal diffusion coefficients of CD and CT can also be obtained by reproducing the experimental data shown in Fig.3(other experimental data are shown in the‘Supplementary Material’)using the mass transfer mechanism[Eq.(3)]and the diffusion model[Eq.(6)]of the two distinct steps,respectively.The results are listed in Tables 4 and 5.Obviously,the equilibrium constants and internal diffusion coefficients of CT are larger than those of CD,which reveals that CD is more difficult to remove from the particles.This phenomenon possibly results from stronger hydrogen bonding existing in the CD molecules[19,20].Furthermore,the equilibrium constant is enhanced with an increase in either the temperature or the CL-water concentration,whereas the internal diffusion coefficient is only influenced by the temperature due to the un-swelling effect of the CL-water solution on the nylon 6 particles.Ultimately,the equilibrium constants and diffusion coefficients of CD can also be expressed in the form of an Arrhenius equation as follows.


Table 4 Equilibrium constants and diffusion coefficients of CD at different temperatures and solvent concentrations

Table 5 Equilibrium constants and diffusion coefficients of CT at different temperatures and solvent concentrations

4.2.Simulation of the extraction tower
To verify our numerical model,a nylon 6 extraction tower reported in the literature is simulated,the parameters of which are listed in Table 6[21].Table 7 shows the comparison of the design values andour simulation results.It is clear that the simulation results are very close to the design values,which reveals that our numerical model and acquired parameters are credible.

Table 6 Parameters of the extraction tower

Table 7 Comparison of the design values and our simulation results
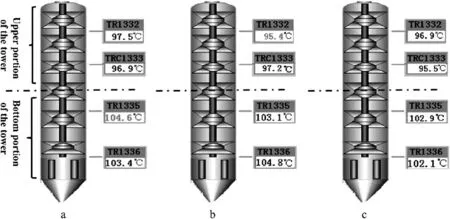
Fig.8.Temperature distribution in the extraction tower[supplied by the FangYuan Polymer Fiber Co.,Ltd.(Zhejiang,China)].
A temperature distribution frequently exists in industrial nylon 6 extraction towers.Fig.8 shows the temperature distributions monitored by proportional-integral-derivation(PID)controllers(supplied by the FangYuan Polymer Fiber Co.,Ltd.(Zhejiang,China)).The temperature at the bottom portion of the tower is higher than that at the upper portion because water in the bottom of the tower can be superheated with the pressure provided by the water in the upper tower.Meanwhile,the division point between the low-and high-temperature areas is almost in the middle of the tower.Thus,the extraction tower can be divided equally into a low-temperature upper portion and a high-temperature bottom portion.
The effect of temperature on CL elimination with water as the solvent is shown in Fig.9,where the zero point of thex-axis represents the top of the tower.Obviously,the profile shape of CL elimination is convex.This is because at the L-S ratio of 1,the equilibrium between the water and polymer phases is still an important factor due to the equilibrium constant of CL being less than 1 for temperatures in the range of 363-383 K.Meanwhile,for the countercurrent extraction process,the effect of the equilibrium is amplified at the upper portion of the tower.As shown in cases 1 and 2 and cases 3 and 4,increasing the temperature at the upper portion of the tower has little effect on the extraction efficiency,whereas enhancing the temperature at the bottom portion of the tower obviously improves the extraction efficiency,which is clearly shown in cases 1 and 3 and cases 4 and 5.This is because for CL elimination at the upper portion of the tower,the extraction rate,expressed in Eq.(30),mainly depends onCsi-Csdue to the polymer and solvent phases approaching the equilibrium state.However,at the bottom portion of the tower,the polymer and solvent phases are far from the equilibrium state,and the extraction rate is influenced by bothCsi-Csandks,which results in the extraction efficiency becoming more sensitive to the temperature at the bottom portion of the tower.Meanwhile,comparing cases 4 and 6,the extraction time can be reduced from 22 h to 15 h by increasing the temperature at the bottom portion of the tower by only 5 K.

Fig.9.Temperature effects on CL elimination in the extraction tower with water and a L-S ratio of 1(the elements in the legend(A[B C]D)represent case number,temperature at the upper portion of the tower,temperature at the bottom portion of the tower and total residence time,respectively).

As mentioned in Section 4.1,CD is more difficult to remove from the particles because the equilibrium constants and internal diffusion coefficients of CT are larger than those of CD.Thus,in the following section,only the extraction process of CD is discussed.Fig.10 displays the effect of the feeding point of 30 wt%CL-water on CD extraction.It is clear that CD can be removed more efficiently compared with the water extraction process.Meanwhile,the elimination of CD becomes increasingly efficient with an increasing amount of particles extracted by 30 wt%CL-water.These results occur because the high-concentration CL-water solution enhances the equilibrium constant,which amplifiesCsi-Csand makes CD elimination more efficient.However,the excessively large amount of particles extracted by the high-concentration CL-water solution leads to a reduction in CL elimination.Therefore,it is significant to determine the preferable location at which the high-concentration CL-water solution should be fed.Table 8 lists the mass fraction of CD in particles at different feeding points using different CL-water solutions.It is obvious that when the feeding point is higher than the dimensionless tower height of 0.3636,CD elimination becomes insensitive to the increasing portion of particles extracted by the CL-water solution.For example,using 40 wt%CL-water,the CD mass fraction decreases by 0.11 wt%when the feeding point is raised from 0.2727 to 0.3636,compared with only 0.08 wt%when the feeding point is raised from 0.3636 to 0.4545.Thus,the feeding point of the high-concentration CL-water solution should be lower than the dimensionless tower height of 0.3636.

Fig.10.Feeding point effects on CD elimination in the extraction tower with 30 wt%CL-water and a L-S ratio of 1([368,373]20 h).

Table 8 Mass fraction of CD in particles at different feeding points and concentrations of the CL-water solutions(368 K,zero represents the top of the tower.)
Furthermore,the profile shape of CD elimination is concave,which is different from that of CL elimination.This is because mass transfer is more important to CD elimination at the L-S ratio of 1 because equilibrium constants of CD are larger than 1.15 at368 K.As the extraction proceeds,CD becomes increasingly difficult to diffuse from the particle interior,which results in an insignificant change in the extraction efficiency near the particle outlet.
5.Conclusions
Two distinct steps,characterized as surface diffusion and internal diffusion steps,indeed exist in the nylon 6 batch extraction experiments.With the mass transfer mechanism and the diffusion model of two distinct steps,the equilibrium constants between solid-liquid phases and internal diffusion coefficients of the small molecules are obtained.It is found that the equilibrium constants are influenced by both temperature and solvent concentration,whereas the diffusion coefficients are only affected by temperature.In an industrial countercurrent nylon 6 extraction tower,increasing the temperature at the bottom portion of the tower can clearly improve the extraction efficiency.The CD removal efficiency is significantly improved by using high-concentration CL-water solutions,where the feeding point is preferably less than the dimensionless tower height of 0.3636.Furthermore,in the extraction tower the equilibrium between solid-liquid phases is significant to CL elimination,whereas mass transfer plays an important role in CD elimination.
Nomenclature
aratio of the solution and particle volumes,defined in Eq.(8)
Amsubmerged area of the polymer,m2
Bimdefined in Eq.(15)
Cmass fraction
Ddiffusion coefficient,m2·s-1
dcharacteristic length,m
Ftdimensionless time
F11total residence time of polymer phase in the tower
Gadefined in Eq.(14)
gacceleration of gravity,m2·s-1
Htotal tower height,m
J0Bessel function of the first kind of order 0
J1Bessel function of the first kind of order 1
Koverall mass transfer coefficient,s-1
ksL-S interface mass transfer coefficient,m·s-1
I0modi fed Bessel function of the first kind of order 0
I1modi fed Bessel function of the first kind of order 1
mequilibrium constant
Nextraction rate,s-1
Necdefined in Eq.(25)
Qnpositive roots of
qnpositive roots ofaqnJ0(qn)+2J1(qn) =0
R0radius of unextracted particles,mm
Resdefined in Eq.(14)
rradius,mm
Scsdefined in Eq.(14)
Shsdefined in Eq.(14)
sroot of
Ttemperature,K
ttime,h
vvelocity of solvent phase,m·s-1
Wmass,kg
wL-S ratio
Xdimensionless concentration of the polymer phase in the tower,defined in Eq.(23)
Ydimensionless concentration of the solvent phase in the tower,defined in Eq.(24)
ydimensionless ratio,defined in Eq.(15)
ZTower height,m
θ dimensionless concentration of the polymer phase,defined in Eq.(15)
δ defined in Eq.(19)
Λ capacity factor,defined in Eq.(10)
μsviscosity of the solvent phase,Pa·s
ρsdensity of the solvent phase,kg·m-3
φvmass flux,kg·h-1
Superscripts
0 Particle inlet
1 Particle outlet
Subscripts
av average
CD cyclic dimer
CL caprolactam
i interphase
ini initial
p polymer
s solvent
[1]X.Jing,H.Y.Mi,T.Cordie,M.Salick,X.F.Peng,L.S.Turng,Fabrication of porous poly(ε-caprolactone)scaffolds containing chitosan nanofibers by combining extrusion foaming,leaching,and freeze-drying methods,Ind.Eng.Chem.Res.53(46)(2014)17909-17918.
[2]K.Tai,T.Tagawa,The kinetics of hydrolytic polymerization ofε-caprolactam.V.Equilibrium data on cyclic oligomers,J.Appl.Polym.Sci.27(8)(1982)2791-2796.
[3]K.C.Seavey,N.P.K.And,Y.A.Liu,T.N.Williams,C.C.Chen,A new phase-equilibrium model for simulating industrial nylon-6 production trains,Ind.Eng.Chem.Res.42(17)(2003)3900-3913.
[4]K.C.Seavey,Y.Liu,B.Lucas,N.P.Khare,T.Lee,J.Pettrey,T.N.Williams,J.Mattson,E.Schoenborn,C.Larkin,New mass-transfer model for simulating industrial nylon-6 production trains,Ind.Eng.Chem.Res.43(17)(2004)5063-5076.
[5]A.Gaglione,Multiscale Modeling of an Industrial Nylon-6 Leacher,Master Thesis,Virginia Polytechnic Institute and State University,America,2007.
[6]K.Seavey,Y.A.Liu,Step-growth polymerization process modeling and product design,John Wiley&Sons,England,2009.
[7]J.Erbes,A.Ludwig,G.Pipper,Continuous polyamide extraction process,China Pat.,1284095 A,2001.
[8]Y.Xing,Control strategy of cyclic dimer in nylon 6 manufacture process,Master Thesis,East China University of Science and Technology,China,2014.
[9]E.W.Washburn,Note on a Method of Determining the Distribution of Pore Sizes in a Porous Material,Cambridge University Press,England,1921.
[10]J.Crank,The Mathematics of Diffusion,Oxford University Press,England,1979.
[11]J.C.Urban,A.Gomezplata,Axial dispersion coefficients in packed beds at low reynolds numbers,Can.J.Chem.Eng.47(4)(2010)353-359.
[12]Yao,Principles of Chemical Engineering,second edition Tanjin University Press,Tianjin,1999.
[13]D.Van Krevelen,P.Hoftijzer,Studies of gas absorption.I.Liquid film resistance to gas absorption in scrubbers,Recueil des Travaux Chimiques des Pays-Bas66(1)(1947)49-65.
[14]P.J.A.M.Kerkhof,Countercurrent plug flow mass exchange with internal particle diffusion,Chem.Eng.Sci.62(7)(2007)2040-2067.
[15]Y.Fujiwara,S.H.Zeronian,Crystallization of cyclic oligomers on the surface of nylon 6 fibers,J.Appl.Polym.Sci.23(12)(2010)3601-3619.
[16]V.S.Moholkar,M.M.C.G.Warmoeskerken,Investigations in mass transfer enhancement in textiles with ultrasound,Chem.Eng.Sci.59(2)(2004)299-311.
[17]F.Veglio,M.Trifoni,F.Pagnanelli,L.Toro,Shrinking core model with variable activation energy:a kinetic model of manganiferous ore leaching with sulphuric acid and lactose,Hydrometallurgy60(2)(2001)167-179.
[18]B.Avvaru,S.Roy,S.Chowdhury,K.Hareendran,A.B.Pandit,Enhancement of the leaching rate of uranium in the presence of ultrasound,Ind.Eng.Chem.Res.45(22)(2006)7639-7648.
[19]Y.Arai,K.Tai,H.Teranishi,T.Tagawa,Kinetics of hydrolytic polymerization of ε-caprolactam:3.Formation of cyclic dimer,Polymer22(2)(1981)273-277.
[20]S.Negoro,T.Ohki,N.Shibata,K.Sasa,H.Hayashi,H.Nakano,K.Yasuhira,D.Kato,M.Takeo,Y.Higuchi,Nylon-oligomer degrading enzyme/substrate complex:catalytic mechanism of 6-aminohexanoate-dimer hydrolase,J.Mol.Biol.370(1)(2007)142.
[21]C.Wang,Process Simulation and Analysis of Nylon 6 Manufacture Process,East China University of Science and Technology,China,2015.
杂志排行

Chinese Journal of Chemical Engineering的其它文章
- Bioregeneration of spent activated carbon:Review of key factors and recent mathematical models of kinetics
- CFD simulations of quenching process for partial oxidation of methane:Comparison of jet-in-cross- flow and impinging flow configurations☆
- Quantifying growth and breakage of agglomerates in fluid-particle flow using discrete particle method☆
- Coupling simulation of fluid structure interaction in the stirred vessel with a pitched blade turbine☆
- An integrated model for predicting the flame propagation in crimped ribbon flame arresters☆
- Assessment of k-ε models using tetrahedral grids to describe the turbulent flow field of a PBT impeller and validation through the PIV technique