Modelling of heat transfer for progressive freeze concentration process by spiral finned crystallizer
2018-06-29ShafirahSamsuriNurulAiniAmranMazuraJusoh
Shafirah Samsuri,Nurul Aini Amran ,Mazura Jusoh *
1 Department of Chemical Engineering,Universiti Teknologi PETRONAS,32610 Seri Iskandar,Perak,Malaysia
2 Department of Chemical Engineering,Faculty of Chemical and Energy Engineering,Universiti Teknologi Malaysia,81310 UTM Skudai,Johor,Malaysia
1.Introduction
The Freeze concentration(FC)technology is grounded on the principle which states that water could be separated from a solution by freezing or cooling,and this process would for mice crystals and leave behind a concentrated liquid[1].FC aims to produce very pure ice crystal,containing only water and no solutes are retained in the ice crystal[2].Subsequently,the solid and liquid phases produced will be separated into ice and concentrated solution.This technique is known as a concentration method which can be used to prevent the loss of quality in liquid foods,including fruit juices and dairy products[3,4].
There are three categories of FC:progressive freeze concentration(PFC),block freeze concentration(BFC)and suspension freeze concentration(SFC)[5-8].SFC is deemed as the most traditional approach of FC where ice is formed in a chilled solution and it comprises of nucleation and crystal growth by using recrystallizer and a scraped-surface heat exchanger(SSHE)[9].In this light,the application of SSHE takes up to 30%of the investment costs for an FC plant,making it the costliest processing unit in the FC plant[10].The SSHE produces small ice crystal from the solution which is pumped from a feed tank.Then,the out flow of the SSHE,which contains small ice crystal will be fed to the recrystallizer and mixed with larger crystals.In this process,the Gibbs-Thomson effect(Ostwald ripening)leads to the growth of crystal in the recrystallizer[11].The resultant slurry flow will be transported to a separation device which will separate the concentrated liquid from the ice crystals[12].These phases of ice crystals separation and washing are crucial in SFC as the solute in the solution will adhere to the ice crystals and contaminate them.In this light,even though there is an indication of high SFC efficiency,the large surface area makes it hard for ice crystals to be separated from the concentrated liquid.Consequently,the SFC method requires a complex system,making it the costliest SFC method compared to other concentration methods[13].
In recent years,numerous FC developments have been linked to BFC and PFC due to its simple separation step[14].In BFC,a liquid solution is completely frozen,then the whole frozen solution is thawed to separate the concentrated fraction from the ice fraction by gravitational method.The process consists of freezing,thawing and separation[15].PFC is a form of FC that could continuously produce ice crystals by each layer on a cooled surface until a single,large block of ice crystal is formed.It is claimed that large ice single crystal contains smaller number of solutes and impurities[16-18].Thus,large ice crystal produced through PFC would have a higher level of purity compared to those produced from SFC.Moreover,having a single ice crystal would make it much easier for the ice crystal to be separated from the main solution,and consequently,ensure lower maintenance and operation costs.
On the other hand,although there are evidences that PFC can yield higher quality products compared to SFC,SFC is reported to have a higher level of productivity.Productivity is a measure of the efficiency of the FC system to produce ice crystal and it is calculated from the amount of the ice crystal produced by the system[19].Numerous studies have been done in order to improve the quantity of the product.At the same time,the system must be simple and easy to operate.The PFC system is recognized as a good opportunity if it can produce high quality and quantity of the product.
A different design of PFC system has been developed in this study.The design of the PFC system,which is a crystallizer with spiral fins as the leading part,provides high exchange surface area and optimum flow characteristic.The increase of the exchange surface area enhances the heat transfer between the solution and coolant.The ice crystal was formed on the inside surface of the crystallizer where it is being cooled by the coolant.The productivity can be improved with the increase of exchange surface area between the coolant and the solution through the heat transfer surface.By providing increased contact surface area by the addition of spiral fins,this crystallizer attempted to improve the concentration performance by increasing the heat transfer between solution and coolant.Although the theory and practice of fin has been widely studied by many researchers for different applications of heat exchangers,the efficiency of fin in a crystallizer has not been studied.Therefore,the aim was to predict the amount of ice crystals produced from spiral finned crystallizer with respect to the coolant temperature applied.
2.Materials and Methods
2.1.Experimental setup
Fig.1 presents the experimental setup and major apparatus used in study,including the data acquisition unit and temperature profiling.Here,a silicon tube was used to attach the crystallizer to a peristaltic pump(757300-55,Master flex,United States)which allows the solution to flow into the crystallizer from the feed for a specific time period.The circulation flow rate of the solution was controlled by the pump.The peristaltic pump was chosen for the system as only the tubing of the peristaltic pump comes in contact with the solution.This can keep the solution and the pump sterile and contamination can be prevented.Furthermore,it is relatively easy to clean the pump's surface,making it advantageous over other systems.The heat generated from the pump is also at the minimum level,and this will avoid the reduction of the cooling effect during the process of freezing.
A data acquisition tool,PicoLog(PicoLog USB TC-08,United Kingdom)was used.Here,temperature of solution inlet and outlet in the crystallizer and temperature of coolant inlet and outlet in the cooling jacket,and thermocouple probes(type K,Malaysia)used to measure the temperatures were attached to the tool.In the meantime,a Scientz water bath(DC-2030,Ningbo,China)was used to control the coolant temperature with temperature stability of±0.05 °C.
2.2.Materials
For this study,distilled water had been used to prepare a solution of glucose(QRec,Selangor,Malaysia)with the concentration of 0.1 g·ml-1,and the coolant used was the 50%(v/v)ethylene glycol solution(QRec,Selangor,Malaysia).The chemicals were purchased from Ichem Solution Sdn.Bhd.and Kras Instrument and Service,Malaysia.
2.3.Spiral finned crystallizer
This study presents a crystallization technology with the design of a different PFC.This novel PFC system is unique due to the inclusion of the spiral fin,which is included to overcome the problem regarding low productivity.The presence of the fin will increase the surface area[20],and the extension of the surface will enhance the performance of the heat transfer.Furthermore,the increase in the surface area for the transfer of heat will decrease resistance.
Generally,a crystallizer is cylindrical.The crystallizer in this study is af fixed with hollow rectangular shaped fins,which are located in a spiral form at the crystallizer inner wall.To increase the heat transfer between the coolant and the solution,the spiral fin shape was designed in vertical circulation.The enhancement of the flow of the solution will subsequently improve the heat transfer.Fig.2 illustrates the schematic diagram of the spiral finned crystallizer designed in this study.A study by Samsuriet al.[21]had explained the details regarding the spiral finned crystallizer.
2.4.Experimental procedure
Glucose was prepared according to the desired concentration,which is 0.1 g·ml-1.To calibrate the initial concentration,a few drops of glucose were taken and measured using refractometer(MA871,Romania,Europe).Two portions of glucose solution were prepared.The first portion was cooled in the refrigerator where it was cooled to a temperature close to the freezing point of water.The temperature of the refrigerator was set to be 2°C.Another portion of glucose solution was frozen into a solid form where it was placed in the refrigerator a day before the experiment.The waterbath was then turned on and the temperature was set.The temperature range for the whole experiment is between-8 and-16°C.The waterbath takes less than 1 h to reach the set temperature.

Fig.1.Experimental set-up of the PFC process.

Fig.2.Schematic diagram of spiral finned crystallizer.
Before starting the ice crystallization process,the coolant was filled in the cooling jacket once the temperature of coolant has reached the desired temperature.Both the solidified and cooled glucose solutions were mixed in the feed tank.Then,the glucose solution was pumped to the crystallizer by the peristaltic pump through the silicone tube.At the same time,shaker was turned on to shake the crystallizer.The solution was flowed in an ascending flow through the spiral fin and was collected in the feed tank,from which the cycle starts again.The flowrate was maintained at3400 ml·min-1.When the glucose solution has filled the entire tubing and the crystallizer,the feed tank valve was closed.As the solution was circulated in the crystallizer,ice was formed in layers on the inner cooled surface of the crystallizer leaving behind a more concentrated solution.
During each run,the temperature of wall,temperature of solution inlet and outlet of the crystallizer and temperature of coolant inlet and outlet of the cooling jacket were measured by six type Kthermocouples.The temperature measured was displayed on a computer connected to the PicoLog.At the designated time which is 70 min,circulation was stopped.The concentrated glucose was drained outfrom the crystallizer and the volume of the concentrated glucose was measured.Ice crystal was then detached from the cooling surface of the crystallizer and left at room temperature to melt.Samples from the ice crystal and concentrated glucose were placed on the refractometer with a precision of±0.002 g·ml-1to measure its refractive index(RI).Measurements were performed in triplicate.
3.Heat Transfer Model Development
Fig.3 shows a schematic diagram of a PFC heat transfer surface.During the flow of the solution from feed to outlet,there is a phase change and the latent heat of phase change is released.Several simplifying assumptions concerning the nature of the process have been adopted in the present modeling.
(1)The flow of solution is laminar.
(2)All the heat transferred to or from ice is utilized towards melting or freezing the ice.
(3)Ice crystal adhered on heat transfer surface offers resistance,but no thermal capacity.
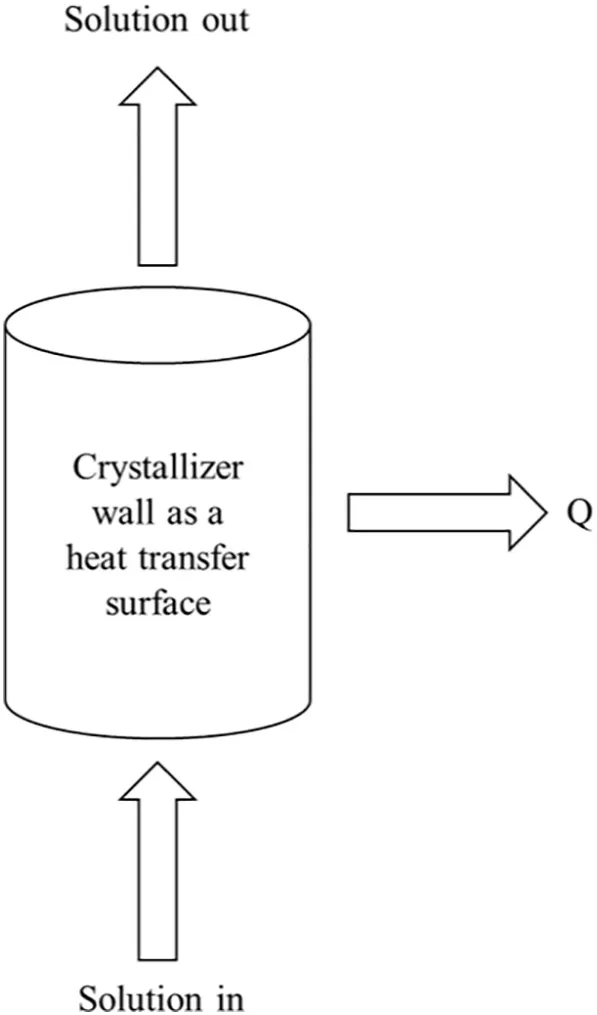
Fig.3.Progressive freeze concentration heat transfer surface.
(4)For the purpose of determining ice crystal mass,thickness of ice crystal is assumed to be uniform along the heat transfer surface.
(5)Physical properties of the glucose solution such as density,specific heat capacity and viscosity do not change during the ice formation.
(6)Temperature gradient across the heat transfer surface is assumed to be linear.
(7)Supercooling of the glucose solution is neglected.
(8)Thermal property variation of the heat transfer surface material due to temperature change is negligible.
(9)Density,specific heat capacity,viscosity and thermal conductivity of coolant are calculated at different temperature.
(10)Negligible loss of heat to the surrounding.
(11)Glucose solution is fully circulated and all solutes are rejected into the concentrated solution.
The basic equation of heat transfer was modified based on the aforementioned assumptions.Fig.4 illustrates the proposed heat transfer activities for PFC process in the spiral finned crystallizer.

Fig.4.Schematic diagram of heat transfer activities on the cooled surface of the spiral finned crystallizer.
3.1.Model formulation
The wall temperature(Tw)of the spiral finned crystallizer was decreased to cool down the glucose solution.Twwas cooled down using the controlled coolant temperature(Tc)which solidified the water component.During the PFC process,the temperature of the glucose solution(Ts)decreased from the centre of the spiral finned crystallizer to the ice liquid interface.However,in order to complete the calculation,for this heat transfer model,it is assumed thatTsis constant at 2°C.During dttime,the layer of the ice crystal grown to the mass of(dm),inside the crystallizer wall.Eq.(1)expresses the analysis of heat transfer rate for the(dm)of ice crystal layer.

whereq1reflects the heat energy flowing from the ice-liquid interface into the coolant(W),through the crystallizer wall,q2is reflects the heat energy released from the glucose solution cooling(W),ΔHrepresents the latent heat of fusion(J·kg-1)and dm/dtrepresents mass per unit time of ice crystal formed(kg·s-1).
Whenq1=UoΔTandq2= ΔT/R,it can be illustrated that:

Uorepresents the overall heat transfer coefficient(W·m-2·°C-1),ΔTis the temperature difference(°C)andRis the resistance(m2·°C·W-1).
Eq.(2)can be further extended to be:

whereTmreflects the temperature during the ice-liquid interface(°C),Tcrepresents the temperature of the coolant(°C),Tsreflects the temperature of the solution(°C),xiis the of ice crystal thickness(m),xwis the crystallizer wall thickness(m),Aorepresents the outside surface area(m2),Aiis the inside surface area(m2),Amis the logarithmic mean area(m2),kiis the ice thermal conductivity(W·m-1·°C-1),kwis the stainless steel thermal conductivity(W·m-1·°C-1),hcis the coolant convective heat transfer coefficient(W·m-2·°C-1)andhsis the glucose solution convective heat transfer coefficient(W·m-2·°C-1).
This study assumes thatTwequals the average temperature betweenTcandTssince these temperatures gave the most significant effect toTwas compared to other temperatures.It is also assumed that ice-liquid interface temperature(Tm)is similar to the water melting temperature(0°C).This value was chosen based on assumption that ice crystal formed was composed of pure water.The equation obtained is as follows:

An ice thickness versus coolant temperature graph was plotted to facilitate the calculation of the ice thickness(xi),as shown in Fig.5.Ice thickness should be considered in developing the model since it can limit the heat flow[22].
Based on the graph,a new equation representing a plotted line was generated.The equation was inserted into the Eq.(5)which expresses:

The solution and the coolant heat transfer coefficient(h)were under the forced flow condition in the system as the solution and the coolant flows were circulated using pum-ps.Reynolds number for the flow rate of 3400 ml·min-1is 999.01 where it is less than 2100,signifying laminar flow.Thus,for the laminar flow,the equation for h is expressed in Eq.(6)as shown[23]:
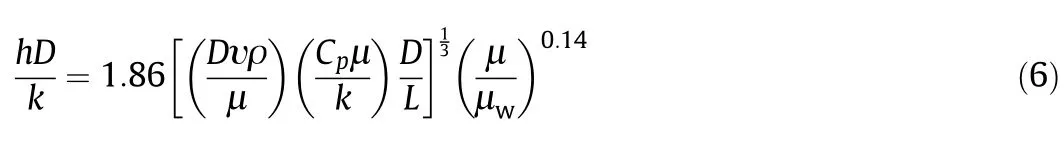
whereDis the diameter of vessel containing the flowing glucose solution(m),υ is the glucose solution velocity(m·s-1),ρ is the glucose solution density(kg·m-3),Cpis the specific heat of the glucose solution(J·kg-1·K-1),Lis the length of vessel(m),μ is the glucose solution viscosity at bulk temperature(Pa·s)and μwis the glucose solution viscosity at wall temperature(Pa·s).
This model equation forecasts the mass of the ice crystal mass in regard to different coolant temperature(Tc).It is important to forecast the formation of the ice crystal in the PFC system.In this light,the coolant temperature is one of the significant aspects in the PFC process as it influences the formation of the ice crystal.Ice crystal formation is a crucial process in PFC as the ice crystal contains higher number of water molecules which allow the more comprehensive separation of the solute as the water forms into the ice crystal.For any sample to be concentrated by this PFC system,it is such an assistance if the mass of ice crystal that could potentially be produced by the system at certain coolant temperature could be predicted.Thus,the experiments were conducted with the coolant at the temperature of-8,-10,-12,-14 and-16°C.
3.2.Statistical analysis
Statistical analysis of data was performed through analysis of variance(ANOVA)using STATISTICA software Version 8.0 Statsoft Inc.,USA.Analysis of Variance(ANOVA)were carried out to detect any significant differences of error(p<0.05).The correlation coefficient(R2)was used to check the accuracy for the curves.
4.Error Analysis
Fig.6 and Table 1 present the comparison between the mass ice crystal calculated based on the model,and from the experimental runs.As shown in Fig.6,as anticipated,the mass of the ice crystal increased as the coolant temperature decreased from-8 to-16°C.This clearly indicates that the model equation provides a good forecast of the range of coolant temperature that could be used(p<0.05).For both the model and the experimental values,theR2were at1.0 and 0.9611,respectively,which is profoundly acceptable in the development of the model.
Another method that can be used to determine the deviation between the model prediction and the experimental values is the calculation of the error through the values of Average Absolute Relative Deviation(AARD)[24].Eq.(7)expresses the standard equation for the calculation of AARD.Table 1 presents the corresponding values related to the AARD calculation.

Fig.6.Comparison between model and experimental values for ice crystal mass.

Table 1 Comparison of data for ice crystal mass,m ice from model and experiments
whereNis the number of data,yexpis the experimental value andymodis the proposed model value.
The AARD can be calculated by using the values from Table 1,as shown:

The findings show that the heat transfer model is parallel to the experimental results,with the AARD of 10.72%.According to a laboratory scale,the data are deemed as highly consistent when the AARD is equal or similar to 5%and the AARD lower than 10%shows that the data are deemed as consistent.Consequently,data with AARD higher than 10%could be deemed as inconsistent[25].However,the error obtained still can demonstrate that the developed heat transfer model is acceptable to be employed in the prediction of ice crystal mass.
5.Conclusions
This study has successfully presented an ice crystal mass prediction model based on heat transfer principles through the heat balance performed in the PFC system and suitable errors analyses were also conducted.Based on the mathematical demonstration and experiment validation conducted,the study can justify that in regard to the glucose solution PFC process,ice crystal formation,in regard to mass is the function of the coolant temperature.The study found that theR2for both model and experimental data were 1.0 and 0.9611,respectively and value obtained from the AARD analysis was 10.72%.This illustrates that the derived model has a good consistency.In conclusion,the model presented could be an effective tool for predicting ice crystal mass in regard to the coolant temperature in a PFC system.
Acknowledgements
The authors would like send our gratitude to Universiti Teknologi Malaysia and Ministry of Education Malaysia(MOE)for providing the financial support through Research University Grant and Fundamental Research Grant Scheme(Vot nos.04H46 and 4F224)and Chemical Engineering Department,Universiti Teknologi PETRONAS for its support.
[1]A.Balde,M.Aider,Impact of cryoconcentration on casein micelle size distribution,micelles inter-distance,and flow behavior of skim milk during refrigerated storage,Innovative Food Sci.Emerg.Technol.34(2016)68-76.
[2]E.Hernández,M.Raventós,J.M.Auleda,et al.,Freeze concentration of must in a pilot plant falling film cryoconcentrator,Innovative Food Sci.Emerg.Technol.11(1)(2010)130-136.
[3]A.Chabarov,M.Aider,Mathematical modeling and experimental validation of the mass transfer during unidirectional progressive cryoconcentration of skim milk,Innovative Food Sci.Emerg.Technol.21(2014)151-159.
[4]O.L.A.Flesland,Freeze Concentratton by layer crystallization,Dry.Technol.13(8-9)(1995)1713-1739.
[5]O.Miyawaki,L.Liu,Y.Shirai,et al.,Tubular ice system for scale-up of progressive freeze-concentration,J.Food Eng.69(1)(2005)107-113.
[6]K.Kawasaki,A.Matsuda,H.Kadota,Freeze concentration of equal molarity solutions with ultrasonic irradiation under constant freezing rate:Effect of solute,Chem.Eng.Res.Des.84(2)(2006)107-112.
[7]M.Aider,D.de Halleux,Cryoconcentration technology in the bio-food industry:Principles and applications,LWT Food Sci.Technol.42(3)(2009)679-685.
[8]G.Petzold,P.Orellana,J.Moreno,et al.,Vacuum-assisted block freeze concentration applied to wine,Innovative Food Sci.Emerg.Technol.36(2016)330-335.
[9]L.Otero,P.Sanz,B.Guignon,et al.,Pressure-shift nucleation:A potential tool for freeze concentration of fluid foods,Innovative Food Sci.Emerg.Technol.13(2012)86-99.
[10]B.Habib,M.Farid,Heat transfer and operating conditions for freeze concentration in a liquid-solid fluidized bed heat exchanger,Chem.Eng.Process.Process Intensif.45(8)(2006)698-710.
[11]O.Miyawaki,M.Gunathilake,C.Omote,et al.,Progressive freeze-concentration of apple juice and its application to produce a new type apple wine,J.Food Eng.171(2016)153-158.
[12]O.Lorain,P.Thiebaud,E.Badorc,et al.,Potential of freezing in wastewater treatment:Soluble pollutant applications,Water Res.35(2)(2001)541-547.
[13]F.L.Moreno,C.M.Robles,Z.Sarmiento,et al.,Effect of separation and thawing mode on block freeze-concentration of coffee brews,Food Bioprod.Process.91(4)(2013)396-402.
[14]F.L.Moreno,M.X.Quintanilla-Carvajal,L.I.Sotelo,et al.,Volatile compounds,sensory quality and ice morphology in falling- film and block freeze concentration of coffee extract,J.Food Eng.166(2015)64-71.
[15]P.Orellana-Palma,G.Petzold,L.Pierre,et al.,Protection of polyphenols in blueberry juice by vacuum-assisted block freeze concentration,Food Chem.Toxicol.109(2017)1093-1102.
[16]P.Widehem,N.Cochet,Pseudomonas syringae as an ice nucleator—application to freeze-concentration,Process Biochem.39(4)(2003)405-410.
[17]Y.Shirai,T.Sugimoto,M.Hashimoto,et al.,Mechanism of ice growth in a batch crystallizer with an external cooler for freeze concentration,Agric.Biol.Chem.51(9)(1987)2359-2366.
[18]A.Kobayashi,Y.Shirai,K.Nakanishi,et al.,A method for making large agglomerated ice crystals for freeze concentration,J.Food Eng.27(1)(1996)1-15.
[19]S.Samsuri,N.A.Amran,N.Yahya,et al.,Review on progressive freeze concentration designs,Chem.Eng.Commun.203(3)(2016)345-363.
[20]H.J.Lane,P.J.Heggs,Extended surface heat transfer—the dovetail fin,Appl.Therm.Eng.25(16)(2005)2555-2565.
[21]S.Samsuri,N.A.Amran,M.Jusoh,Spiral finned crystallizer for progressive freeze concentration process,Chem.Eng.Res.Des.104(2015)280-286.
[22]J.M.Auleda,M.Raventós,E.Hernández,Calculation method for designing a multiplate freeze-concentrator for concentration of fruit juices,J.Food Eng.107(1)(2011)27-35.
[23]C.J.Geankoplis,Transport Processes and Separation Process Principles(Includes Unit Operations),Prentice Hall,Upper Saddle River,New Jersey,2003.
[24]H.Ghassabzadeh,J.T.Darian,P.Zaheri,Experimental study and kinetic modeling of kerosene thermal cracking,J.Anal.Appl.Pyrolysis86(1)(2009)221-232.
[25]S.Lucas,M.P.Calvo,C.Palencia,et al.,Mathematical model of supercritical CO2adsorption on activated carbon:Effect of operating conditions and adsorption scaleup,J.Supercrit.Fluids32(1-3)(2004)193-201.
杂志排行

Chinese Journal of Chemical Engineering的其它文章
- Bioregeneration of spent activated carbon:Review of key factors and recent mathematical models of kinetics
- CFD simulations of quenching process for partial oxidation of methane:Comparison of jet-in-cross- flow and impinging flow configurations☆
- Quantifying growth and breakage of agglomerates in fluid-particle flow using discrete particle method☆
- Coupling simulation of fluid structure interaction in the stirred vessel with a pitched blade turbine☆
- An integrated model for predicting the flame propagation in crimped ribbon flame arresters☆
- Assessment of k-ε models using tetrahedral grids to describe the turbulent flow field of a PBT impeller and validation through the PIV technique