Separation and identification of Fischer-Tropsch wax by high temperature gas chromatography-mass spectrometry
2018-04-02GAIQingqingLIUCongyunZHAOShuaiDONGHaifengZHAOXinying00900094
GAI Qingqing, LIU Congyun, ZHAO Shuai, DONG Haifeng, ZHAO Xinying*(. --- , 009, ; . , 00094, )
The growing demand for clean liquid fuels coupled with the increase in the identification of natural gas reserves has triggered an international effort to develop methods for production and commercialization of these energy resources. The conversion of natural gas to liquid hydrocarbon products is an attractive process for the monetization of natural gas. One of the important coal-to-liquid technologies is the Fischer-Tropsch (FT) synthesis, in which syngas (CO+H2) is used as a raw material to produce hydrocarbons and other chemicals [1-5]. The FT products are typically separated into wax (in hot traps), the oil phase, water phase products (in cold traps) and tail gas [6]. The analysis of FT products is essential for product quality control, catalyst screening, kinetic studies and engineering design. In recent years, there have been some reports on the detailed composition of FT oil and water phase products. A previous study [6] identified 63 components from developed FT cold trap oils using a two-step pretreatment method with column liquid chromatography. Our previous work [7,8] identified 20n-alcohols in oil products and 30 C1-C8alcohols, aldehydes and ketones in aqueous products of FT synthesis by gas chromatography (GC).
FT wax from hot traps is one of the main products of a FT synthesis reaction, and it is also an important raw material for hydrofining and the production of high quality diesel and lube base oils. However, there are few studies [9-13] that have determined FT composition, which has resulted in little available information. One study [9] attempted to elute linear (normal) alkanes from FT wax up tonC68(641 ℃) by high temperature (HT) GC×GC analysis using a CO2cryogenic modulator. Another study [10] determined the distribution of carbon numbers in FT wax by GC and calculated a chain growth probability of 0.928. But this study provided no detailed information about the exact components of FT wax.
FT wax is mainly composed of long-chain alkanes (between C5and C100), which have high boiling points and low solubility at room temperature. It is difficult to separate and determine FT wax, since the resulting data on the carbon number distribution (as a reference) are often not precise enough. Unfortunately, there is no simple and convenient method for the accurate analysis of FT wax. Hence, the purpose of this study was to further optimize the chromatographic conditions, building on our previous work and the existing literature [9,10], to elute the heavier groups and completely separate each component of FT wax. By using this improved method, qualitative and quantitative analysis of FT wax has been achieved.
1 Experimental
1.1 Materials
The FT wax was provided by Shenhua Ningmei Chemical Co., Ltd (China), and used to evaluate the elution properties of the chromatographic system. A standard wax sample consisting ofn-alkanes from C5to C100was purchased from SINOPEC Research Institute of Petroleum Processing (China). To identify components by HTGC-mass spectrometry (MS), the FT wax fraction (initial boiling point (IBP)-450 ℃) was cut by true boiling point distillation. Analytical grade CS2was provided by Sinopharm Group Chemical Reagent Co., Ltd (China). Helium (99.999%) and zero air were provided by Air Products (China). Hydrogen (99.999%) was produced by a hydrogen generator (Peaker, Scotland). All of the other chemicals used were analytical grade.
1.2 Sample pretreatment
Before analysis, FT wax samples were dissolved in CS2to a mass percentage of 3%-5%. To ensure that the high boiling point components were completely dissolved, the wax samples were heated until clear and transparent before injection. The injection needle was preheated by washing with hot solvent simultaneously; this eliminated the impact of residual samples.
1.3 HTGC and HTGC-MS operating conditions
HTGC was carried out using an Agilent 7890 GC (Agilent Technologies) equipped with cool-on-column inlet (0.5 μL auto injection;+3 ℃ track oven mode), a high temperature flame ionization detector (FID) jet (430 ℃), Agilent VF-5HT Ultimetal column (30 m×0.32 mm×0.1 μm) with constant flow mode, and helium carrier gas at 1.5 mL/min. The oven was programmed to rise from 50 ℃ to 410 ℃ at 9 ℃/min with a 15-min hold. The injection volume was 0.2 μL.
HTGC-MS was carried out with an Agilent 7890 GC coupled to an Agilent 5975C MS (set up similar to the HTGC-FID) fitted with cool-on-column inlet (0.5 μL auto injection;+3 ℃ track oven mode) and Agilent HTDB-5 column (30 m×0.32 mm×0.1 μm). The general operating conditions were helium carrier gas in constant flow mode (1.3 mL/min), oven programmed to rise from 50 ℃ to 380 ℃ at 3 ℃/min with a 5-min hold, the transfer line and ion source at 300 ℃ and the MS in electron ionization mode (70 eV), recording the mass to charge range (m/z) 50-1 050.
2 Results and discussion
2.1 Optimization of chromatographic conditions
The current laboratory procedures for FT wax analysis have shown that the FT wax composition is complex and contains components other thann-alkanes. Under existing experimental conditions, various types of carrier gases and the influence of the chromatographic column were investigated to improve the separation efficiency of the FT wax.
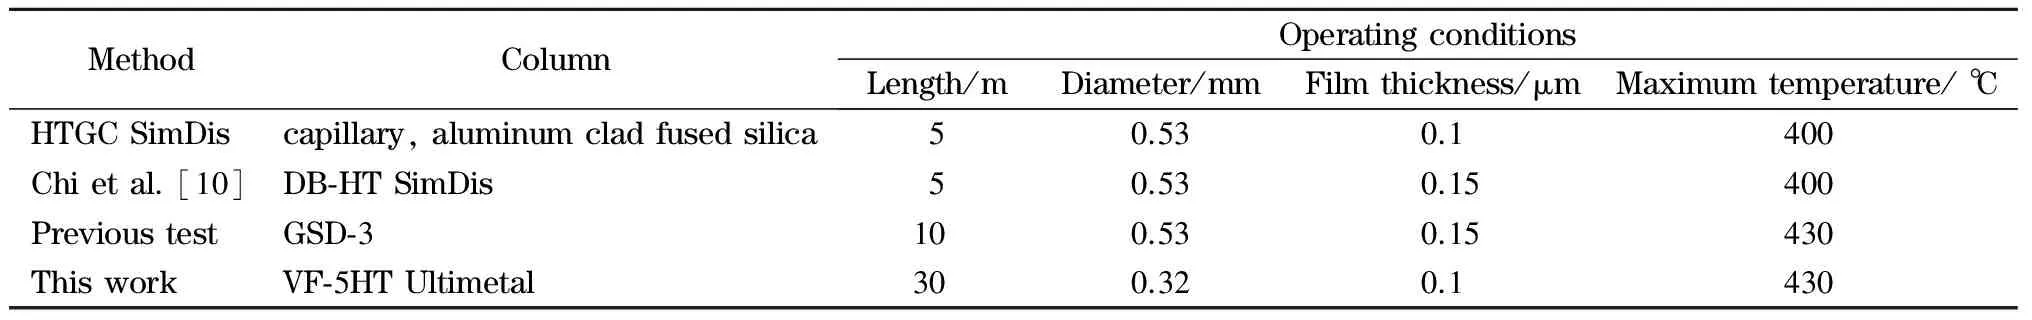
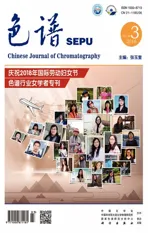
Table 1 Operating conditions obtained from the literature and optimized in this study
2.1.1Selection of carrier gas
In this study, to investigate the composition and content of FT wax samples, the effects of helium and nitrogen as a carrier gas on the separation of FT wax were investigated. The selection of the carrier gas took into account its effect on column efficiency, the requirements of the detector and the nature of carrier gas itself. Nitrogen and helium are commonly used as carrier gases for FID. Nitrogen is most commonly used because of its cheap cost; it is also used in routine analysis of FT wax distillation range determination in our laboratory.
The experimental results showed that with the use of helium as the carrier gas (while keeping other conditions constant), each chromatographic peak was sharper, the width of the peaks decreased and the column efficiency was obviously improved compared with using nitrogen. It is possible that mass transfer resistance plays a major role in the separation of wax samples under the current chromatographic separation parameters. Carrier gases with smaller molecular weights can reduce mass transfer resistance and improve column efficiency. Thus, helium was determined to be a more suitable carrier gas for complex wax sample separation.
2.1.2Selection of chromatographic column
The FT wax is mainly composed of long-chain alkanes (C5to C100) with high boiling points up to 720 ℃. It is therefore necessary to use high temperature conditions to analyze high boiling point compounds by GC, and it is critical to ensure minimal loss of elution and desired high separation efficiency at high temperatures. Thus, the choice of the chromatographic column is especially important.
HTGC SimDis (ASTM D6352) [14] is a high temperature technique that enables the elution of compounds in their boiling point range for determining the distillation distribution from 174 ℃ to 700 ℃ (boiling point of linear alkanes C10to C90). A wide-bore non-polar column (DB-HT SimDis, 0.53 to 0.75 mm internal diameter) with a thin film of stationary phase (0.10 to 0.20 μm) was used to elute high molecular weight compounds. However, it has poor separation efficiency and the FT wax was not separated. The corresponding operating conditions are detailed in Table 1.
The DB-HT SimDis column has been used to determine the carbon number distribution of FT wax samples [10], but only for then-alkanes; it was unsuitable for other constituents. The GSD-3 column was used in previous test, but it was very difficult to completely separaten-alkanes from other components. In this study, a more suitable high temperature chromatographic column was chosen to elute heavy compounds in the FT wax sample. A capillary column with a thinner stationary phase can elute low volatility compounds because of its reduced column bleeding [9]; thus, a column with 0.1 μm-thick stationary phase was used to elute heavier compounds. However, it is important to note that longer columns with smaller diameters can also improve separation efficiency.

Fig. 1 Chromatogram from HTGC of the FT wax sample in previous test a=peak area obtained by tangent integration, a+b=peak area obtained by vertical integration.
Figs. 1 and 2 show the FT wax chromatograms obtained with different methods. There was an obvious fluctuating baseline in Fig 1, but this has been corrected and there is now a smooth and steady baseline (Fig. 2). This indicates that improved peak shape and baseline separation was achieved in this study compared with our previous work and what was found in literature [10]. Figs. 1 and 2 also show that the heaviestn-alkanes measured from the same FT wax were C80and C93from previous studies and this improved method, respectively. Furthermore, the improved method can elute heavier compounds and separate previously single chromatographic peaks (Fig. 1) into several peaks (Fig. 2). In other words, the improved method demonstrates better performance in the analysis of heavy compounds. Thus, the VF-5HT Ultimetal was selected as the column for our chromatographic system.
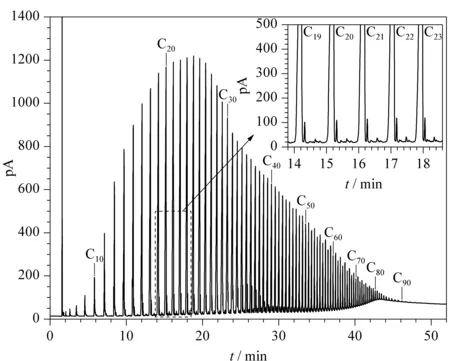
Fig. 2 Chromatogram of the FT wax sample by improved HTGC
2.2 Determination of the FT wax carbon number distribution
Referring to the chromatogram of the standard wax sample (C5-C100), the qualitative analysis ofn-alkanes in FT wax was determined using different methods (Figs. 1 and 2). Taking into account the similarities between the correction factors of hydrocarbons from the FID, the area normalization method was used for quantitative analysis. The chromatogram of FT wax in Fig. 1 has obvious baseline fluctuation, which is mainly due to separation difficulties between the mainn-alkanes and other components with similar boiling points. In our previous test, the FT wax carbon number distribution was calculated by the vertical and tangent integration method (Fig. 1). The content ofn-alkanes was related to the peak area obtained by tangent integration, and the content of non-alkanes was related to the peak area difference between vertical and tangent integration. Therefore, the content ofn-alkanes and non-alkanes was calculated as 55.45% and 44.55%, respectively (Table 2), which is inconsistent with the theoretical predicted value ofn-alkanes (~90%) from FT reaction product rules [15]. The FT wax carbon number distribution is shown in Fig. 3a.
Table 2 Comparison of the total content of n-alkanes and non-alkanes in FT wax

Fig. 3 Comparison of composition and content by (a) the previous test and (b) the improved HTGC
In Fig. 2, the area normalization method by tangent integration was directly used for the quantitative analysis of FT wax because of the steady chromatogram baseline and good separation. Then-alkanes in each cluster of chromatographic peaks were distinguished through comparison with the retention time of the standard wax sample (C5-C100). The other chromatographic peaks that only appeared after we used the improved method were believed to be non-alkanes. The FT wax carbon distribution determined by the improved method is shown in Fig. 3b; it shows a normal distribution. The content ofn-alkanes and non-alkanes calculated from the experiment using the improved method were 96.63% and 3.37%, respectively (Table 2), consistent with theoretical prediction values. In addition, the improved method can successfully elute the heavier compounds (up tonC93) from FT wax, andn-alkanes were separated from other unknown compositions, which demonstrates improved results from the previous maximum elution ofnC68[9].
2.3 Analysis of FT wax fraction (IBP-450 ℃)
Some small peaks around eachn-alkane were found after the improved HTGC method (Fig. 2), which were thought to be branched alkanes in the FT wax. While there were reports [9] that branched alkanes and alcohols were found in FT wax, this had not been confirmed. We analyzed the unknown components of the FT wax fraction (IBP-450 ℃) by true boiling point distillation and they were identified by HTGC-MS; care was taken to avoid pollution from the ion source.

Fig. 4 Partial total ion chromatogram of FT wax fraction (IBP-450 ℃) from HTGC-MS Peaks: 1. 7-tetradecene; 2. 1-tetradecene; 3. 3-tetradecene; 4. tetradecane; 5. 2-tetradecene; 6. methyl-6,8-dodecadienyl ether.
The partial chromatogram of FT fraction is shown in Fig. 4. From comparison to standard libraries, the compounds in each cluster were found to contain alkanes, alkenes and oxygenated compounds. Fig. 4 also shows that there are alkanes, alkenes and esters in a cluster of peaks containing tetradecane. Compounds in FT wax with low carbon numbers (low boiling points) were composed ofn-alkanes, various alkenes and a few oxygenated compounds. Thus, we predict that with increasing FT wax compound carbon numbers, alkane content will increase gradually, alkene content decreases and the other oxygenated compounds are able to be detected. This part of our work is still in progress.
3 Conclusions
In this study, the separation and analysis of FT wax was investigated by an improved HTGC method. The improved HTGC method was adapted to elute higher carbon number components, up to C93with good separation efficiency, and to separaten-alkanes from other components with similar thermal properties. Our results showed that the contents ofn-alkanes and non-alkanes were accurately calculated through integrating the peaks in the chromatograms, and were consistent with theoretical prediction values; the elutedn-alkanes also showed a normal distribution for their carbon numbers.
This represents a great breakthrough in the detailed analysis of FT wax components. The analysis of FT wax fractions (IBP-450 ℃) using HTGC-MS confirmed that there were alkenes and oxygenated compounds in addition ton-alkanes in each cluster of the chromatograms. However, because of the high boiling point of FT wax, there are still further issues for investigation, such as the qualitative analysis of the FT wax fraction (>450 ℃).
Overall, the method has achieved satisfactory results for the determination of FT wax from Ningxia 4 million tons per year indirect coal liquefaction. Based on this method, the group has applied to the National Energy Bureau for industry standards.
Acknowledgement
We are grateful to Chi Langzhu for help on the separation of FT wax. We thank Kara Bogus, PhD, from Liwen Bianji, Edanz Editing China (www.liwenbianji.cn/ac), for editing the English text of a draft of this manuscript.
[1]Gao R, Cao D B, Liu S L, et al. Appl Catal A: General, 2013, 468: 370
[2]Xiong H F, Motchelaho M A, Moyo M, et al. Fuel, 2015, 150: 687
[3]Hamilton N G, Warringham R, Silverwood I P, et al. J Catal, 2014, 312: 221
[4]Li T Z, Wang H L, Yang Y, et al. Fuel Process Tech, 2014, 118: 117
[5]Rina W, Hein P, Nico P, et al. J Chromatogr A, 2011, 1218: 3173
[6]Fan G X, Li Y, Yang J L, et al. Chinese Journal of Analytical Chemistry, 2007, 35(8): 1092
[7]Gai Q Q, Wu P, Shi Y L, et al. Chinese Journal of Chromatography, 2015, 33(1): 90
[8]Gai Q Q, Long Y H, Wu P, et al. Analytical Instrumentation, 2016, 4: 9
[9]Mahéa L, Courtiadea M, Dartiguelonguea C, et al. J Chromatogr A, 2012, 1229: 298
[10]Chi L Z, Li Z Y, Jiang Y, et al. China Petroleum Processing Petrochem, 2016, 7(1): 101
[11]Sutton P A, Wilde M J, Martin S J, et al. J Chromatogr A, 2013, 1297: 236
[12]Zhou Y Q. Chinese Journal of Chromatography, 1996, 14(5): 403
[13]Yang R Y, Zhou L P, Gao J H, et al. Catal Today, 2017, 298: 77
[14]ASTM D6352-2015
[15]Dry M E. Appl Catal A: General, 1999, 189: 185