Effect of Pressure on Cesium Iodide Band Gap
2018-03-29CEDILLOAndrés,CORTONAPietro
1 Introduction
Cesium iodide is an ionic solid with simple cubic crystal structure (B2 or CsCl-type) at room pressure and temperature;under these conditions, it is an insulator. This material attracted attention in the last decades when it was found that the isoelectronic solid xenon presents conducting features at high pressures1,2.
Earlier experimental studies on cesium iodide showed that the B2 structure suffers a distortion under pressure and the band gap lowers3–14. The structural phase transition from the B2 structure to a non-cubic one does not have a significant change in the volume and the order of the phase transition was under controversy. The high-pressure phase was initially assumed to be a tetragonal body-centered cell. The first theoretical studies showed that a tetragonal distortion on the B2 structure became stable at high pressures15–18,12,19–21. A more precise X-ray diffraction study apparently finished with the controversy. Mao et al.22proposed a pressure-induced continuous transformation from the B2 structure to a hexagonal close pack one (hcp) by an orthorhombic Pmm2 cell. Later, the symmetry of the unit cell was corrected to Pmma by Winkler et al.23. By the use of evolutionary codes, it was shown that the Pmm2 structure is stable in a very small range of pressures (from 39 to 42 GPa)and it subsequently transforms into another orthorhombic cell with symmetry Pnma24. The second phase transition is first order, however the change in the volume is minimal.Additionally, electric resistivity measurements at high pressures were also performed and they showed that the resistivity decreases as pressure grows up, with a small discontinuity around 45 GPa25,26. The variation of the CsI electronic properties with the pressure influences the use of this material as a photoelectrode27,28.
Density functional theory (DFT) accurately predicts structural and energetic properties of molecular species and periodic solids. However, when the calculations are performed by the local density approximation (LDA) or using functionals belonging to the generalized-gradient approximation (GGA)class, the band gap of solids is usually underestimated. The accuracy of DFT in the prediction of the fundamental and the band gap has been analyzed in the literature29–31. The electronic band gap is an important property of periodic solids since it determines the electric conductivity. Traditionally,materials are classified as conductors, semiconductors and insulators by the size of the band gap. Besides the accuracy of the DFT estimated band gap, this estimation provides an insight about the electric properties of a crystalline solid.
In this work we use DFT-based electronic structure methods to analyze the phase stability of cesium iodide and the evolution of the band gap in the range of pressures from 0 to 60 GPa, at zero temperature. Static cell estimations are reported and the zero point energy is not included in this study. The corresponding results are compared with the evolution of the resistivity along the compression.
2 Methodology
All the electronic structure computations have been done with the ABINIT code32,33within the PAW formalism34,35and using an energy cutoff of 30 hartree. The Brillouin zones were sampled by Monkhorst-Pack grids, which were shifted using the default shift option in the ABINIT code for all the phase stability analysis. For the B1 structure, the four shifts suggested on the ABINIT website were used. A 6 × 6 × 6 grid was used for B1 and B2 structures, where the primitive cell contains one unit formula; for the Pmma cell we used the 4 × 6 × 4 grid with two formula units; the Pnma cell contains four formula units and the grid 4 × 4 × 4 was selected. The structure optimization was completed when the forces on all the atoms became smaller than 5 × 10⁻⁶hartree·bohr−1. For the evaluation of the band gap, once the convergence was achieved and the structures were optimized, one more calculation was performed. It was done using 12 × 12 × 12, 8 × 12 × 8, and 10 × 10 × 10 grids, for the B2, Pmma, and Pnma, respectively. These grids were not shifted, in order to include the Γ point in the sampling.
The PBE exchange and correlation energy functional approximation was mainly used along this work36. Some comparisons also involve the LDA and PBEsol37functionals.PAW atomic datasets for all the functionals were generated by the ATOMPAW code using the input files provided on the ABINIT website.
The Pmma and Pnma cells are shown in Figs.1 and 2,respectively, while the internal sites occupied by the ions are described in Table 1.
As we discussed above, several theoretical computations on CsI have been reported in the literature. However, the evolution of the experimental measurements mainly guided the direction of the electronic structure simulations in the early years. In this work, we compute the relative stability of all the relevant crystal phases and the pressure-effect on the band gap using DFT-based electronic structure methods under similar quality criteria. The selected k-point sampling meshes and plane-wave kinetic-energy cutoffs lead to convergence in the total energy and lattice parameters.
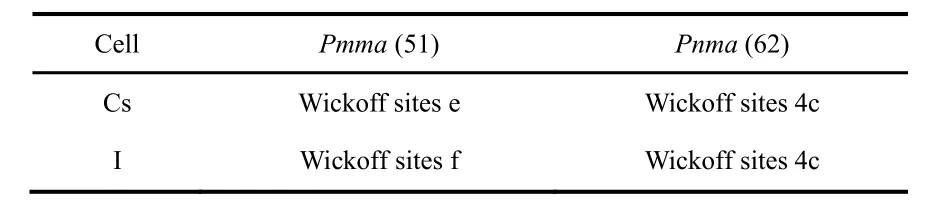
Table 1 Internal coordinates within the unit cell for the CsI orthorhombic structures.
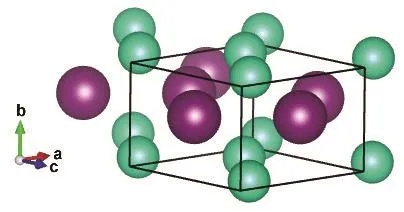
Fig.1 CsI in the orthorhombic Pmma structure.
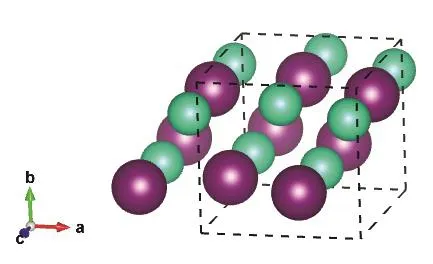
Fig.2 CsI in the orthorhombic Pnma structure.
3 Results and discussion
The phase stability is analyzed by free energy, G = E + PV −TS = H − TS, of the different cell types, namely, NaCl-type (B1),CsCl-type (B2), and the orthorhombic cells Pmma (space group 51) and Pnma (space group 62). At zero temperature, the free energy becomes equal to the enthalpy (H). Then, for each pressure and for each cell type, the cell parameters and the internal coordinates are optimized. At zero pressure, the PBE functional approximation predicts that the B1 structure is the most stable; the B1 cell is lower in energy than the B2 cell by 2.3 mHa·formula−1. Earlier reports also find a similar result38.Different exchange and correlation energy functional approximations can overestimate the stability of some cells, see for example refs.39,40. The PBEsol approximation correctly predicts that the B2 cell is the most stable at low pressures and,at zero pressure, the B2 cell energy is lower that the corresponding one for the B1 structure by 0.3 mHa·formula−1.This energy difference is within the thrust margin of predictability for an exchange and correlation energy functional approximation. As Mao et al. suggested22, the Pmma structure reduces to the B2 structure at low pressures. The two cell types become equivalent when a = c and a = 2b. Using PBE one finds that the orthorhombic cell Pmma reduces to the cubic B2 below 38 GPa and this result is consistent with previous reports41,23,24. Additionally, at low pressures, the orthorhombic Pnma cell becomes equal to the cubic B1 cell. PBE finds this symmetrization at 3 GPa.
As pressure increases, the enthalpy of the different phases changes and the stability is altered, see Fig.3. The B2 phase becomes more stable than the B1 at 0.6 GPa (PBE result). The PBE optimized lattice parameters for the different CsI phases are reported on Table 2. Note that PBEsol provides better estimation of the lattice parameter at zero pressure. The B2 phase is stable up to 38 GPa and it is equivalent to the Pmma cell. The Pmma cell becomes orthorhombic and more stable at moderate pressures. PBE predicts this transition at 38 GPa,where the lattice parameter ratios suddenly mismatched the cubic conditions, see Fig.4. The phase transition seems to be first order, but the relative change in the volume is marginal,around 0.2%. The stability of the Pmma cell remains for a very limited range of pressures. The Pnma cell becomes the stable phase at higher pressures. Xu et al. predict the stability of this phase up to 300 GPa24. PBE estimates that the orthorhombic Pnma phase becomes stable at 42.8 GPa and the phase transition is first order with a very small relative change in the volume,1.4%. Even when two phase transitions are found between 38 and 43 GPa, the volume of the involved phases are so similar that the P−V curve seems to be almost continuous, Fig.5. The apparent continuous behavior of the isotherm is the main issue in the earlier controversy on the structural phase transition around 40 GPa. Some details on the crystal structures at the transition pressures are given in Table 3.
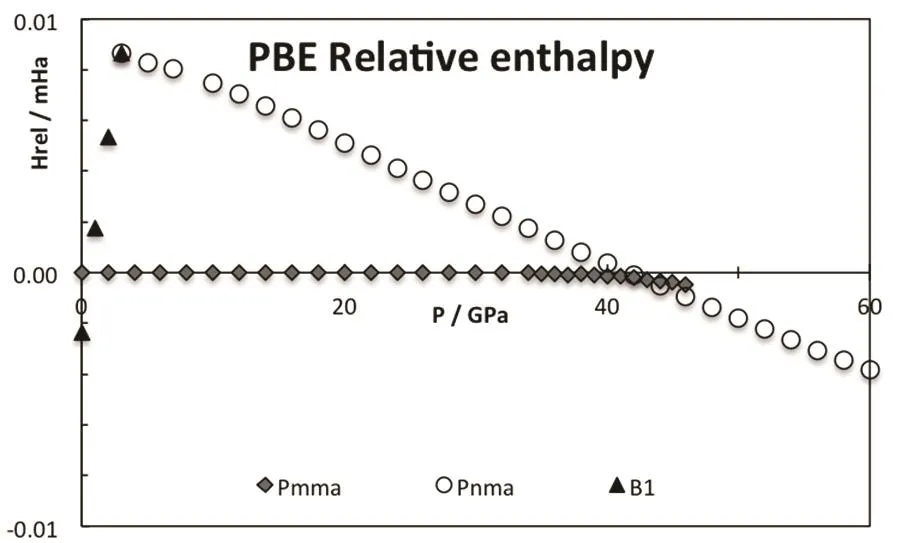
Fig.3 Relative enthalpy for the different CsI phases,PBE results in hartree·formula−1.
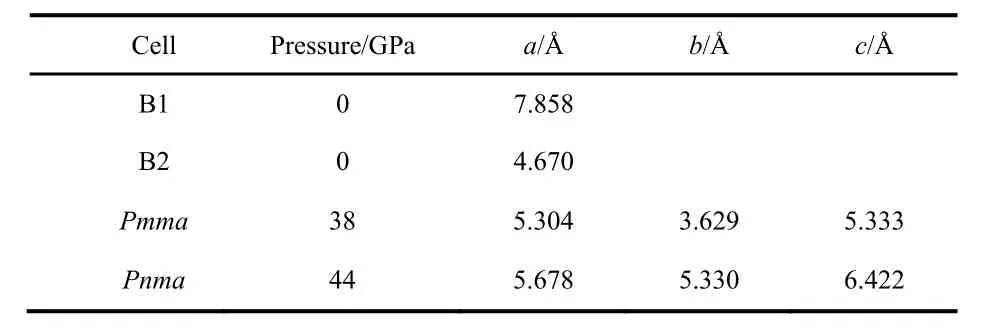
Table 2 PBE lattice parameters for the different CsI structures.
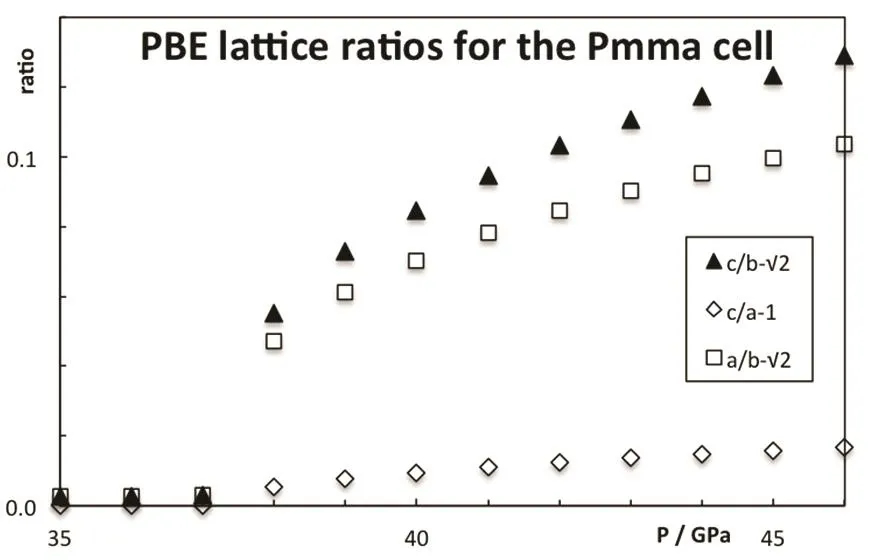
Fig.4 Deviation from the cubic symmetry in the CsI Pmma structure.
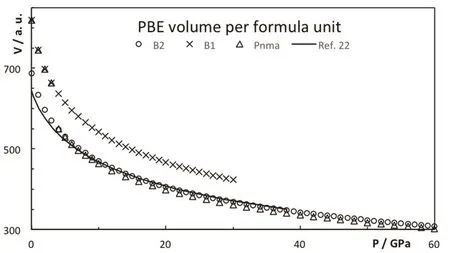
Fig.5 Volume per formula for the different CsI phases.
In addition to the crystallographic and structural studies,electronic properties were also measured at high pressures. The pressure dependence of the optical gap3,4,10,12,14,42and the electric resistivity25,26were determined. Asaumi and Kondo3originally observed that the threshold energy in CsI lowers as the pressure increases. Many efforts focused on the insulator-conductor transition and the band gap was estimated in different pressure ranges. Most of the studies report a decrease in the band gap with the pressure. Fig.6 shows the evolution of the electronic band gap, computed from the PBE functional approximation, with the pressure. At low pressures, the PBE method underestimates the band gap as it has been documented in the literature; however, the trend is correctly reproduced. In particular, a maximum value of the band gap is found around 2 GPa, V/V0= 0.87. The position of the maximum is in very good agreement with the results from Asaumi4. Other exchange-correlation energy functionals do not display necessarily the same behavior: PBEsol predicts a maximum at a similar pressure, while a monotonic decrease is obtained with LDA15. The discontinuity in the plot, around 43 GPa, is a consequence of the Pmma-Pnma phase transition. The Pnma structure presents a larger band gap, about 40 percent. The subsequent increase in the pressure leads a decrease in the band gap. This discontinuity can be mapped into the electric resistivity. Babushkin25found a sharp increase in the CsI resistivity around 45 GPa. At higher pressures, the electric resistivity monotonically vanishes, at least up to 220 GPa26.These observations are consistent with our results for the estimated band gap. Our results also match previous theoretical reports15,17,23,24. In fact, Xu et al.24predict that the gap vanishesat 103 GPa from PBE computations, in excellent agreement with the experimental estimation of the band gap closure, around 100 GPa14.
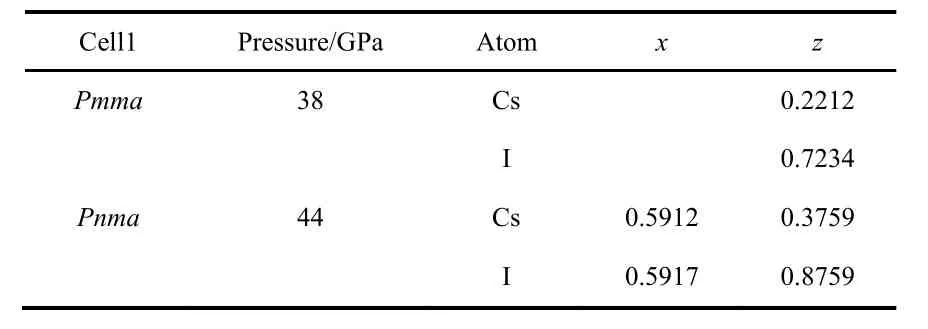
Table 3 PBE internal coordinates for the different CsI orthorhombic structures.
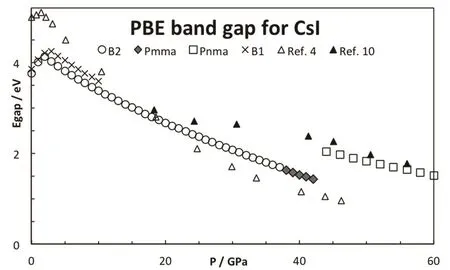
Fig.6 Effect of the pressure in the CsI band gap.
4 Conclusions
DFT-based electronic structure methods provide a correct description of the structure, stability and pressure-induced phase transitions in CsI. The precision of these methods,especially at high pressures, is still under study for molecular and solid state systems. The PBE exchange and correlation energy functional approximation provides a good description of the relative stability of the different cell structures of CsI;however, it overestimates the stability of the B1 phase at zero pressure. The modified functional approximation for solids, PBEsol, corrects the phase stability problem, but it is not as accurate as PBE at high pressures. The authors previously observed this behavior in another crystalline system40. A more extensive study of the performance of the different kinds of exchange and correlation energy approximations over a wide range of pressures could provide a more general conclusion.
The band gap prediction from DFT has also been under discussion for a long time. On a qualitative basis and assuming that the only relevant conduction mechanism comes from the band structure, it is interesting to notice that the band gap predictions from the PBE approximation favorably compare with the experimental measurements of the optical threshold energy and resistivity of CsI for the pressure range of this work. A quantitative estimation of the resistivity and the inclusion of thermal effects are beyond the scope of this study.
Acknowledgement: This work is dedicated to the memory of Robert G. Parr, a great scientist, humanist, and friend.
(1) Nelson, D. A., Jr.; Ruoff, A. L. Phys. Rev. Lett. 1979, 42, 383.doi: 10.1103/PhysRevLett.42.383
(2) Besson, J. M.; Itie, J. P.; Weill, G.; Makarenko, I. J. Phys. Lett. 1982,43, 401. doi: 10.1051/jphyslet:019820043011040100
(3) Asaumi, K.; Kondo, Y. Solid State Comm. 1981, 40, 715.doi: 10.1016/0038-1098(81)90813-9
(5) Huang, T. L.; Ruoff, A. L. Phys. Rev. B 1984, 29, 1112.doi: 10.1103/PhysRevB.29.1112
(6) Itie, J.; Polian, A.; Besson, J. J. Phys. Coll. 1984, 45, 47.doi: 10.1051/jphyscol:1984809
(7) Knittle, E.; Jeanloz, R. Science 1984, 223, 53.doi: 10.1126/science.223.4631.53
(8) Huang, T. L.; Brister, K. E.; Ruoff, A. L. Phys. Rev. B 1985, 30,2968. doi: 10.1103/PhysRevB.30.2968
(9) Brister, K. E.; Vohra, Y. K.; Ruoff, A. L. Phys. Rev. B 1985, 31,4657. doi: 10.1103/PhysRevB.31.4657
(10) Knittle, E.; Jeanloz, R. J. Phys. Chem. Solids 1985, 46, 1179.doi: 10.1016/0022-3697(85)90147-7
(11) Knittle, E.; Rudy, A.; Jeanloz, R. Phys. Rev. B 1985, 31, 588.doi: 10.1103/PhysRevB.31.588
(12) Reichlin, R.; Ross, M.; Martin, S.; Goettel, K. A. Phys. Rev.Lett. 1986, 56, 2858. doi: 10.1103/PhysRevLett.56.2858
(13) Vohra, Y. K.; Brister, K. E.; Weir, S. T.; Duclos, S. J.; Ruoff,A. L. Science 1986, 231, 1136.doi: 10.1126/science.231.4742.1136
(14) Williams, Q.; Jeanloz, R. Phys. Rev. Lett. 1986, 56, 163.doi: 10.1103/PhysRevLett.56.163
(15) Aidun, J.; Bukowinski, M. S. T.; Ross, M. Phys. Rev. B 1984,29, 2611. doi: 10.1103/PhysRevB.29.2611
(16) Christensen, N. E.; Satpathy, S. Phys. Rev. Lett. 1985, 55, 600.doi: 10.1103/PhysRevLett.55.600
(17) Satpathy, S.; Christensen, N. E.; Jepsen, O. Phys. Rev. B 1985,32, 6793. doi: 10.1103/PhysRevB.32.6793
(18) Vohra, Y. K.; Duclos, S. J.; Ruoff, A. L. Phys. Rev. Lett. 1985,54, 570. doi: 10.1103/PhysRevLett.54.570
(19) Satpathy, S. Phys. Rev. B 1986, 33, 8706.doi: 10.1103/PhysRevB.33.8706
(20) Baroni, S.; Giannozzi, P. Phys. Rev. B 1987, 35, 765.doi: 10.1103/PhysRevB.35.765
(21) Cedillo, A.; Vela, A.; Gázquez, J. L. Structural Phase Transitions in Cesium Halides. In Density Functional Methods in Chemistry; Labanowski, J. K., Andzelm, J. W.Eds.; Springer: New York, NY, USA, 1991; pp. 293–306.doi: 10.1007/978-1-4612-3136-3_19
(22) Mao, H. K.; Wu, Y.; Hemley, R. J.; Chen, L. C.; Shu, J. F.;Finger, L. W.; Cox D. E. Phys. Rev. Lett. 1990, 64, 1749.doi: 10.1103/PhysRevLett.64.1749
(23) Winkler, B.; Milman, V. J. Phys. Condens. Matter 1997, 9,9811. doi: 10.1088/0953-8984/9/45/009
(24) Xu, Y.; Tse, J. S.; Oganov. A.R.; Cui, T.; Wang, H.; Ma, Y.;Zou, G. Phys. Rev. B 2009, 79, 144110.doi: 10.1103/PhysRevB.79.144110
(25) Babushkin, A. N. High Pressure Res. 1991, 6, 349.doi: 10.1080/08957959208201042
(26) Eremets, M. I.; Shimizu, K.; Kobayashi, T. C.; Amaya, K.J. Phys. Condens. Matter 1998, 10, 11519.doi: 10.1088/0953-8984/10/49/037
(27) Breskin, A. Nucl. Instrum. Meth. Phys. Res. A 1996, 371, 116.doi: 10.1016/0168-9002(95)01145-5
(28) Va'vra, J.; Breskin, A.; Buzulutskov, A.; Chechik, R.; Shefer,E. Nucl. Instrum. Meth. Phys. Res. A 1997, 387, 154.doi: 10.1016/S0168-9002(96)00980-1
(29) Sham, L. J.; Schlüter, M. Phys. Rev. Lett. 1983, 51, 1888.doi: 10.1103/PhysRevLett.51.1888
(30) Perdew, J. P. Int. J. Quantum Chem. Symp. 1986, 19, 497.doi: 10.1002/qua.560280846
(31) Perdew, J. P.; Yang, W.; Burke, K.; Yang, Z.; Gross, E. K. U.;Scheffler, M.; Scuseria, G. E.; Henderson, T. M.; Zhang, I. Y.;Ruzsinszky, A.; et al. Proc. Natl. Acad. Sci. 2017, 114, 2801.doi: 10.1073/pnas.1621352114
(32) Gonze, X.; Amadon, B.; Anglade, P. M.; Beuken, J. M.;Bottin, F.; Boulanger, P.; Bruneval, F.; Caliste, D.; Caracas, R.;Côté, M.; et al. Comput. Phys. Comm. 2009, 180, 2582.doi: 10.1016/j.cpc.2009.07.007
(33) Gonze, X.; RignaneseI, G. M.; Verstraete, M.; Beuken, J. M.;Pouillon, Y.; Caracas, R.; Jollet, F.; Torrent, M.; Zerah, G.;Mikami, M. et al. Z. Kristallogr. 2005, 220, 558.doi: 10.1524/zkri.220.5.558.65066
(34) Blöchl, P. E. Phys. Rev. B 1994, 50, 17953.doi: 10.1103/PhysRevB.50.17953
(35) Torrent, M.; Jollet, F.; Bottin, F.; Zerah, G.; Gonze, X.Comput. Mater. Sci. 2008, 42, 337.doi: 10.1016/j.commatsci.2007.07.020
(36) Perdew, J. P.; Burke, K.; Ernzerhof, M. Phys. Rev. Lett. 1996,77, 3865. doi: 10.1103/PhysRevLett.77.3865
(37) Perdew, J. P.; Ruzsinszky, A.; Csonka, G. I.; Vydrov, O. A.;Scuseria, G. E.; Constantin, L.A.; Zhou, X.; Burke, K. Phys.Rev. Lett. 2008, 100, 136406.doi: 10.1103/PhysRevLett.100.136406
(38) Cortona, P. Phys. Rev. B 1992, 46, 2008.doi: 10.1103/PhysRevB.46.2008
(39) Demichelis, R.; Civalleri, B.; D'Arco, P.; Dovesi, R. Int. J.Quantum Chem. 2010, 110, 2260. doi: 10.1002/qua.22574
(40) Cedillo, A.; Torrent, M.; Cortona, P. J. Phys. Condens. Matter 2016, 28, 185401. doi: 10.1088/0953- 8984/28/18/185401
(41) Buongiorno, M.; Baroni, S.; Giannozzi, P. Phys. Rev. Lett.1992, 69, 1069. doi: 10.1103/PhysRevLett.69.1069
(42) Lipp, M. J.; Yoo, C. H.; Strachan, D.; Daniels, W. B. Phys.Rev. B 2006, 73, 085121. doi: 10.1103/PhysRevB.73.085121