杯[4]芳烃修饰的钌ギ配合物的合成与性质
2018-02-01黄秋颖韩银锋郑泽宝
黄秋颖 韩银锋 郑泽宝*,
(1河南工业职业技术学院化学工程系,南阳 473009)
(2泰山学院化学化工学院,泰安 271021)
0 Introduction
The pH responsive compounds have attracted tremendous interest in recent decades in many fields such as acid rain pollution,biological and chemical analyses,and environmental monitoring[1].Although many methods have been used for measuring pH value variations such as electrochemicalmethod,which is well established and known,it has disadvantages and limitations.For example,the signal can be influenced by electromagnetic fields and aggressive analytes[2].Among these methods,luminescence technology is one of the most important methods to achieve sensitive and rapid pH sensing due to the advantage of low background noise and high sensitivity[3-5].Moreover,the microscopic imaging technique could map the proton distribution within living cells[6-8].However, most conventional fluorescent dyes,especially commercialized probes,fail to provide longperiod tracking due to severe photobleaching[9-10].The pH-responsive rutheniumギ polypyridyl complexes can overcome above-mentioned shortcomings because their long emission lifetime,large Stokes shift and high photostability[11-13].Since the derivatives of imidazo[4,5-f][1,10]phenanthroline possess ionizable N-H protons,the optical properties of many rutheniumギpolypyridyl complexes can be finely tuned through protonation/deprotonation of these N-H protons,achieving intriguing pH and anions luminescence switching/sensing events[14-16].However,the luminescence change factors need to be further boosted and pH switching regions need further expansion. Further,some rutheniumギ polypyridylcomplexeshavebeen investigated for the applications of live cell staining in different cell compartments,such as nucleus[17],lysosomes[18],cytoplasm[19],and mitochondria[20-21].However,only a few examples of rutheniumギ polypyridyl complexes succeeded in live cell imaging with low cytotoxicity and good water solubility.Yet,the vast potential of rutheniumギpolypyridyl complexes as cell imaging probes still remains largely untapped.
The functionalized calix[n]arenes have been found a significant feature that their ability to act as carriers through membranes or to be incorporated into channeling systems,with analytical and therapeutic applications[22-23].In the present study,by grafting calix[4]arene fragment to rutheniumギ polypyridyl complex,we synthesized a new calix[4]arene-based rutheniumギpolypyridyl complex of[Ru2(bpy)4(H2L)](ClO4)4(1)(bpy=2,2′-bipyridine and H2L=11,23-bis (2-imidazo[4,5-f]-1,10-phenanthroline)-25,27-dihydroxy-26,28-diethoxycarbonylpropyl-5,17-di-p-t-butyl-calix[4]arene),and found that this complex acted as a highly efficient pH-induced “off-on-off”luminescence switch,a “turn off”luminescence sensor for F-and OAc-as well as living HeLa cellularimaging agentwith minor cytotoxicity.
1 Experimental
1.1 Materials and measurements
All of the reagents used for synthesis were obtained commercially,and were used without further purification.The tetrabutylammonium salts with relative anions (F-,Cl-,Br-,I-,OAc-,OH-,NO3-,ClO4-,HSO4-,and H2PO4-)were purchased from Aldrich.1,10-Phenanthroline-5,6-dione,11,23-diformyl-25,27-dihydroxy-26,28-diethoxycarbonylpropyl-5,17-di-p-t-butyl-calix[4]arene,and cis-Ru(bpy)2Cl2were prepared according to the literature procedures[24-26].The1H NMR spectrum and13C NMR spectrum were collected using a Bruker DRX-400 NMR spectrometer with DMSO-d6as the solvent.The elemental analyses were performed on a Vario EL elemental analyzer.The IR spectrum were recorded on a Nicolet 6700-IR spectrometer as KBr disks.The UV-Vis absorption spectra were recorded using a Shimadzu UV-2700 UV-Vis spectrophotometer.A high resolution mass spectrum was obtained using an API Q-star pulsar I/oMALDI/Qq-TOF mass spectrometer.Emission spectra were obtained on an F-7000 spectrofluorophotometer (Hitachi). The luminescence lifetime studies were conducted using a HORIBA Jobin Yvon Fluorolog-3 spectro-fluorometer fitted with a time-correlated single photon counting detector and a NanoLED pulsed laser diode excitation source (455 nm).
1.2 Synthesis of H2L
p-t-Butyl-calix[4]arene was acylated with ethyl-bromoacetate in the presence ofK2CO3to get compound 2 (Scheme 1)in 76%yield.Refluxing of compound 2 with hexamethylenetetramine (HMTA)in trifluoro-acetic acid (TFA)gave calix[4]arene diester dialdehyde 3 in 65%yield.H2L was synthesized by condensing of 3 (99 mg,0.12 mmol)and 1,10-phenanthroline-5,6-dione (55 mg,0.26 mmol)in glacial acetic acid (5.0 mL)at 120 ℃ for 8 h (Scheme 1).Upon cooling to room temperature,the reaction mixture was poured into 100 mL cold water under vigorous stirring.The solution was neutralized to pH 7.0 with concentrated aqueous ammonia.The crude productwasthen recrystallized twicefrom 95%ethanol.Yield:68%.IR (KBr pellet,cm-1):3 333(m),2 958(m),2 867(m),1 730(s),1 681(m),1 595(m),1 469 (s),1 442 (s),1 293 (m),1 180 (s),1 112(m),1 033(m),804(m),740(s);1H NMR (400 MHz,DMSO-d6):δ 13.39 (s,2H,N-H),9.74 (s,1H,O-H),9.64 (s,1H,O-H),9.01~9.04 (d-d,J=7.2 Hz,4H),8.91~8.93(d-d,J=6.4 Hz,4H),8.14 (d,J=6.0 Hz,4H),7.83~7.87 (m,4H),7.24 (d,J=6.0 Hz,4H),4.32 (d,J=12.8 Hz,4H),4.07~4.15 (m,8H),3.70 (d,J=12.8 Hz,4H),2.89 (t,J=7.2 Hz,4H),2.26~2.32 (m,4H),1.17~1.21(m,6H),1.10~1.13 (s-s-s,18H).ESI-MS (positive,DMF)[M+H]+:Calcd.m/z=1 201.55;Found m/z=1 201.53.
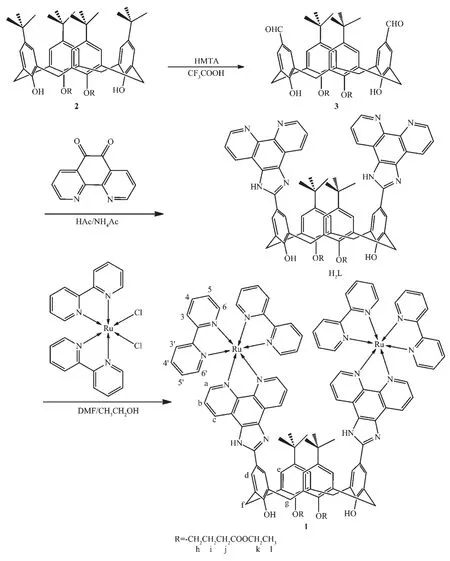
Scheme 1 Synthetic route for 1
1.3 Synthesis of[Ru2(bpy)4(H2L)](ClO4)4(1)
Complex 1 wassynthesized by refluxing a solution of cis-Ru(bpy)2Cl2(53 mg,0.10 mmol)and H2L (60 mg,0.050 mmol)in 44 mL ethanol-DMF (10∶1,V/V)under nitrogen for 12 h.After the solution was cooled down to room temperature,the precipitate was removed by filtration.The filtrate was concentrated to about 4.0 mL by rotary evaporation,then purified by silica gel column chromatography using a solvent mixture of CH3CN-20%aqueous KNO3(7∶1,V/V)as the eluent.The eluent was evaporated to small volume and was then precipitated with saturated NaClO4aqueous solution.The resulting solid was then recrystallized by diffusion of diethyl ether into a concentrated acetonitrile solution of the complex to give 82 mg (Yield:33%)of the target product.Anal.Calcd.for C114H104Cl4N16O24Ru2(%):C:56.44;H:4.32;N:9.24.Found (%):C,56.18;H,4.28;N,9.27.IR(KBr pellet,cm-1):3 743 (m),2 952 (m),2 904(m),1 726 (s),1 602 (m),1 506 (s),1 446 (s),1 365(m),1 139(s),1 116(m),1 090(vs),809(m),767(s),627(s);1H NMR (400 MHz,DMSO-d6,Fig.S1a):δ 13.95 (s,2H,N-H),9.31 (s,2H,O-H),9.05~9.10 (d-d,J=8.0 Hz,4H,Hc),8.82~8.88 (d-d,J=8.0 Hz,8H,H3,3′),8.20~8.24 (m,8H,H4′,d),8.05~8.11 (m,8H,H4,a),7.84~7.96(m,4H,Hb),7.84 (d,J=5.2 Hz,4H,H6′),7.56~7.60 (m,8H,H6,e),7.25~7.33 (m,8H,H5,5′),4.34 (d,J=12.8 Hz,4H,Hf),4.11~4.16 (m,8H,Hh,k),3.72 (d,J=12.8 Hz,4H,Hg),2.91 (t,J=7.2 Hz,4H,Hj),2.32 (m,4H,Hi),1.20~1.23 (m,6H,Hl),1.09~1.06 (s-s-s,18H,-C(CH3)3);13C NMR (125 MHz,DMSO-d6,Fig.S1b):δ 173.09,157.17,157.00,155.55,153.40,151.83,150.00,145.49,144.98,138.19,137.33,132.85,129.23,128.33,127.57,126.55,125.89,124.87,121.51,121.13,74.85,60.46,34.62,31.52,31.41,30.44,25.51,14.56.ESI-MS (positive,CH3CN)[M-ClO4-]+:Calcd.m/z=2 326.64;Found,m/z=2 326.62,100%.
1.4 Optical sensing studies
UV-visible and emission spectrophotometric pH titrations of 1 were carried out in Britton-Robinson buffer (40 mmol·L-1H3PO4,40 mmol·L-1CH3COOH,40 mmol·L-1H3BO3)with 0.10 mol·L-1NaCl to keep constant ionic strength.The luminescence quantum yields were calculated by comparison with[Ru(bpy)3]2+(Φstd=0.028)in aerated aqueous solution at room temperature using Eq.(1)[27].

The interaction of 1 with various anions was investigated in acetonitrile solutions.When the spectrofluorometric titrations were performed,the stock solution of 1 (1.0 mmol·L-1)was diluted to 10 μmol·L-1with acetonitrile.Microliter aliquots of the anions underinvestigation were then injected into the solution of 1 through a rubber septum in the cap.The solution of 1 was magnetically stirred for 1 min after each addition,and then was scanned again.This processwasrepeated untilthe changesin the emission and UV-Visabsorption spectrabecame insignificant.The excitation wavelength λexwas fixed to 454 nm for the emission measurements.
The binding/equilibrium constants of the 1 with F-and OAc-were evaluated from the absorbance and emission titration experiments,and obtained using the Benesi-Hildebrand equations (2)and (3),respectively[28-29].

where A0(I0)and A∞(I∞)are the absorbance (emission intensities)of the free and fully bound forms of 1,respectively,A (I)is the absorbance (emission intensity)of 1 in the presence of F-or OAc-,n represents the stoichiometry of binding of F-or OAc-to 1,K is the association constant of the binding of 1 to the F-or OAc-,and CGiis the concentration of F-or OAc-added.
1.5 Cell culture and confocal luminescence cellular imaging
The HeLa cell line was purchased from the Institute of Biochemistry and Cell Biology,Chinese Academy of Sciences,and grown in Dulbecco′s Modified Eagle′s medium (DMEM)(MediaTech,Herndon,VA)with 10%fetal bovine serum (FBS)(Hyclone,Logan,UT)at 37 ℃ and 5%CO2(V/V,the same below).Cells were plated on 18 mm glass coverslips and allowed to adhere for 24 h.Then these cells were incubated with 10 μmol·L-1of complex 1(PBS buffer,pH=7.2)for imaging experiments.Confocal luminescence imaging of cells was performed with a confocal fluorescence microscope equipped with a 60×oil-immersion objective lens (OLYMPUS FV1000 IX8),excitation at 455 nm was carried out with a semiconductor laser,and emission was collected at 560 to 660 nm.
1.6 Cytotoxicity assay
The 3-(4,5-dimethylthiazol-2-yl)-2,5-diphenyl-tetrazolium bromide (MTT)assay was used for measuring the in vitro cytotoxicity of probe 1.The HeLa cells growing in a 96-well cell-culture plate at 5×10⁴cell per well and incubated at 37℃under 5%CO2for 24 h.Probe 1 (100 mL per well)at Lys content of 0~60 μmol·L-1were added to the wells of the treatment group,and diluted in DMEM at final concentration of 0.2%to the negative control group.The combined MTT/PBS solution was added to the 96-well assay plate,and incubated for 4 h.For measuring the absorbance value (OD570)of each well referenced at 690 nm,the enzyme-linked immunosorbent assay reader (infinite M200,Tecan,Austria)was used.The viability of cell growth was calculated by the following formula:Viability=(Asample/Acontrol)×100%.
2 Results and discussion
2.1 Synthesis and common optical properties
Probe 1 was synthesized through the reaction of stoichiometric amounts of H2L and cis-Ru(bpy)2Cl2in N,N-dimethylformamide and ethanol,and was characterized using an assortment of spectroscopic techniques such as IR,1H NMR,13C NMR,ESI-MS,and elemental(C,H and N)analyses.In order to fully assign the proton signals,{1H-1H}COSY experiment was performed and the resulting spectrum for complex 1 is shown in Fig.S2.In the aliphatic region,the cross peaks are observed between Hf-Hg,Hh-Hi,Hi-Hjand Hk-Hlresonances.In the aromatic region,the cross peaks are observed between H3-H4,H4-H5,H5-H6,H3′-H4′,H4′-H5′,H5′-H6′,Ha-Hband Hb-Hcresonances.These cross peaks are most valuable for characterization of complex 1.The spectral assignmentsof complex 1 were made using the cross peaks listed above and by taking into consideration the usual ranges of the J values for 2,2′-bipyridine[30].The IR spectrum for solid 1 displays the characteristic vibrational modes of the polypyridyl ligands (bpy and H2L)and an intense band in the region 1 726 cm-1corresponding to the stretching frequency ofcarbonyl groups.The UV-Vis absorption spectra of 1 in CH3CN are shown in Fig.S3a.The low-energy absorptions between 400 and 500 nm are attributed to the1MLCT,d (Ru2+)→π* (L)transition;the higher-energy absorption attributed to intra-ligand1(π-π*)transitions (<340 nm).Excitation into any of these absorption bands in probe 1 results in a broad emission at 591 nm (Fig.S3b).
2.2 Ground-and excited-state acid-base properties
Fig.1 shows the UV-Vis absorption spectra of 1 as a function of pH value.It indicates that the complex undergoes two successive protonation/deprotonation processes over the pH value range of 0.50~11.50.Upon increasing pH value from 0.50 to 5.00(Fig.1a),the absorption intensities of the MLCT band at 464 nm were moderately decreased;H2L-based(322 nm)and bpy-based (286 nm)intraligand π→π*transition bands were obvious decreased.These spectral changes are attributed to the concurrent dissociation of the protons on the protonated imidazole groups.The successive increases in pH value from 5.00 to 11.50 induced the deprotonation of the neutral imidazole groups of the complex as evidenced by significantly decreases in the absorption intensities at 286 nm and moderate increases in the 334 nm band as well as the appearance of an isosbestic point at 326 nm (Fig.1b).Scheme 2 summarizes the abovementioned two successive protonation/deprotonation processes.The pKavalues of the two ground-state acid ionization were derived to be pKa1=1.47±0.01 and pKa2=9.03±0.02 by non-linear sigmoidal fit of the data list in the insets of Fig.1,which are reasonably fall within the corresponding pKaranges from 0.31 to 2.48 and 8.21 to 9.65 for previously reported acid ionization constant values of the analogous Ruギcomplexes[31-33].As shown in Fig.2,the emission spectra of 1 are sensitive to the pH value changes,and consisting of two separate excited-state protonation/deprotonation processes.Upon increasing pH value from 0.70 to 4.00 (Fig.2a),the emission intensities increased moderately by a factor of ~1.4 (IpH4.00/IpH0.70=1.4,ΦpH4.00/ΦpH0.70=0.038/0.020=1.9),and the emission maxima are blueshifted from 607 to 598 nm.The blue shift of the luminescence band on going from protonated imidazole to neutral imidazole groups is due to a destabilization of the MLCT level,which involves as the final state the H2L π*orbital,resulting in an increase of the energy gap between Ru2+(dπ)6and the π*orbital of H2L[34].Obviously,the spectral changes above are mainly contributed to the excited-state deprotonation of the imidazole ring on 1.In contrast,further raising pH value from 4.00 to 12.00 (Fig.2b),the probe 1 exhibited decreased luminescence to 1.8%of the original intensity,acting as a highly sensitive“on-off” switch with a luminescence intensity tenuation factor of 96 (IpH4.00/IpH12.00=96,ΦpH4.00/ΦpH12.00=0.038/0.000 46=82).Interestingly,there was a good linearity between emission intensity and pH value in the pH value range from 6.50 to 8.50 (Inset of Fig.2b).The regression equation was found to be I=1 270.1-129.0pH with a linear coefficient of 0.991 9,indicating that probe 1 could detect pH value quantificationally within a narrow nearly neutral pH value region.The above-mentioned emission changes are ascribed to the two excited-state protonation/deprotonation processes which involved the same protons as involved in the UV-Vis spectrophotometric titrations.Obviously,probe 1 behaves as a pH-induced“off-on-off” emission switch.To the best of our knowledge,complex 1 is one of the most sensitive pH-induced luminescence “off-on”switch among the imidazole-containing Ruギ polypyridylcomplexes(Table 1)[35-36].
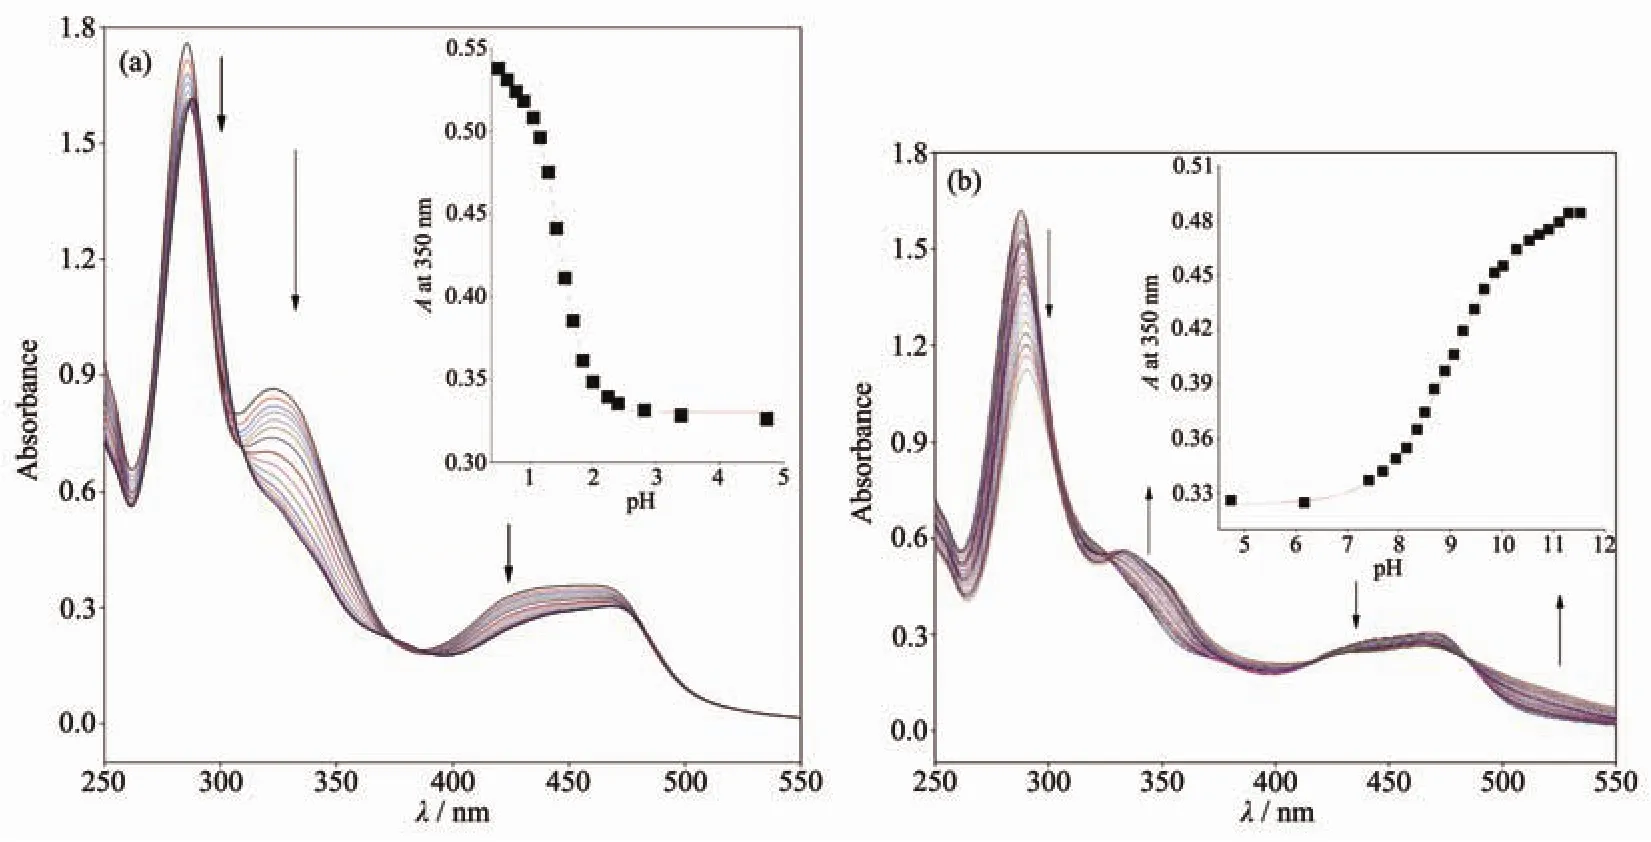
Fig.1 Changes of UV-Vis absorption spectra of 1 upon raising pH value from 0.50 to 5.00 (a)and from 5.00 to 11.50 (b)
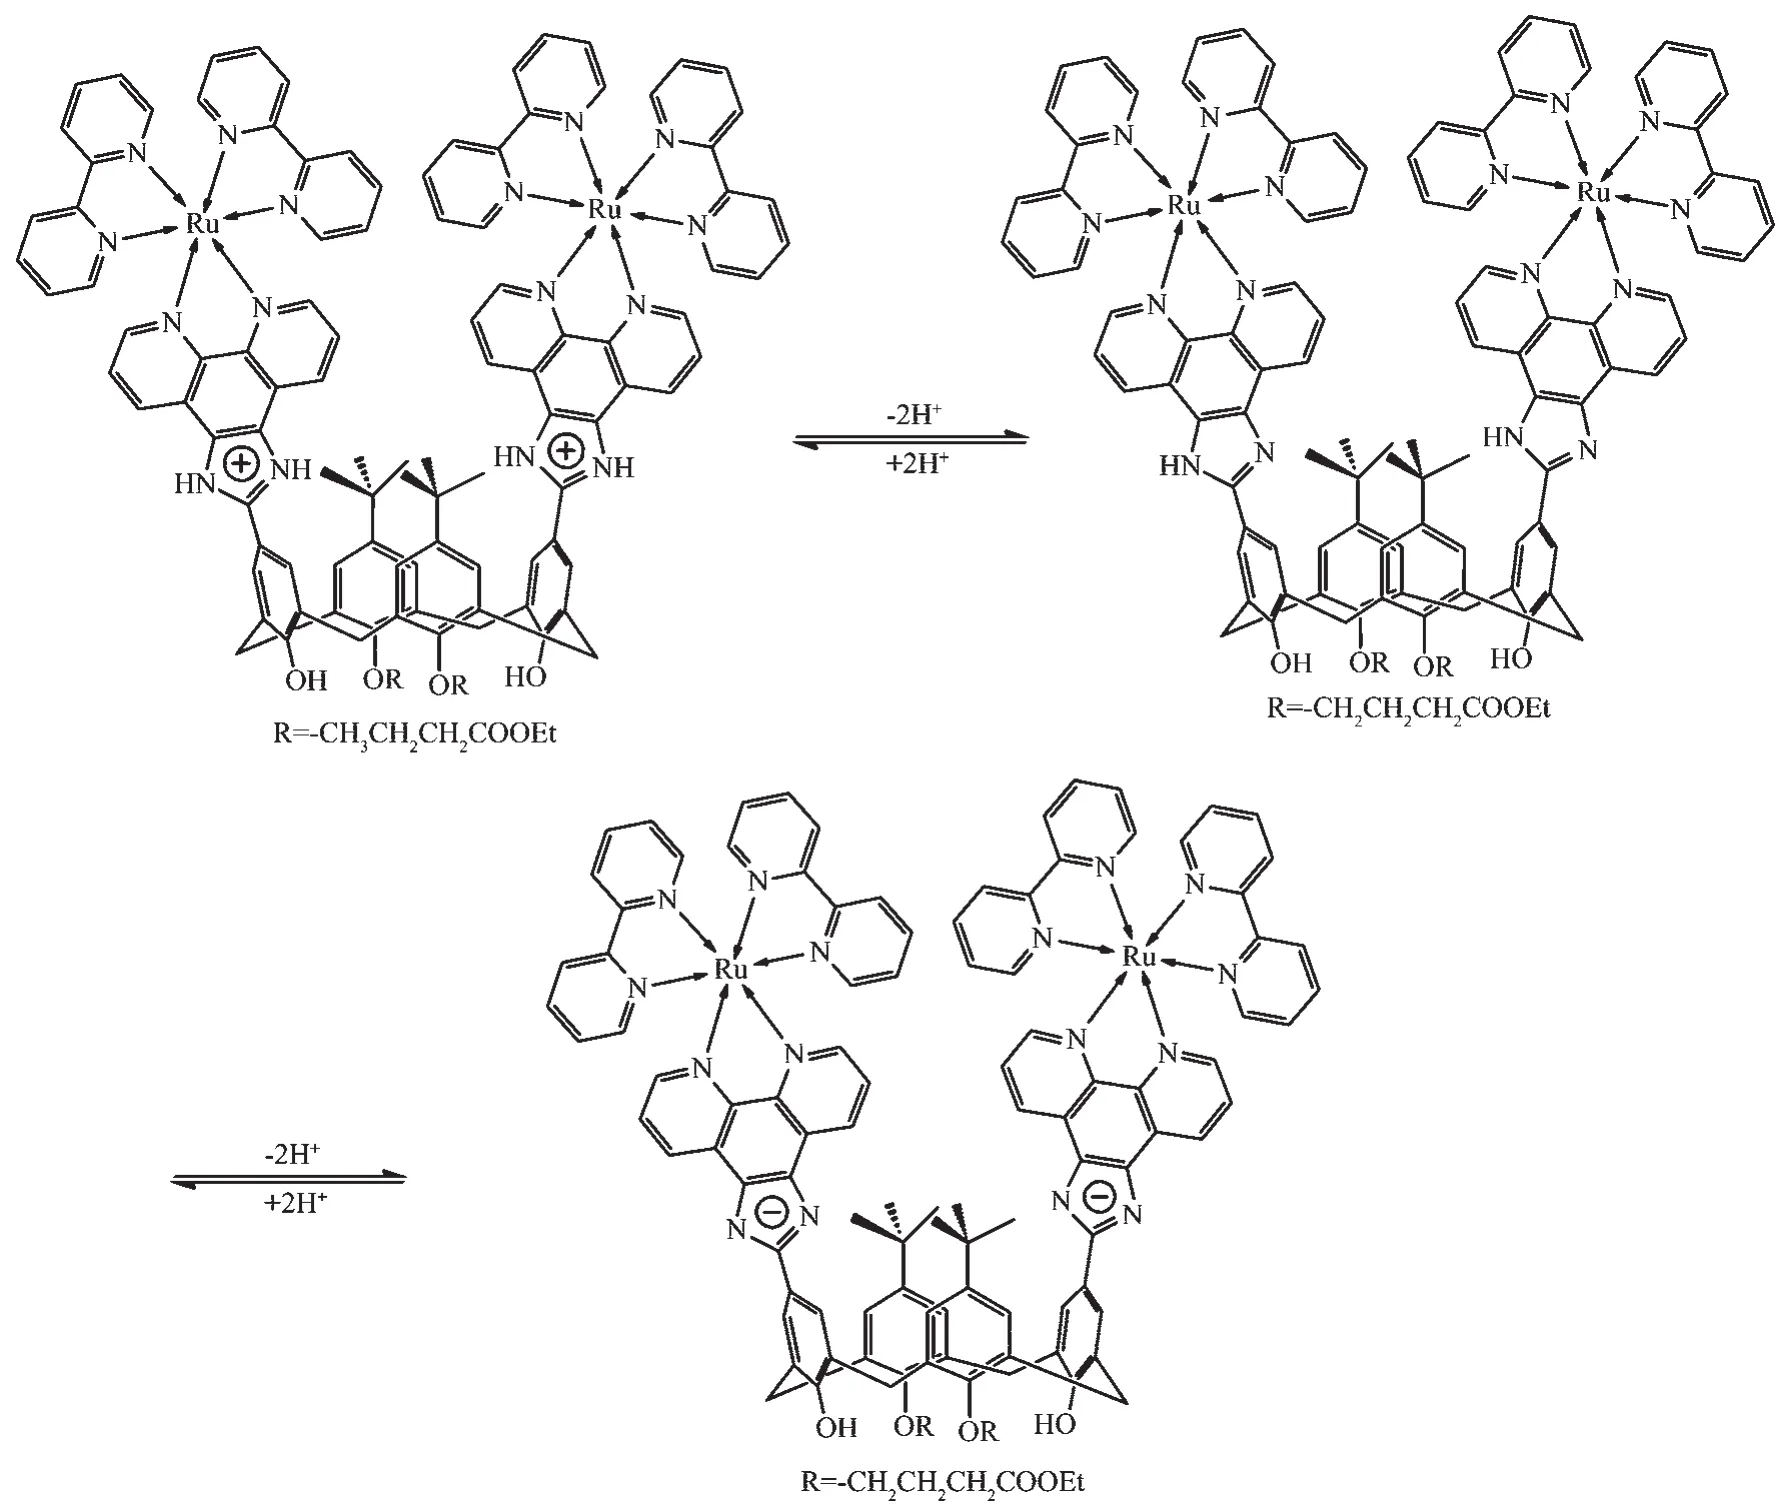
Scheme 2 Protonation-deprotonation processes of probe 1
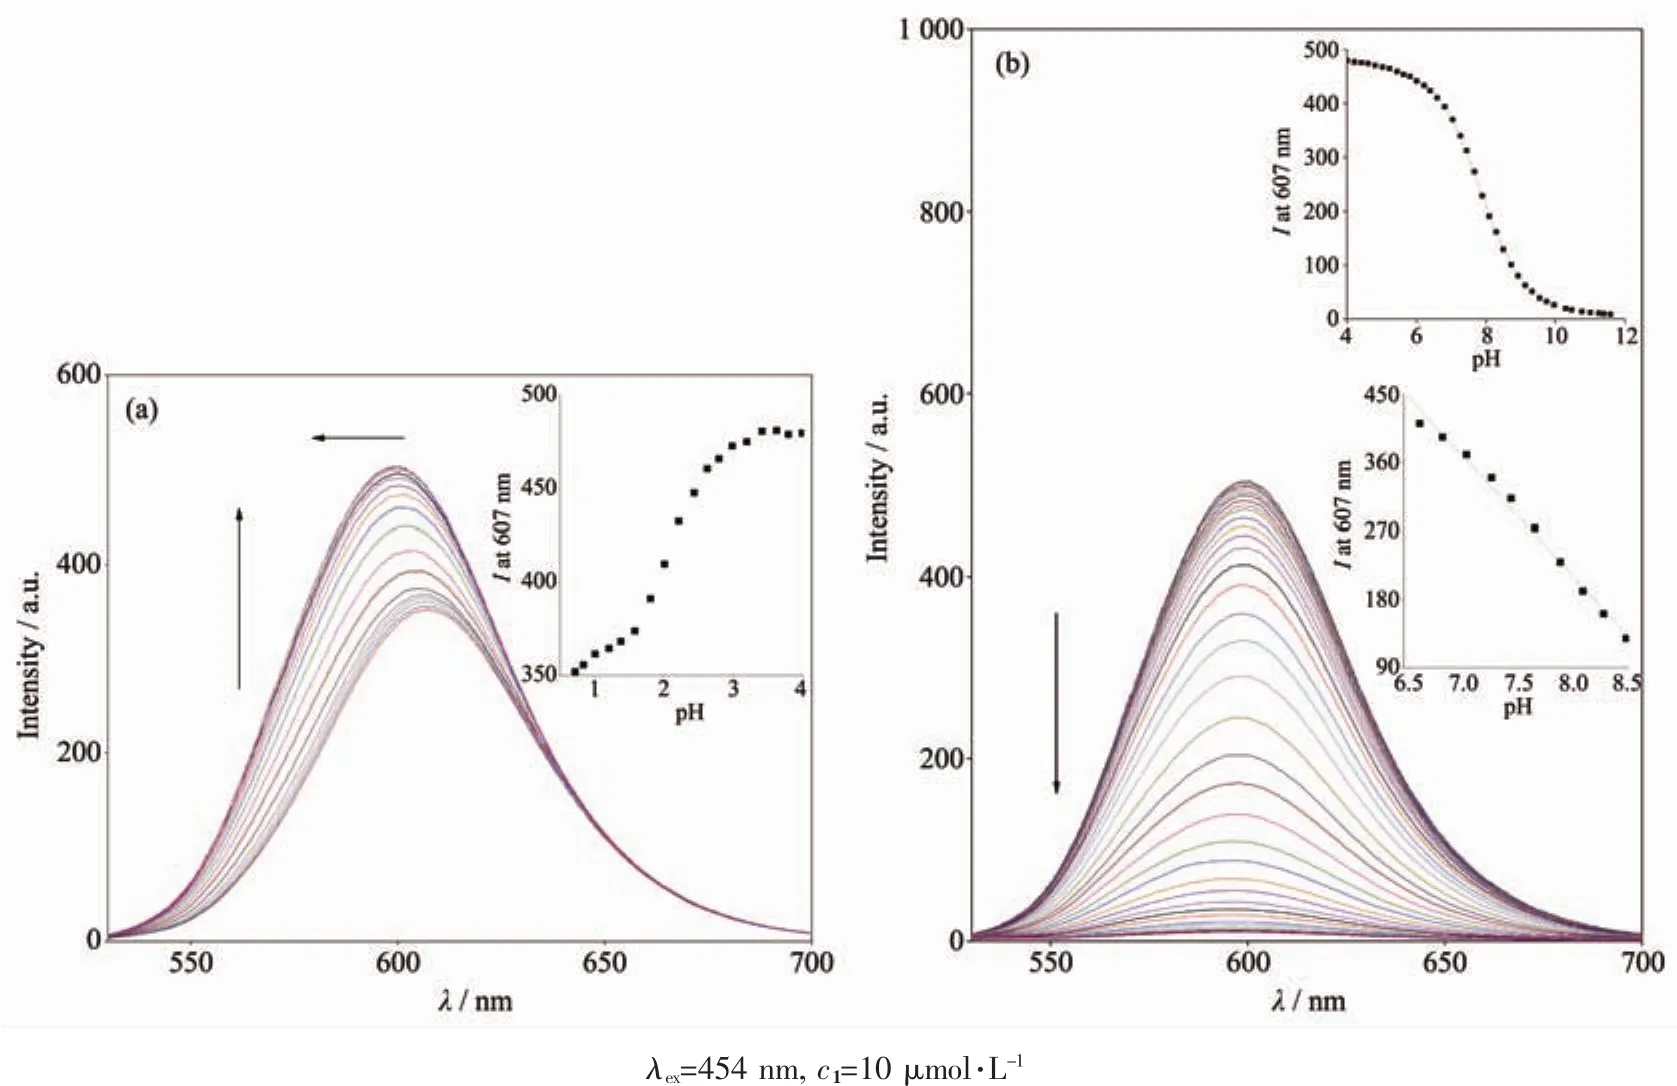
Fig.2 Changes of emission spectra of 1 upon raising pH value from 0.70 to 4.00 (a)and from 4.00 to 12.00 (b)
Importantly,the pH value is also found to have a significanteffecton the excited-states emission lifetimes as shown in Fig.3.For a pH=1.00 buffer,the emission lifetime value of 1 was found to be (693.1±1.3)ns,the lifetimes were noticeably increased by about 1.36 times (τ=(944.4±1.8)ns)upon the pH value was raised to 4.00.In contrast,when pH value was further increased from 4.00 to 12.00 at which the complex occurred as a fully deprotonated species of 1,the lifetimes were reduced to (138.2±1.2)ns (Table 2).These results indicate that probe 1 acts as a lifetime-based pH value sensor,which has more advantages over intensity methods,since the need for repetitive correction is reduced.The values of the excited state acid ionization constant of probe 1,pKa*,were derived according to Eq.(4),which is related tothe lifetimes of both acidic species (τHB)and its conjugate base (τB)as well as the inflection point pHifrom the plot of emission intensity vs pH value[37]:

Table 1 Comparison of pKaand pKa*values and luminescence on/off intensity ratios for ruthenium complex-based multi-state luminescence switchesa
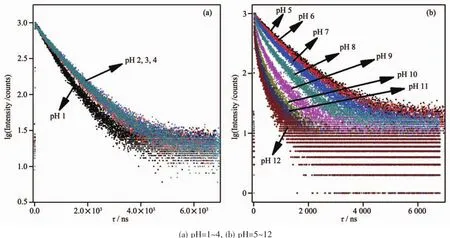
Fig.3 Luminescence decay curves of 1 at different pH values

By using pH value at reflection point of Fig.3a inset,pHi=2.08 and lifetime values of τHB=693.1 ns at pH 1.00,τB=944.4 ns at pH 4.00,the pKa1*value was calculated to be 2.21 which is 0.74pKaunits greater than pKa1,indicating that the electron density on{[Ru2(bpy)2(H4L)]6+}*was higher in the excited state than in the ground state,and the excited electron was localized on[H4L]2+rather than bpy,which increased the basicity of[H4L]2+.Whereas by using pH value at reflection point of Fig.2b inset,pHi=7.83 and lifetime values of τHB=944.4 ns at pH 4.00,τB=138.2 ns at pH 12.00,the pKa2*value was derived to be 6.99,which is 2.04pKaunits lower than pKa2,indicating that the electron in excited{[Ru2(bpy)2(H4L)]4+}*was localized on bpy rather than on H2L,which usually would lead to comparable or decreased excited-state acidity with respect to the ground-state acidity.This behavior is in agreementwith manyimidazole-containing Ruギcomplexes we previously reported[31-33].

Table 2 Luminescence lifetime of 1 in Britton-Roberson buffer at pH=1~12
2.3 Anion sensing properties
Sensing of the anions by probe 1 has been monitored by observing the spectral changes that occur in CH3CN solutions.As shown in Fig.4a,the UV-Vis absorption spectral remains practically unchanged upon addition of 10 equiv.of Cl-,Br-,,,,and I-ions to 10 μmol·L-1solutions of probe 1.On the other hand,following the addition of 10 equiv.of F-and OAc-,the MLCT band split in two broad bands centered at 426 and 463 nm,and a new band at 340 nm was formed.However,upon addition of theanion,the absorbance for the π-π*transition band at 290 nm and the MLCT band at 454 nm were significantly decreased,and the addition of excess of H2PO4-led to the precipitation of the resulting complex.The sensing of the receptor 1 for anions was also studied through emission spectral changes in CH3CN solutions.As can be seen from Fig.6b,the original emission bands at 591 nm for probe 1 was almost unchanged upon the addition of Cl-,Br-,NO3-,ClO4-,HSO4-,and I-to 10 μmol·L-1solutions of 1 because of the weaker interaction between them in solution.Upon the addition of an excess of F-,OAc-,and H2PO4-(up to 10 equiv.),the emissions for probe 1 are completely quenched except with
To obtain quantitative insight into the anion binding properties of probe 1,the absorption and emission spectral responses of 1 in a CH3CN solution after successive additions of F-and OAc-were studied in detail as well,and the results are shown in Fig.5 and Fig.S4 in the SI.As shown in Fig.5a,successive additions of F-from 0 to 40 μmol·L-1resulted in evident decreases and increases for the absorption intensities of 1 at 454 and 340 nm,respectively.The UV-Vis spectral changes induced by successive additions of OAc-(Fig.S4a),were almost same as those addressed above for 1 with F-.As shown in Fig.5b and Fig.S4b,and their insets,the incremental additions of F-or OAc-to approximately 4.0 equiv.ofF-and 3.0 equiv.of OAc-resulted in evident reductions(about 98%)in the emission intensities of probe 1 with a 10 nm red shift in the emission maxima from 591 to 601 nm.OAc-and F-induced emission quenching of 1 is most likely due to the deprotonation of the imidazole moiety of complex 1 by F-and OAc-,which is propitious to an intramolecular photoinduced electron transfer from the deprotonated imidazo[4,5-f][1,10]phenanthroline moiety to the excited-state Ruギcenter,which results in emission quenching[38].This deprotonation process was also demonstrated by the fact that the UV-Vis and emission spectral changes caused by titration with tetrabutylammonium hydroxide(Fig.S5a and S5b in the SI)and OAc-were identical to each other.As the imidazole NH is deprotonated,the π*orbital of H2L ligand is less destabilized than the Ru2+(dπ)6metal-centered orbital in the excited state complex,resulting in a decrease of the energy gap between Ru2+(dπ)6and the π*orbital of H2L and bathochromic shifts in the emission maxima accordingly.In contrast,H2PO4-induced a different UV-Vis absorption and emission spectral changes of 1 in CH3CN (Fig.S6).Successive additions of H2PO4-until a final concentration of 10 μmol·L-1(1.0 equiv.)resulted in UV-Vis absorption spectral changes that seemly similar to,but with significantly weaker absorption intensities for the band at 340 and 454 nm(Fig.S6a)than those observed for probe 1 with OAc-and F-.On further addition of H2PO4-beyond 1.0 equiv,the absorbance for the π-π*transition and the MLCT bands were significantly decreased and finally give rise to the precipitation of the resulting complex.Moreover,upon the addition of 1.0 equiv.of H2PO4-,the emission intensities of 1 at 591 nm in neat CH3CN were slightly enhanced along with a 3 nm red shift from 591 to 594 nm (Fig.S6b).Upon further additions of H2PO4-,the emission intensities were moderately decreased and finally the precipitation of the resulting complex were generated.The stoichiometries of 1to F-and OAc-were determined from Job plots (Fig.S7)to be 1∶2 and 1∶1.Using Eq.(2)and (3),the values of the binding/equilibrium constant K for 1 with F-and OAcwere determined by emission spectroscopy to be 5.4×10⁹L2·mol-2and 3.9×10⁴L·mol-1(Fig.S8).And the association constant,K,calculated from UV-Vis titrations are 3.8×10⁹L2·mol-2and 3.7×10⁴L·mol-1,which are consistent with the result obtained from fluorescence titrations.It is noted that the K values for 1 with F-and OAc-are of the same order of magnitude as those previously reported luminescence sensor for F-and OAc-[39-41].
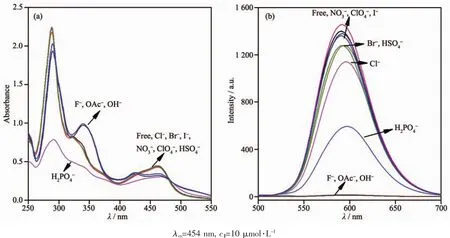
Fig.4 Changes in UV-Vis absorption spectra (a)and emission spectra (b)of 1 in CH3CN upon addition of 10 equiv.anions
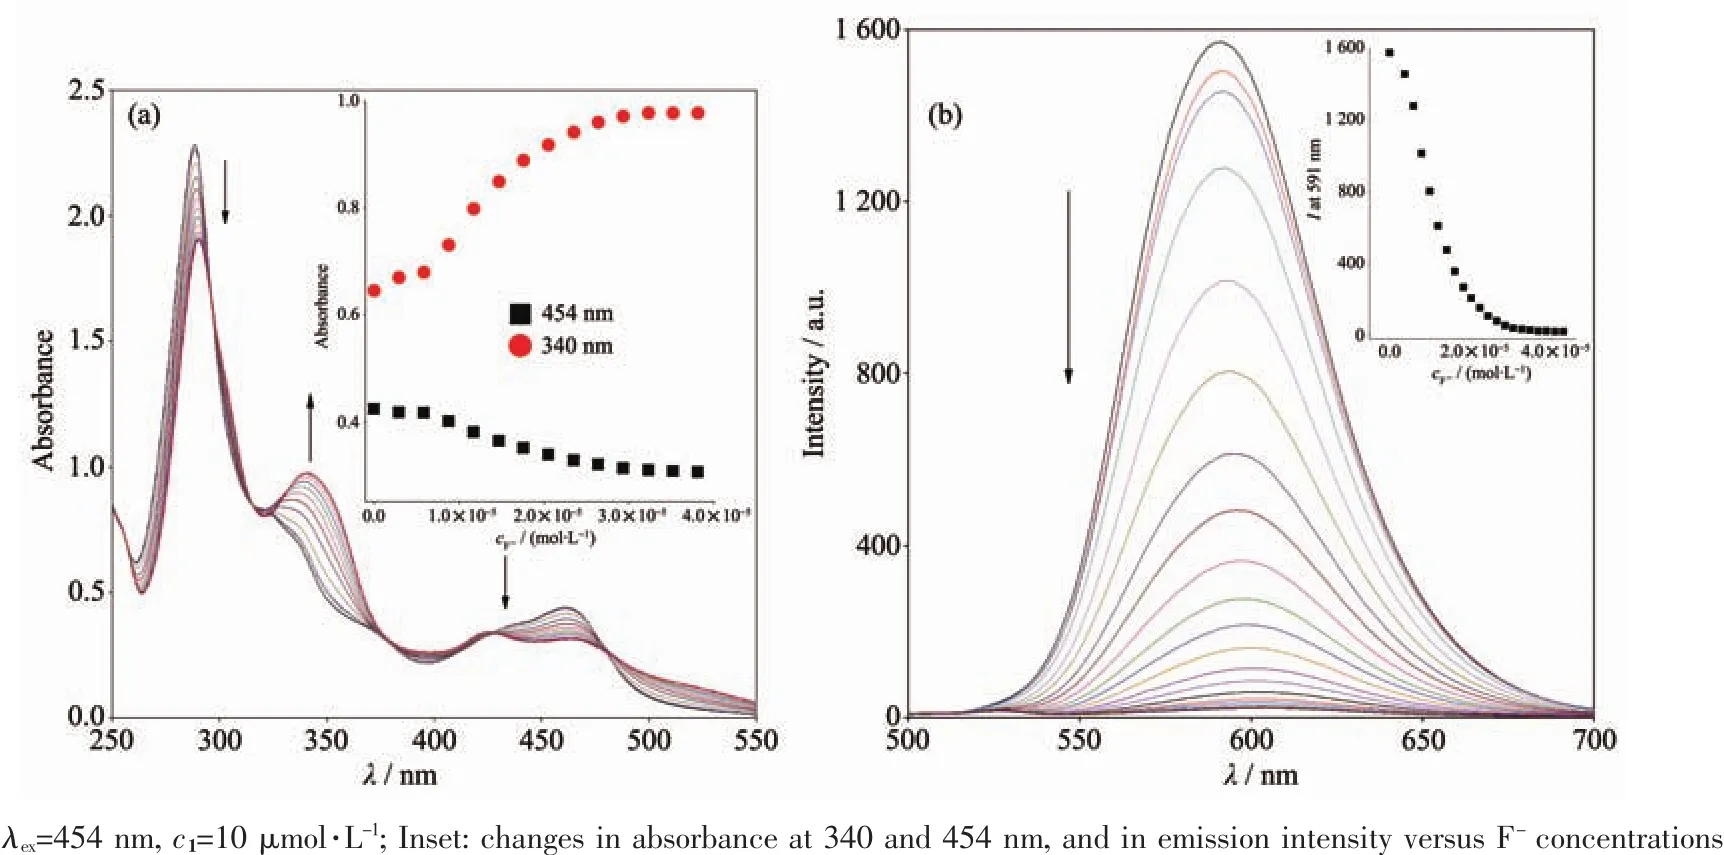

Fig.6 Time-resolved luminescence decay profiles of 1 in acetonitrile in the presence of 0,0.6,1.5 and 3.0 equiv.of OAc-
The interaction of 1 with F-and OAc-was also investigated using the time-resolved luminescence technique.The time-resolved luminescentdecay profiles of 1 as a function of the F-and OAc-concentrations are shown in Fig.6.The free probe 1 in acetonitrile at room temperature exhibited singleexponentialluminescence decay with lifetime of(151.3±0.14)ns.In the presence of 0.6,1.5 and 3.0 equiv.of OAc-,the decays in luminescence intensities were still fitted to the single-exponential model with shortened lifetimes of (107.6±0.19),(66.43±0.61)and(27.89±0.37)ns,respectively.In the presence of 3.0 equiv.of F-,the luminescent lifetimes were decreased to (28.2±0.34)ns.These results are in full agreement with the steady-state luminescence measurements,making 1 also a lifetime-based sensor for F-and OAc-.

Fig.7 Partial1H NMR (400 MHz)spectra of 1 (6.6 mmol·L-1)in DMSO-d6in the absence (a)and the presence of 1.0 (b)and 2.0 (c)equiv.of(Bu4N)OAc
To shed light on the nature of the interactions between probe 1 and the anions,1H NMR spectral changes obtained upon the addition of OAc-and F-as tetrabutylammonium salts to the DMSO-d6solution of 1 (6.6×10⁻²mol·L-1)were selectively investigated.As shown in Fig.7,upon addition of 1.0 equiv.OAc-,the signal of N-H proton of the imidazole in 1 becomes invisible,and the signal of two hydroxyl protons in 1 broadened and upfield shift from δ 9.29 to 9.11,suggesting that there are strong interactions between the anions and-NH groups of the imidazole and the hydroxyl protons of calix[4]arene.Meanwhile,aromatic proton signals shift downfield or upfield upon the complexation of 1 with OAc-.As can be seen from Fig.7,upon the addition of 2.0 equiv of OAc-into 1 in DMSO-d6,the Haand Hbpeaks were shifted upfield by Δδ=-0.15 and-0.10,respectively.These shifts are attributed to the deprotonation of the imidazole-NH moiety by OAc-[39],which increases the electron density on the imidazo[4,5-f]-1,10-phenanthroline moiety on 1.The observed downfield shift of the Hd(Δδ=0.05)is attributed to the formation of a O-H…O hydrogen bond with OAc-.The similar behavior was also found for 1 with F-ions (Fig.S9).The upfield shift of the-OH signal is ascribed to the influence of the O-H…O type ofintramolecularhydrogen bondingby the formation of F-H…O or O-H…O intermolecular hydrogen bond.A plausible binding mode of complex 1 for the detection of F-and OAc-are proposed in Fig.S10.But with,the same titration was not successful because of the precipitation of the probe 1 on addition of excess.
2.4 HeLa cell imaging and cytotoxicity
In view of the excellent photophysical properties of the present Ruギ complex,it is propitious for potential applications in biological systems.Herein,the probe 1 was applied to image the HeLa cells by using confocal laser scanning microscopy (CLSM)as shown in Fig.8.After incubation of HeLa cells with 10 μmol·L-1of probe 1 in DMSO/PBS (1∶99,V/V,pH=7.0)for 20 min at 310 K,intense intracellular luminescence was observed upon 455 nm light excitation,as shown in Fig.8a.Bright field measurement after incubation with 1 (Fig.8b)confirmed that the cells were viable throughout the experiments.Overlays of the confocal luminescence and bright field images(Fig.8c) furtherdemonstrates thatthis probe is actually transported into the cellular interior rather than associating solely at the membrane surface as we recently reported for a Ruギ-Reガ heteropolynuclear complex[42].Cytotoxicity was also tested for probe 1 by an MTT assay against HeLa as depicted in Fig.S11.Upon incubation with 1 (10 μmol·L-1)for 24 h,only less than 4%of the HeLa cells died;even when the concentration of 1 was increased to 60 μmol·L-1,the cell viability still remained above 85%.This result showed that probe 1 is suitable for the cell image over a wide drug concentration range that will not destroy the cell being probed.
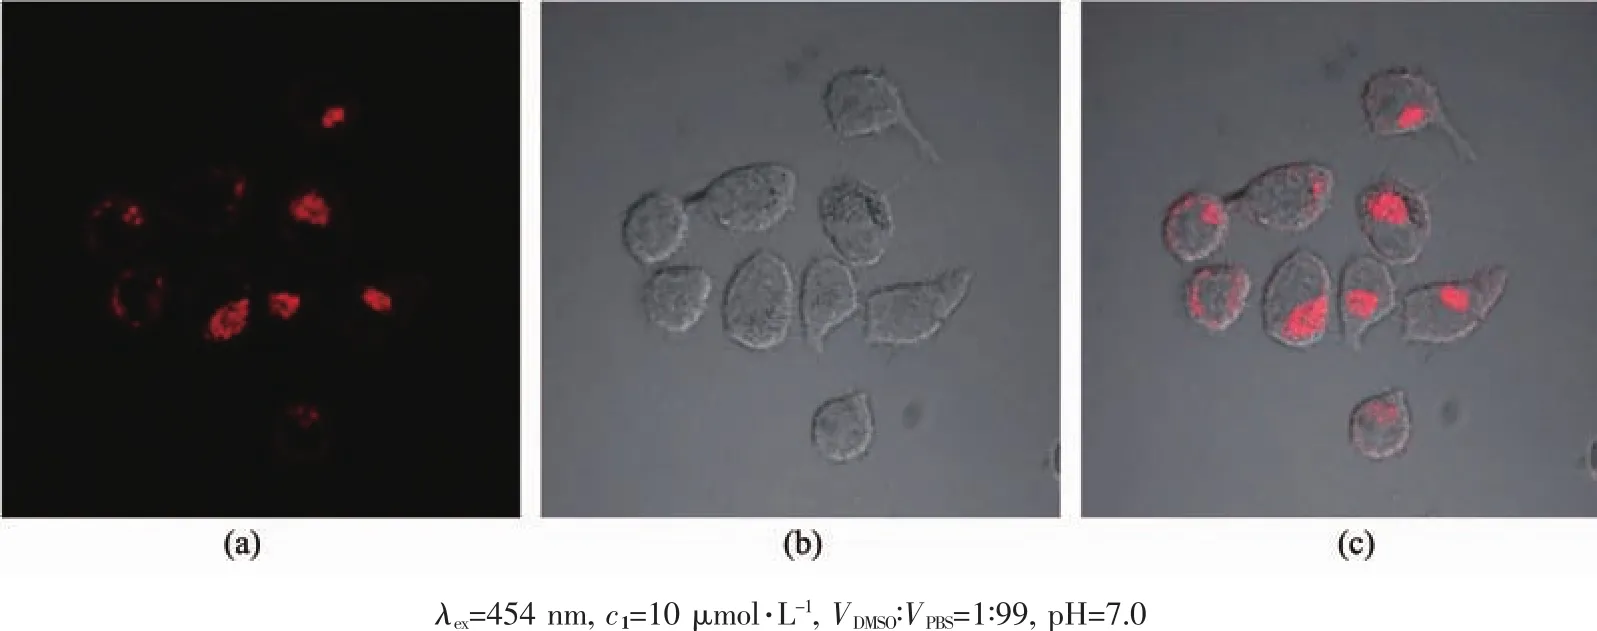
Fig.8 Confocal luminescence (a),bright field (b),and overlay (c)image of living HeLa cells incubated with 1 in DMSO-PBS for 20 min at 310 K
3 Conclusions
In this work,a novel calix[4]arene-based rutheniumギ complex,denoted as 1,is synthesized and characterized.Probe 1 was evidenced by spectrophotometric pH titrations to be a sensitive pH-induced“off-on-off” luminescence switching probe with a maximum emission on-off ratio of 96 over a pH value range of 4.00~12.00.Interestingly,there was a good linearity between emission intensity and pH value in the physiological pH value region.The anion-interaction properties of 1 were also thoroughly investigated in CH3CN solution by absorption,emission,and1H NMR spectroscopic techniques. These analyses revealed that 1 acts as an efficient“turn off” emission sensor for F-and OAc-.Time-resolved photoluminescence decays were also measured for 1 to test its viability as a lifetime-based pH value switch and anions sensor.Importantly,the grafting functionalized calix[4]arene fragment to rutheniumギ polypyridyl complex makes 1 exhibit good HeLa cell imaging property with low cytotoxicity.In view of intriguing pH value and anions sensing properties of 1,it is interesting to explore the possibility of using complex 1 in bioimaging of pH value or anions.
Supporting information is available at http://www.wjhxxb.cn
[1]Han J,Burgess K.Chem.Rev.,2010,110:2709-2728
[2]Belyustin A A.J.Solid State Electrochem.,2011,15:47-65
[3]Xiong H,Wang W,Liang J,et al.Sens.Actuators B:Chem.,2017,239:988-992
[4]Xu X Y,Yan B.Dalton Trans.,2016,45:7078-7084
[5]Wang X D,Meier R J,Wolfbeis O S.Angew.Chem.Int.Ed.,2013,52:406-409
[6]LI Jing(李静),ZHU Cheng-Cheng(朱成成),HE Wei-Jiang(何卫 江 ).Chinese J.Inorg.Chem.(无 机 化 学 学 报 ),2013,29(12):2528-2534
[7]Wang W J,Xia J M,Feng J,et al.J.Mater.Chem.B,2016,4:7130-7137
[8]Fu Y,Zhang J,Wang H,et al.Dyes Pigm.,2016,133:372-379[9]Lee S,Chen X Y.ChemBioChem,2011,12:2120-2121
[10]Derfus A M,Chan W C W,Bhatia S N.Adv.Mater.,2004,16:961-966
[11]Grusenmeyer T A,Chen J,Jin Y H,et al.J.Am.Chem.Soc.,2012,134:7497-7506
[12]Zhao Q,Li F Y,Huang C H.Chem.Soc.Rev.,2010,39:3007-3030
[13]Ma Y,Liang H,Zeng Y,et al.Chem.Sci.,2016,7:3338-3346
[14]Alreja P,Kaur N.RSC Adv.,2016,6:23169-23217
[15]Chang K C,Sun S S,Odago M O,et al.Coord.Chem.Rev.,2015,284:111-123
[16]Sharma H,Guadalupe H J,Narayanan J,et al.Anal.Methods,2013,5:3880-3887
[17]Rajendiran V,Palaniandavar M,Periasamy V S,et al.J.Inorg.Biochem.,2010,104:217-220
[18]Liu P,Wu B Y,Liu J,et al.Inorg.Chem.,2016,55:1412-1422
[19]Xu W,Zuo J,Wang L,et al.Chem.Commun.,2014,50:2123-2125
[20]Martin A,Byrne A,Burke C S,et al.J.Am.Chem.Soc.,2014,136:15300-15309
[21]Xu L,Liu Y Y,Chen L M,et al.J.Inorg.Biochem.,2016,159:82-88
[22]Joseph R,Rao C P.Chem.Rev.,2011,111:4658-4702
[23]Nimse S B,Kim T.Chem.Soc.Rev.,2013,2:366-386
[24]Wu J Z,Li L,Zeng T X,et al.Polyhedron,1997,16:103-107
[25]Chawla H M,Pant N,Srivastava B,et al.Org.Lett.,2006,8:2237-2240
[26]Sullivan B P,Salmon D J,Meyer T J.Inorg.Chem.,1978,17:3334-3341
[27]Houten J V,Watts R J.J.Am.Chem.Soc.,1976,98:4853-4858
[28]Li Q,Guo Y,Xu J,et al.J.Photochem.Photobiol.,B,2011,103:140-144
[29]Huang W W,Lin H,Cai Z S,et al.Talanta,2010,81:967-971
[30]Civitello E R,Dragovich P S,Karpisb T B,et al.Inorg.Chem.,1993,32:237-241
[31]Zheng Z B,Kang S Y,Zhao Y,et al.Sens.Actuators B:Chem.,2015,221:614-624
[32]Zheng Z B,Kang S Y,Yi X,et al.J.Inorg.Biochem.,2014,141:70-78
[33]Zhao X L,Li Z S,Zheng Z B,et al.Dalton Trans.,2013,42:5764-5777
[34]Lobello M G,Fantacci S,Credi A,et al.Eur.J.Inorg.Chem.,2011:1605-1613
[35]Cheng F,Tang N,Chen J,et al.Sens.Actuators B:Chem.,2012,171-172:102-109
[36]Gao F,Chen X,Sun Q,et al.Inorg.Chem.Commun.,2012,16:25-27
[37]Vos J G.Polyhedron,1992,11:2285-2299
[38]Liu Y,Li Z,Zhang H Y,et al.Supramol.Chem.,2008,20:419-426
[39]Zheng Z B,Duan Z M,Ma Y Y,et al.Inorg.Chem.,2013,52:2306-2316
[40]Das S,Saha D,Bhaumik C,et al.Dalton Trans.,2010,39:4162-4169
[41]Bhaumik C,Saha D,Das S,et al.Inorg.Chem.,2011,50:12586-12600
[42]Zheng Z B,Wu Y Q,Wang K Z,et al.Dalton Trans.,2014,43:3273-3284
