A unifying approach in simulating the shot peening process using a 3D random representative volume finite element model
2017-11-20DinyinHUGAOFnchoMENGJunSONGYniWANGMngxiRENRongqioWANG
Dinyin HU,Y GAO,Fncho MENG,Jun SONG,*,Yni WANG,Mngxi REN,Rongqio WANG,*
aSchool of Energy and Power Engineering,Beihang University,Beijing 100083,China
bCollaborative Innovation Center of Advanced Aero-Engine,Beijing 100083,China
cBeijing Key Laboratory of Aero-Engine Structure and Strength,Beijing 100083,China
dMining and Materials Engineering,McGill University,Montreal,QC H3A 0C5,Canada
eExperimental School of Beihang University,Beijing 100083,China
fSchool of Automation Science and Electrical Engineering,Beihang University,Beijing 100083,China
A unifying approach in simulating the shot peening process using a 3D random representative volume finite element model
Dianyin HUa,b,c,Ye GAOa,Fanchao MENGd,Jun SONGd,*,Yanfei WANGe,Mengxi RENf,Rongqiao WANGa,b,c,*
aSchool of Energy and Power Engineering,Beihang University,Beijing 100083,China
bCollaborative Innovation Center of Advanced Aero-Engine,Beijing 100083,China
cBeijing Key Laboratory of Aero-Engine Structure and Strength,Beijing 100083,China
dMining and Materials Engineering,McGill University,Montreal,QC H3A 0C5,Canada
eExperimental School of Beihang University,Beijing 100083,China
fSchool of Automation Science and Electrical Engineering,Beihang University,Beijing 100083,China
Using a modified 3D random representative volume(RV) finite element model,the effects of model dimensions(impact region and interval between impact and representative regions),model shapes(rectangular,square,and circular),and peening-induced thermal softening on resultant critical quantities(residual stress,Almen intensity,coverage,and arc height)after shot peening are systematically examined.A new quantity,i.e.,the interval between impact and representative regions,is introduced and its optimal value is first determined to eliminate any boundary effect on shot peening results.Then,model dimensions are respectively assessed for all model shapes to re flect the actual shot peening process,based on which shape-independent critical shot peening quantities are obtained.Further,it is found that thermal softening of the target material due to shot peening leads to variances of the surface residual stress and arc height,demonstrating the necessity of considering the thermal effect in a constitutive material model of shot peeing.Our study clarifies some of the finite element modeling aspects and lays the ground for accurate modeling of the SP process.
©2016 Chinese Society of Aeronautics and Astronautics.Production and hosting by Elsevier Ltd.This is an open access article under the CC BY-NC-NDlicense(http://creativecommons.org/licenses/by-nc-nd/4.0/).
1.Introduction
Shot peening(SP)is one effective cold-working surface treatment employed in numerous engineering applications1to improve fatigue strength of metallic materials.In this process,numerous small round particles are blasted against the surface of a metallic component,where a particle is generally much stiffer than the component being treated and thus acts like a peen-hammer to create an impacting region of sizable localized plastic deformation.SP induces compressive residual stress(CRS)beneath the surface of the treated component2to resist crack nucleation and growth,thus enhancing the fatigue strength.3The resultant CRS field from SP can then be measured via experimental methods such as X-ray diffraction(XRD).4Besides the CRS field,in industries,the effectiveness of the SP process is often assessed by two other quantities,i.e.,Almen intensity5,6and SP coverage.7For instance,Sabelkin et al.8found that the improvement of the fretting fatigue life of titanium alloy Ti-6Al-4V was directly correlated with the increase of Almen intensity.Barrie et al.9reported that surface inclusion cracking could be suppressed under the conditions of a high Almen intensity and a low SP coverage,therefore resulting in an improved fatigue life of superalloy Udimet 720.Numerical simulation using the finite-element(FE)method is frequently adopted to study the SP process.10–13FE modeling provides a predictive tool to quickly and quantitatively analyze the deformation states and CRS field in the SP process,without conducting expensive and time-consuming(sometimes even destructive or semi-destructive)experiments.It also allows quick assessment of the roles of different processing parameters involved in the inherently complex SP process.
In early FE efforts for modeling the SP process,only limited work has been reported to predict Almen intensity and SP coverage due to the inherent complexity of the SP process,which involves numerous factors and peening parameters.In addition,the incoming particles neither are uniformly distributed in spacenor follow a predetermined shooting sequence.14–17Therefore,it is necessary to account for the randomness ofimpacting shots in order to realistically predict a resultant residual stress profile and its relation with the Almen intensity and SP coverage.18–20An actual SP process normally involves a substantial number of shots(>105)that land randomly on the targeted surface.To this end,recent FE studies7,21–23have utilized random 3D representative volume(RV)models.For instance,Miao et al.21proposed a rectangular prism RV model,in which all shots,randomly distributed,were directed toward a square impact region.The Almen intensity and SP coverage were then evaluated from the deformation states of an inner portion of the square region.Garie´py et al.7later employed an improved 3D random RV model based on the one proposed by Miao et al.21,by involving the Rayleigh damping of the region surrounding the impact region to reduce stress oscillations,and considered samples of different thicknesses.In another study by Gangaraj et al.22,a cylindrical random RV model with a circular impact region was constructed.In this work,the impact region was not differentiated from the representative region and the focus was on the development of a coverage profile instead of Almen intensity.Additionally,the thickness of such a cylindrical random RV model was set to be very large,e.g.,equal to 6R(Rbeing the radius of the shot),which failed to reflect the actual situation in industries where thinner samples,e.g.,a 1.29 mm(≈3.2Rin their case)thick A-type Almen strip,have been more commonly used.24
To ensure reliable evaluation of peening factors such as residual stresses profile,Almen intensity,and SP coverage from multiple-shot 3D random RV FE simulations,it is important to properly partition the simulation cell(e.g.,defining the impact and representative regions).7,22Nonetheless,so far the partition was done on anad-hocbasis without a systematic criterion.Additionally,in previous works22,25–27,the constitutive material model was prescribed by isotropic hardening laws without considering the temperature effect,to literally follow a ‘cold-working’process.However,Iida and Tosha28investigated the work-softening effect on shot-peened steel,and observed that excessive shot peening resulted in softening of the surface layer.
Due to so many contradictions between present FE modeling methods and experiments,in the present study,we examined the influences of the dimension and shape of a 3D random RV model on FE simulation of the SP process,and clarified the criterion in partitioning the simulation cell.This paper is organized as follows:Firstly,a random multipleimpact 3D RV FE model was constructed.Simulations were then performed to study the SP process with the Johnson-Cook plasticity model employed to prescribe the deformation response of the peened material.Secondly,the resultant peening parameters including residual stress,Almen intensity,and SP coverage,were evaluated,and their dependences on the dimension and shape of the 3D random RV model were systematically examined.Finally,the temperature effect and peening-induced softening were discussed.
2.Random multiple-impact 3D RV FE model
2.1.Model set-up and parameterization
In our study,3D random RV FE simulations were performed to study the SP of an A-type Almen strip,which has been commonly used in industries24and has dimensions of 76 mm×19 mm×1.29 mm.The material is SAE 1070 spring steel in reference to SAE J442 standard.29The elastic response of the material is assumed to be isotropic while its plastic response is prescribed by the Johnson-Cook plasticity model30which considers the strain rate and temperature dependence of material behaviors as:
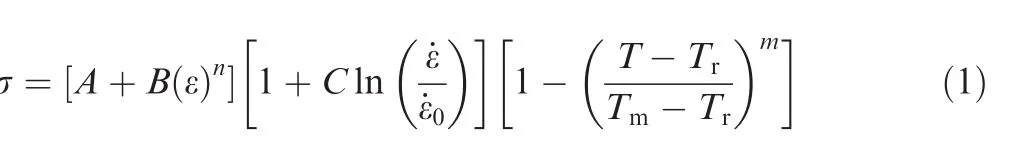
where σ is the flow stress, ε is the equivalent plastic strain(PEEQ)and in which˙εplis the plastic strain rate andtis the loading time,˙ε0is the reference strain rate,Tis the applied temperature,Tris the reference temperature,andTmis the melting temperature.A,B,C,n,andmare material constants.The Johnson-Cook parameters27and material constants such as elasticity modulusE,Poisson’s ratio υ,and density ρ corresponding to SAE 1070 steel are listed in Table 1.Rigid spherical shots are assumed given their high yield and hardness values compared to those of the target material.21All shots have a diameterd=1.0 mm and a veloc-ityv=70 m/s,with corresponding material properties also shown in Table 1.
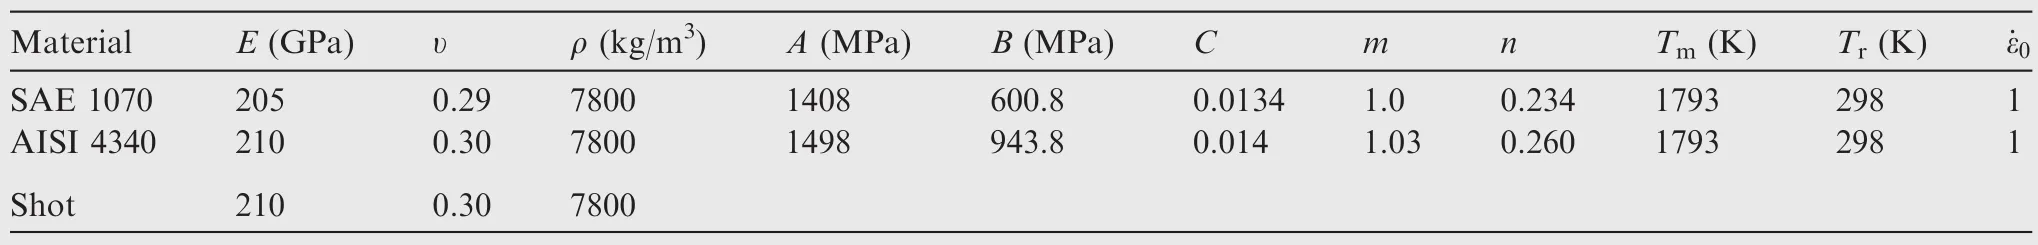
Table 1 Relevant material constants and parameters used in the Johnson-Cook model.
Two classes of RV models with two different representative surfaces,i.e.,rectangular and circular,are considered,which are illustrated in Fig.1 and referred to as RRV and CRV below.Each model consists offour regions(see Fig.1),among which Region 3 is the fine-mesh impact region containing all impingement centers.Region 4,enclosed in Region 3,is the representative region where the Almen intensity,coverage profile,and induced stress profile are evaluated.Region 2 is a coarse-mesh area with gradient meshes outside Region 3.In addition,there is an outmost region,namely Region 1,with infinite elements adopted to prevent stress reflection from model boundaries,which serves a similar purpose as the Rayleigh damping used in previous studies.7,22
The region where the shots are directed to,i.e.,Region 3,is specified bya(width)andb(length),andr(radius)for RRV and CRV models,respectively.The thicknesshis set as 1.29 mm for all models,in accordance with the commonly used A-type Almen strip.The parameterldenotes the spacing between the boundaries of Region 3 and Region 4.Particularly for the RRV model,two length/width ratios,i.e.,b/a=4 and 1 are used,respectively corresponding to the aspect ratio of the A-type Almen strip and a special case of the impact region being a square.For simplicity,below we denote the case withb/a=1 as a square RV(SRV)model.As pointed out by Garie´py et al.7,the nodes close to the boundaries of the impact region exhibit less permanent stretching and thus can result in an overestimation of the residual stress.To this end,the spacing between the boundaries of Region 3 and Region 4,defined by the intervall,is of particular interest in our study.
The multiple-shot random 3D RV model is constructed using the commercial FE software ABAQUS Explicit 6.11-1.31In order to simulate randomly distributed shots,a PYTHON script is created to generate the random coordinates of each shot.The origin of the coordination system is located at the center of the target top surface,with the negativez-axis directed toward the depth of the target.The coordinates of each shot center are obtained by the following equation:
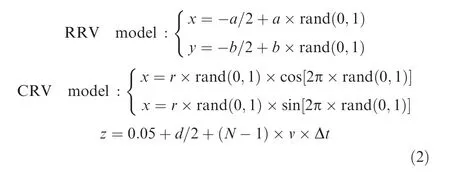
where rand(0,1)is a uniform pseudorandom number generator in the interval[0,1],Nis the number of shots,and Δtis the interval between sequential shot impingements(Δt=3.5× 10⁻⁶s as in Ref.32).Normal impact is considered for the sake of simplicity.
The substrate meshed with 8-node linear brick elements(solid C3D8R in ABAQUS)is constrained for all translational and rotational degrees offreedom at the bottom plane,and the lateral area of the substrate is surrounded by a layer of infinite elements as described above.Reduced integration and hourglass control are used in Region 2 and Region 3 to improve computation efficiency.A fine mesh in Region 3,with a size of 0.05 mm×0.05 mm×0.05 mm,is employed to ensure good convergence.The FE meshes corresponding to the three RV models are illustrated in Fig.2.The contacts between the shots and the top surface of Region 3 are simulated using the penalty algorithm.According to our benchmark calculations and Ref.33,the plastic deformation and residual stresses profile are not influenced by the friction between the shots and the target substrate (for any Coulomb friction coefficient within 0.1<μ<0.5).Thus here we present our results where the friction coefficient is specified as μ=0.3.
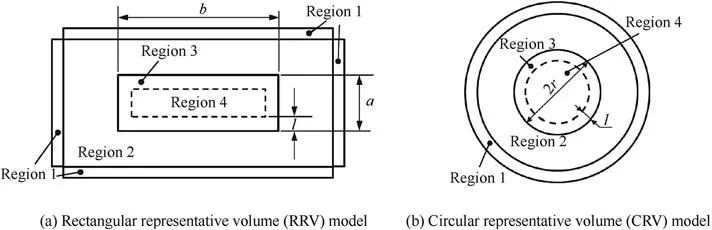
Fig.1 Schematic view of surface regions.
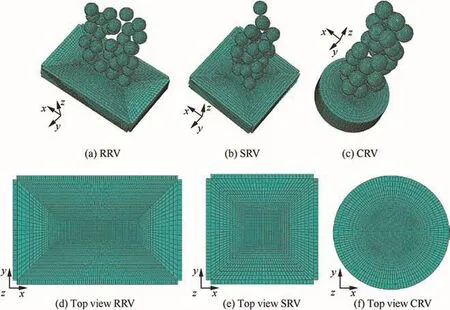
Fig.2 Three random RV FE meshes with only a part of shots shown,and top view meshes of targets.
2.2.Almen intensity
In the process of measuring Almen intensity,a standardized strip,named Almen strip,is fixed to a mounting fixture by means offour roundhead bolts.After being shot-peened,the bolts are removed and the strip will curve toward the peening direction,resulting in a certain arc height.Almen intensity is essentially defined as the arc height of the Almen strip at the saturation time(denoted asts).29tsis determined as the peening time,which if doubled,does not lead to further increase in the arc height by more than 10%.The corresponding arc height attsis then defined as Almen intensity.29Guagliano4proposed a simple and effective method to calculate the arc height based on the residual stress induced by shot peening as follows:
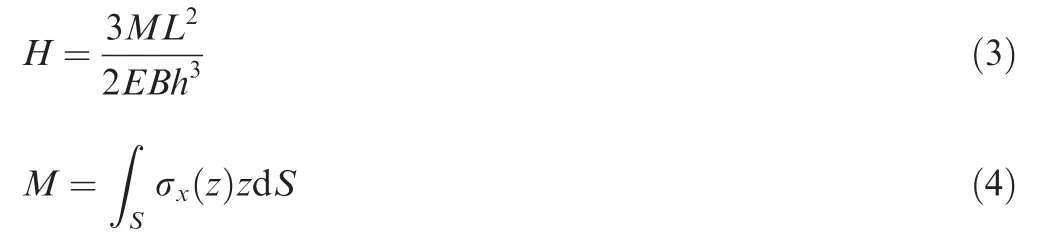
whereHis the arc height,Mis the moment induced by the residual stress,Lis the gauge length andL=31.75 mm,Bis the gauge width andB=19.0 mm,zis the distance between the neutral axis of the Almen strip and the top surface,σx(z)is the residual stress magnitude ofx-direction at thezdistance from the top surface,andSis the area perpendicular to thezaxis.The induced residual stress profile is extracted from Region 4,and averaged over the wholexy-plane at different impacting depths.
3.Results and discussion
3.1.Validation of the proposed model
In order to verify the accuracy of the presented RV model,the in-depth residual stress profile for AISI 4340(see the material properties in Table 1)34is compared with that adopted from the experimental work in Ref.3 S230 shots with a diameterd=0.584 mm were used in the experiments and the Almen intensity was 0.208 mmA3,where mmA is the unit of Almen intensity often used in industries.The numerical results are based on the SRV model witha=2.0dandl=0.15d.As can be seen in Fig.3,a satisfactory agreement between the numerical and experimental results is acquired.The differences could be attributed to the material model,numerical approximation,and measurements.
3.2.Single indentation profile and SP coverage calculation
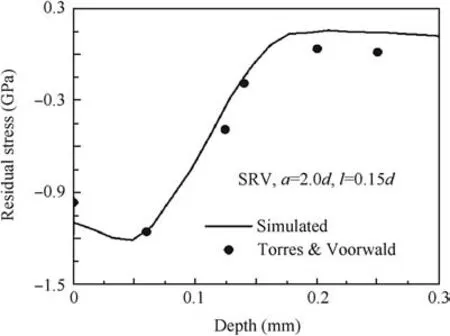
Fig.3 Comparison between the numerical and experimental residual stress profiles for S230 shots and 0.208 mm A3Almen intensity.
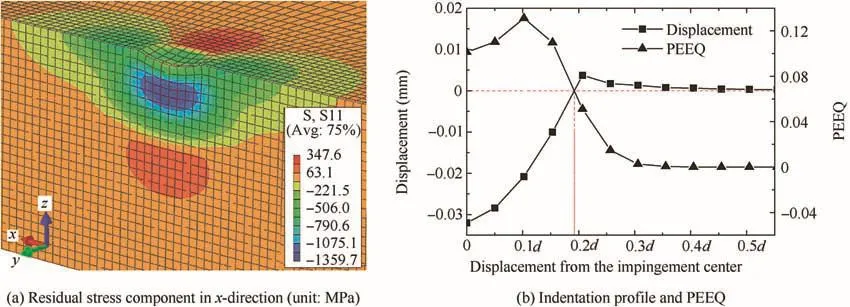
Fig.4 Results after a single impingent.
The resulted stress component inx-direction after a single shot impingement is shown in Fig.4(a).The maximum compressive stress is located beneath the top surface and at a depth of 0.45d.A tensile stress zone can be observed under the compressive residual stress field in order to keep equilibrium.The resulted PEEQ and displacement inz-direction at the top surface starting from the impingement center along the radius direction are shown in Fig.4(b).As seen in Fig.4(b),the magnitude of the surface displacement decreases to zero when moving away from the impingement center.The boundary of indentation is de fined as the location where the displacement first becomes zero.We can see that beyond the indentation boundary,the surface displacement first becomes positive and then gradually decays to zero.The positive surface displacement corresponds to the pile-up of the material induced by the indentation.The boundary of indentation effectively de fines the size(i.e.,diameterd0)of indentation.Based on the above description,we see(from Fig.4(b))that for the material system considered,a single shot impingement results in an indentation size ofd0/2=0.19dwith the corresponding value of PEEQ at the boundary of indentation being 0.061.
According to Ref.21,the SP coverage in numerical simulation is defined as the ratio of the number of nodes with a PEEQ larger than that of the boundary of a single indentation(extracted from a single shot simulation)to the total number of nodes in Region 3.Starting with the pro file of a single shot impingent,we can then employ Avrami equation to estimate the number of random impacts required to reach a full coverage for the multiple shots simulation26:
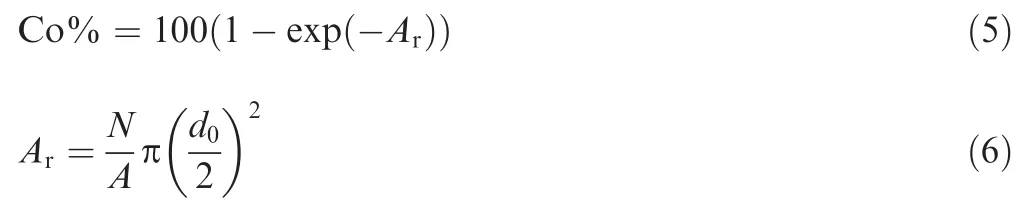
where Co%is the coverage percentage,Aris the ratio of the total indentation area to the target impact area(i.e.,area of Region 3),Nis the number of shots,andAis the area of the impact region.
3.3.Determination of the interval l
With the intensity ofimpact being necessarily lower at the boundary of Region 3 when compared to that at the center,it is crucial to properly determine the size of the intervall.As suggested by Ref.21,the value of PEEQ at a node can be used as an approximate indicator of the impact strength.Inspired by that,we vary the size of the intervallwhile keeping the dimension of Region 3 the same,and examine the averaged PEEQ at the boundary of Region 4.The corresponding results withlranging from 0 to 0.30dfor different models are shown in Fig.5.The horizontal axis is the density of shots,defined as the number of shots(N)divided by the area of Region 3(A).As expected,more shots impacting the target surface,i.e.,an increase ofN/A,leads to more plastic deformation,i.e.,a higher PEEQ.The PEEQ roughly scales linearly withN/A.
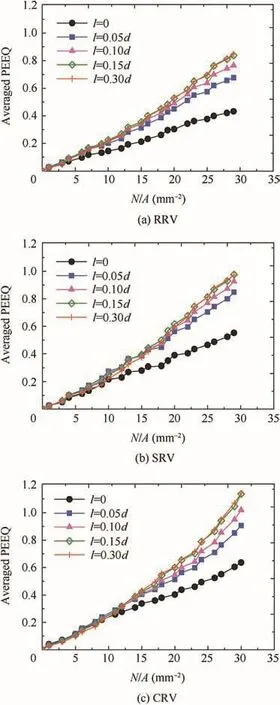
Fig.5 Averaged PEEQ along Region 4 boundary vs shots density,Region 3 and Region 4 being the same with l=0.
However the time evolution of PEEQ is dependent on the choice of the interval sizel.From Fig.5,we see that whenlis small,the slope of the curve increases aslincreases,while the evolution curves of PEEQ coincide with each other whenlis large.This suggests that the intervallneeds to be large enough to avoid underestimation of PEEQ.For all the systems examined,we find that the boundary effect can be eliminated ifl>0.15d.It should be noted that this paper is focused on method study,and onlyd=1.0 mm cases are studied here,although the same approach adopted here can be applied for all shot sizes.
3.4.Determination of model dimensions
The essential idea behind the RV FE simulations of shot peening is that one can represent the whole treated area by a small surface region(in an RV model)whose size is in the order of particle diameter.To ensure that the model well represents the actual SP process,it is important to properly determine the dimension of the RV model.Below we evaluate the roles of model dimensions in RRV,SRV,and CRV models,in terms of the SP coverage,Almen intensity,and residual stress profile.
3.4.1.RRV model dimension
RRV models(b/a=4)of four different dimensions,i.e.,a=0.5d,1.0d,1.5d,and 2.0d,were examined.Fig.6(a)shows the simulated evolution of the SP coverage as a function ofN/A.We see that the SP coverage continues to increase as the density of shots increases,and eventually converges to a full coverage(i.e.,98%).Meanwhile,the evolution of the SP coverage can be predicted using the Avrami equation(see Eqs.(5)and(6)),shown together with those simulated data in Fig.6.The predicted curve is invariant with respect to the model dimension.One thing to note from Fig.6 is that the Avrami equation underestimates the growth of the SP coverage(except for the case ofa=0.5d),thus leading to an overestimation of the impingement number required to achieve a full coverage,which is in agreement with the conclusions reported in Ref.22 In addition,we see that the simulated SP coverage data from different model dimensions mostly coincide with each other whena≥1.0d,which prescribes the minimum model dimension(a=1.0d)needed to obtain a consistent SP coverage evolution from FE simulations.
Meanwhile,the corresponding residual stress profiles within the target such as the surface residual stress(SRS)and the maximum compressive residual stress(MCRS)along with the arc height were also investigated,shown in Fig.6(b)and(d),respectively.Significant scattering in the SRS and MCRS data is observed for the case ofa=0.5d.In addition,at a high shot density(i.e.,N/A>11.0),on average higher magnitudes of the SRS and MCRS are observed for the case ofa=0.5dwhen compared to those of the other cases.This could possibly be attributed to the excessive indentation overlap in the case ofa=0.5d,where the impact centers are constrained in a small area(i.e.,Region 3 of an area beingd2).Thus the observed scattering is a simulation artifact.The scattering in the arc height data is also observed for the case ofa=0.5d,which is expected given the correlation between the arc height and the residual stress.
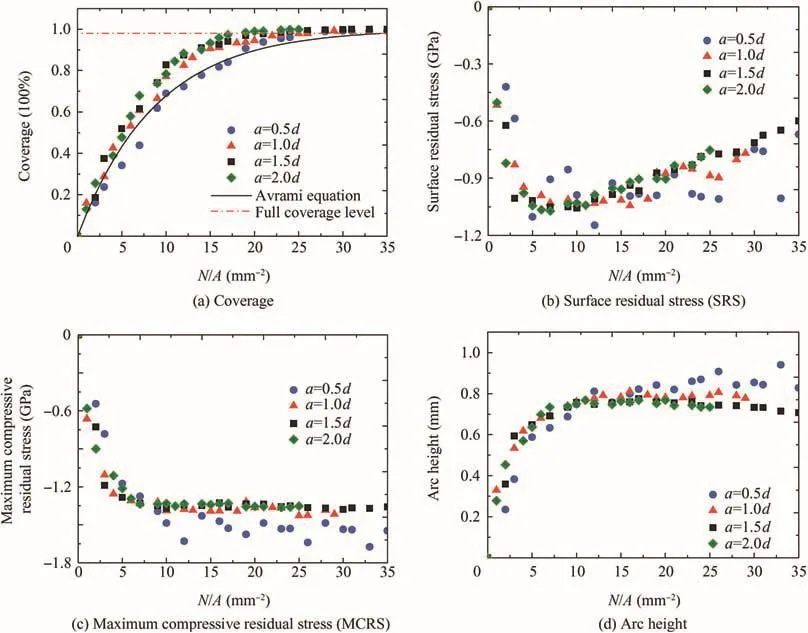
Fig.6 Simulation results of RRV models.
We see from Fig.6 that the scattering in the residual stress and arc height data quickly diminishes asaincreases.The SRS,MCRS,and arc height data become essentially independent of the model dimension whena≥1.5d.Another important observation from Fig.6 is that at largeN/Avalues,the MCRS saturates while the SRS and arc height decrease upon further peening.This decreasing trends in the SRS and arc height can be explained by the temperature effect(i.e.,surface temperature increases are induced by excessive peening and the details are in Section 3.5).In a previous study by Gangaraj et al.22,the convergence of SRS is used as the criterion to evaluate the model dimension for a thermal shot peening process.This criterion is apparently not suitable when the temperature effect is accounted,as in our study.From Fig.6,we see smooth and consistent evolutions of the residual stresses and arc height are achieved whena≥1.5d.Combining this with the criteria we previously obtained from examining the SP coverage(a≥1.0d),we see thata≥1.5dcan be regarded as the condition which the RRV model needs to satisfy in order to reflect the actual shot-peening process.
3.4.2.SRV model dimension
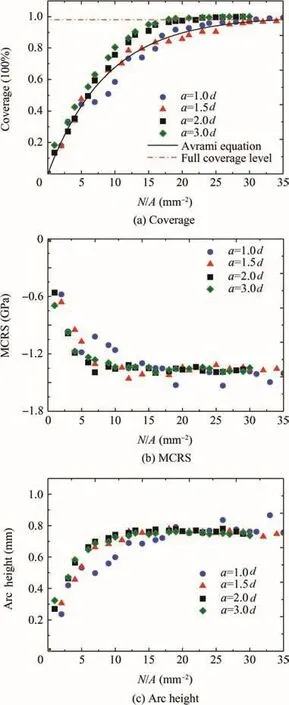
Fig.7 Simulation results of SRV models.
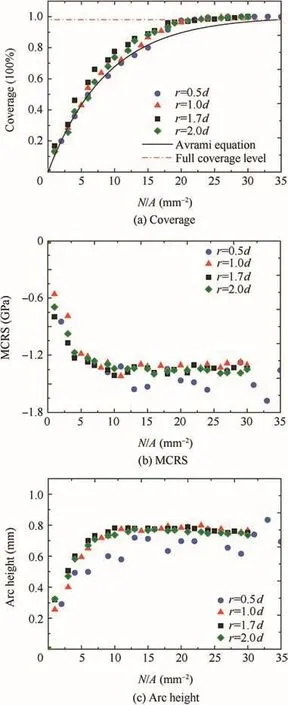
Fig.8 Simulation results of CRV models.
SRV(a=b)models of a series of model dimensions,i.e.,a=1.0d,1.5d,2.0d,and 3.0d,were investigated,with results shown in Fig.7.Similar to what’s previously observed for the RRV model,we see thati)the Avrami equation underestimates the growth of the SP coverage except for cases of small model dimensions(a≤1.5d),andii)there exist relatively large dispersity in the SRS,MCRS,and arc height data whena≤1.0d.For instance,the area of Region 3 is the same fora=1.0din SRV anda=0.5din RRV,and thus the data both show large dispersity,which indicates that the impact region is too small to reflect a realistic SP process.Fig.7(b)shows the MCRS saturates at the same value whena≥1.5 mm,and similar smooth results are observed in Fig.7(c)for the arc height.Therefore,a=1.5dfor the SRV model might be suitable to simulate the SP process if we only consider the MCRS and Almen intensity.This conclusion is in accordance with the conclusion in Ref.7,in which the arc heights at pseudo-saturation were used as the comparison basis for different impact region sizes,and results showed that the impact region sizeI≅1.5dwas large enough to simulate the SP process.However,when the coverage profile is taken into account,the valuea=1.5dcannot be set as the criterion since the data are much smaller than those of the other two cases induced by a relatively smaller impact region area of 2.25d2compared with 4.0d2and 9.0d2,as displayed in Fig.7(a).Consequently,an SRV model with the dimensiona=2.0dis suitable to simulate the development of stress and strain profiles instead ofa=1.5d.
3.4.3.CRV model dimension
The dimension study was also investigated on CRV models withr=0.5d,1.0d,1.7d,and 2.0d.Simulation results are shown in Fig.8,which are similar to those of RRV and SRV models.On a similar note,we can see that for the CRV model,r=1.0dis sufficiently large to simulate the development of stress and strain profiles in the SP process.
3.5.Assessment of the shape effect of the impact region
In previous modeling studies of shot peening,both square4,7,14and circular22impact surfaces were used.Thus it is important to assess the possible influence of surface shape on simulation results,in order to unify different modeling approaches.In this regard,we perform a cross-comparison among the three RV models,i.e.,RRV,SRV,and CRV,in terms of SP coverage,residual stress,and arc height.Based on our previous discussion,we set the respective dimensions of the impact region asa=b/4=1.5dfor RRV,a=b=3dfor SRV,andr=1.7dfor CRV.These choices of dimensions not only satisfy the individual dimension criterion we obtained for each RV model(see Section 3.3 for details),but also ensure the same area of the impact region for these three RV models.
From Fig.9,we see that the data obtained using different RV models always collapse into the same curve.As observed before(in Section 3.3),the Avrami equation underestimates the SP coverage.The MCRS converges at around 1350 MPa(see Fig.9(c)),while the SRS and arc height are maximized atN/A≈8.0 and 14.0,respectively(see Fig.7(b)and(d)),after which they decrease upon further peening.Similar to the result shown in Fig.6(d),the data of the arc height initially increases to a maximum value,and then slightly decreases,which can also be explained by the temperature effect of the Johnson-Cook model in the target block.
In particular for the arc height,it can be fitted as a function ofN/Aas:
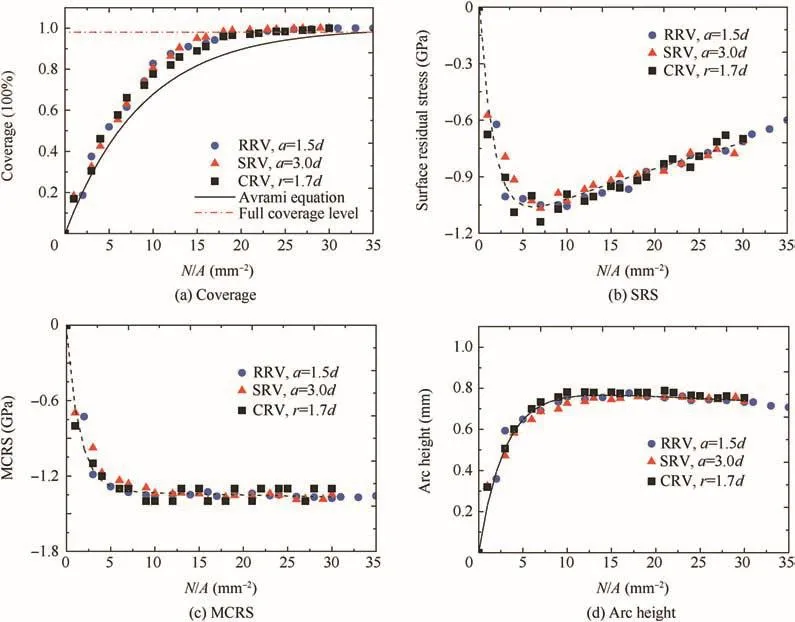
Fig.9 Simulation results for 3 shapes of the impact region.
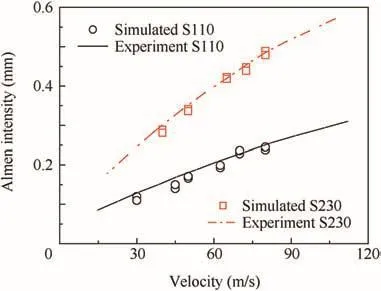
Fig.10 Comparison of numerical and measured Almen intensity values versus velocity curves for S110 shots(d=0.358 mm)and S230(d=0.584 mm).
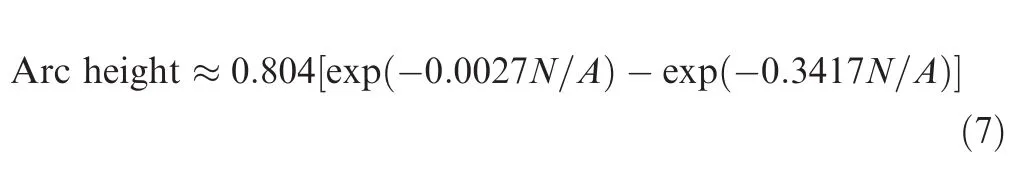
with the correlation coefficient beingR2=0.995.It should be noted that because the arc height is not a monotonic function ofN/A,we adopt a definition of Almen intensity slightly different from the conventional one.29In particular,the Almen intensity is calculated as the arc height reaching 90%of its maximum value,i.e.,0.685 mm atN/A=8.0(see Fig.9(d)).
In order to verify the accuracy of the presented RV model and the definition of Almen intensity,the predicted Almen intensities at different shot sizes and velocities are compared with the curves derived from experimental results(from www.shotpeener.com)in Fig.10(a).Each numerical model is played twice at different random shot sequences.A good agreement between the predicted and experimental values is obtained.Therefore,the proposed numerical approach provided promising results for different shot sizes and velocities.
3.6.Temperature effect on residual stresses profile
As mentioned above,there is noticeable decline in the magnitudes of the SRS and arc height at largeN/Avalues.This can be attributed to the high kinetic energy brought by excessive peening,which increases the temperature of the target surface and subsequently results in thermal softening.It is also well expected from the Johnson-Cook model depicted in Eq.(1),where increasing temperatureTleads to a decrease in the flow stress σ,and consequently an increase in the arithmetical value of SRS.Below we further elaborate on the temperature effect using the CRV model withr=1.7das a representative.Fig.11(a)displays that the temperature at a certain impact surface reaches up to 1083 K at the end of the SP process,which is quite high compared to the melting temperatureTm=1793 K.It is also shown in Fig.11(b)that the averaged value is beyond 550 K within the near surface region(depth to the impact surface is less than 0.075 mm in this study),and then it quickly decreases to 298 K(initial temperature).
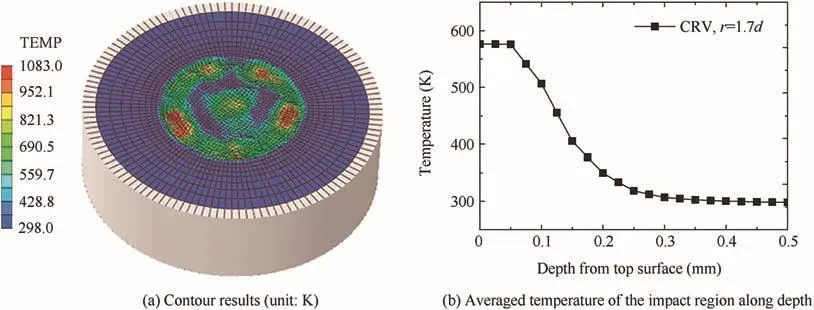
Fig.11 Temperature simulation results at the end of SP simulation for the r=1.7d CRV model.
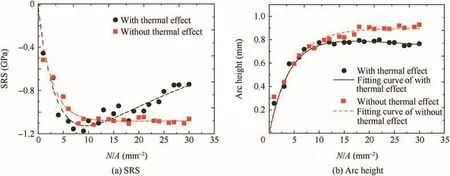
Fig.12 Comparison of FE simulation results with and without the thermal effect.
To further illustrate the influence of temperature,we performed a separate set of FE simulations(using the representative CRV model withr=1.7d)with the thermal effect being neglected,where the neglect of the thermal effect is achieved by using a very large value for the melting temperatureTm(i.e.,here we setTm=1.0×10⁶K).The SRS and arc height data are compared to the previously obtained ones in Fig.12.We see from Fig.12 that when the thermal effect is ignored,both the SRS and arc height become monotonic functions ofN/A,and eventually reach convergence at largeN/Avalues.When the temperature effect is considered,it is not surprising that an increase in temperature would cause a decrease in the SRS magnitude and arc height according to Eqs.(1),(3)and(4).These simulation results might be in accordance with the long time peening deterioration phenomenon described in Refs.35,36 Therefore,in the pursuit of a realistic SP simulation process,the temperature effect might be an important factor that needs to be considered.
4.Conclusions
In summary,a modified 3D random representative volume(RV)finite element(FE)model is developed for analyzing the shot peening(SP)process,by introducing a new region with infinite elements to prevent stress reflection at the model boundaries,and by implementing an interval between the impact and representative regions to eliminate the boundary effect on shot peening results.A comprehensive study is first performed to determine the optimum interval,based on which the effects of model dimensions and shapes of impact regions for three models[rectangular RV(RRV),square RV(SRV),and circular RV(CRV)]as well as the temperature rise in the target block are evaluated.The contributions of this study are summarized as follows:
(1)The critical interval between the impact and representative regions is 0.15dwithdbeing the size of the shot,beyond which the boundary effect on the resultant shot peening results is negligible.
(2)The suitable dimensions of the impact regions for RRV,SRV,and CRV models are determined to bea=b/4=1.5d,a=b=2.0d,andr=1.0d,respectively,to reflect a real SP process,whereaandbare the height and length of the impact regions for RRV and SRV models whileris the radius of the impact region for the CRV model.
(3)Based on the above dimensions of the impact regions,shape-independent results of the SP coverage,arc height,surface residual stress(SRS),and max-compressive residual stress(MCRS)are obtained.However,thea=1.5dRRV model necessitates the largest area of Region 3,which is computationally costly.Therefore,SRV or CRV models are recommended.Overall,the proposed methodology is in good agreement with experimental data at different shot sizes and velocities.
(4)Although SP is literally called a ‘cold-working’process,thermal softening in the target surface due to peening may cause a decrease in the residual stress and a subsequent decrease of the arc height with an increase of the number of shots.Consequently,a constitutive material model considering thermal softening should be employed for situations when long peening time or over-peening occurs.
Acknowledgements
D.Hu greatly thanks the financial support from China Scholarship Council(CSC)(No.201406025083),National Natural Science Foundation of China(NSFC)(Nos.51305012 and 51675024),and Aviation Science Fund of China(No.2014ZB51).R.Wang acknowledges financial support from NSFC(No.51375031).J.Song acknowledges financial support from NSFC(No.51628101),McGill Engineering Doctoral Award,and National Sciences and Engineering Research Council(NSERC)Discovery grant(No.RGPIN 418469-2012).
1.Kobayashi M,Matsui T,Murakami Y.Mechanism of creation of compressive residual stress by shot peening.Int J Fatigue1998;20(5):351–7.
2.Al-Obaid YF.Three-dimensional dynamic finite element analysis for shot-peening mechanics.Comput Struct1990;36(4):681–9.
3.Torres MAS,Voorwald HJC.An evaluation of shot peening,residual stress and stress relaxation on the fatigue life of AISI 4340 steel.Int J Fatigue2002;24(8):877–86.
4.Guagliano M.Relating Almen intensity to residual stresses induced by shot peening:A numerical approach.J Mater Process Technol2001;110(3):277–86.
5.Cao W,Fathallah R,Castex L.Correlation of Almen arc height with residual stresses in shot peening process.Mater Sci Technol1995;11(9):967–73.
6.Almen JO,Black PH.Residual stresses and fatigue in metals.New York:McGraw-Hill;1963.
7.Garie´py A,Larose S,Perron C,Le´vesque M.Shot peening and peen forming finite element modelling–Towards a quantitative method.Int J Solids Struct2011;48(20):2859–77.
8.Sabelkin V,Martinez SA,Mall S,Sathish S,Blodgett MP.Effects of shot-peening intensity on fretting fatigue crack-initiation behaviourofTi–6Al–4V.FatigueFractEngMaterStruct2005;28(3):321–32.
9.Barrie RL,Gabb TP,Telesman J,Kantzos PT,Prescenzi A,Biles T,et al.Effectiveness of shot peening in suppressing fatigue cracking at non-metallic inclusions in Udimet 720.Mater Sci Eng A2008;474(1–2):71–81.
10.Al-Hassani STS,Kormi K,Webb DC.Numerical simulation of multiple shot impact.Proceedings of ICSP-7;Warsaw,Poland.1999.p.217–27.
11.Schwarzer J,Schulze V,Vohringer O.Finite element simulation of shot peening-a method to evaluate the influence of peening parameters on surface characteristics.Proceedings of ICSP-8;Munich,Germany.2002.p.507–15.
12.Klemenz M,Hochrainer T,Delonnoy L,Schulze V,Vohringer O,Gumbsch P.Similarity rules for the shot peening process based on finite element simulations.Proceedings of ICSP-9;Paris,France.2005.
13.Klemenz M,Schulze V,Rohr I,Lo¨he D.Application of the FEM for the prediction of the surface layer characteristics after shot peening.J Mater Process Technol2009;209(8):4093–102.
14.Kim T,Lee H,Jung S,Haeng J.A 3D FE model with plastic shot for evaluation of equi-biaxial peening residual stress due to multiimpacts.Surf Coat Technol2012;206(13):3125–36.
15.Majzoobi GH,Azizi R,Alavi Nia A.A three-dimensional simulation of shot peening process using multiple shot impacts.J Mater Process Technol2005;164–165:1226–34.
16.Meguid SA,Shagal G,Stranart JC.3D FE analysis of peening of strain-rate sensitive materials using multiple impingement model.Int J Impact Eng2002;27(2):119–34.
17.Wang JM,Liu FH,Yu F,Zhang G.Shot peening simulation based on SPH method.Int J Adv Manuf Technol2011;56(5–8):571–8.
18.Kang X,Wang T,Platts J.Multiple impact modelling for shot peening and peen forming.Proc Inst Mech Eng Part B J Eng Manuf2010;224(5):689–97.
19.Schiffner K,Helling C.Simulation of residual stresses by shot peening.Comput Struct1999;72(1):329–40.
20.Frija M,Hassine T,Fathallah R,Bouraoui C,Dogui A.Finite element modelling of shot peening process:prediction of the compressive residual stresses,the plastic deformations and the surface integrity.Mater Sci Eng A2006;426(1–2):173–80.
21.Miao HY,Larose S,Perron C,Le´vesque M.Advances in engineering software on the potential applications of a 3D random finite element model for the simulation of shot peening.Adv Eng Softw2009;40(10):1023–38.
22.Gangaraj SMH,Guagliano M,Farrahi GH.Surfaceamp;coatings technology:an approach to relate shot peening finite element simulation to the actual coverage.SurfCoatTechnol2014;243:39–45.
23.Bagherifard S,Ghelichi R,Guagliano M.Mesh sensitivity assessment of shot peening finite element simulation aimed at surface grain refinement.Surf Coatings Technol2014;243:58–64.
24.Yang ZR,Park JS,Lee Y.A strip holding system for finite element simulation of Almen striptesting.J Mech Sci Technol2014;28(7):2825–30.
25.Rouhaud E,Ouakka A,Ould C,Chaboche JL,Francois M.Finite elements model of shot peening,effects of constitutive laws of the material.Proceedings of ICSP-9;Paris,France.2005.p.107–12.
26.Bagherifard S,Ghelichi R,Guagliano M.A numerical model of severe shot peening(SSP)to predict the generation of a nanostructured surface layer of material.Surf Coatings Technol2010;204(24):4081–90.
27.Bhuvaraghan B,Srinivasan SM,Maffeo B.Numerical simulation of Almen strip response due to random impacts with strain-rate effects.Int J Mech Sci2011;53(6):417–24.
28.Iida K,Tosha K.Fatigue strength and residual stress distribution of the work-softened steel by shot peening.Proceedings ICSP-4.Tokyo,Japan.1990.p.234–42.
29.Society of Automotive Engineers Inc.,Test strip,holder and gage for shot peening;2004.Report No:SAE J442.
30.Johnson GR,Cook WH.Fracture characteristics of three metals subjected to various strains,strain rates,temperatures and pressures.Eng Fract Mech1985;21(1):31–48.
31.Dassault Inc.ABAQUS 6.11-1.2012.
32.Chen Z,Yang F.Realistic finite element simulations of arc-height development in shot-peened almen strips.J Eng Mater Technol2014;136:041002.
33.Meo M,Vignjevic R.Finite element analysis of residual stress induced by shot peening process.Adv Eng Softw2003;34(9):569–75.
34.Banerjee B.The mechanical threshold stress model for various tempers of AISI 4340 steel.Int J Solids Struct2007;44(3–4):834–59.
35.Bagherifard S,Ghelichi R,Guagliano M.On the shot peening surface coverage and its assessment by means offinite element simulation:a critical review and some original developments.Appl Surf Sci2012;259:186–94.
36.Kirk D.Development,measurement,control and significance.Shot Peen2002;16(3):33–6.
15 July 2016;revised 5 September 2016;accepted 12 September 2016
Available online 21 December 2016
*Corresponding authors at:School of Energy and Power Engineering,Beihang University,Beijing 100083,China(R.WANG).
E-mail addresses:jun.song2@mcgill.ca(J.SONG),wangrq@buaa.edu.cn(R.WANG).
Peer review under responsibility of Editorial Committee of CJA.
Production and hosting by Elsevier
http://dx.doi.org/10.1016/j.cja.2016.11.005
1000-9361©2016 Chinese Society of Aeronautics and Astronautics.Production and hosting by Elsevier Ltd.
This is an open access article under the CC BY-NC-ND license(http://creativecommons.org/licenses/by-nc-nd/4.0/).
Almen intensity;
Boundary effect;
Finite element modeling;
Residual stress;
Shot peening
杂志排行

CHINESE JOURNAL OF AERONAUTICS的其它文章
- Wake structure and similar behavior of wake profiles downstream of a plunging airfoil
- Self-sustained oscillation for compressible cylindrical cavity flows
- Numerical studies of static aeroelastic effects on grid fin aerodynamic performances
- A new vortex sheet model for simulating aircraft wake vortex evolution
- Linear stability analysis of interactions between mixing layer and boundary layer flows
- Aerodynamic multi-objective integrated optimization based on principal component analysis