Self-sustained oscillation for compressible cylindrical cavity flows
2017-11-20KungMingCHUNGKuanHuangLEEKehChinCHANG
Kung-Ming CHUNG,Kuan-Huang LEE,Keh-Chin CHANG
aAerospace Science and Technology Research Center,National Cheng Kung University,Tainan 711,China
bDepartment of Aeronautics and Astronautics,National Cheng Kung University,Tainan 701,China
Self-sustained oscillation for compressible cylindrical cavity flows
Kung-Ming CHUNGa,*,Kuan-Huang LEEb,Keh-Chin CHANGb
aAerospace Science and Technology Research Center,National Cheng Kung University,Tainan 711,China
bDepartment of Aeronautics and Astronautics,National Cheng Kung University,Tainan 701,China
The presence of a cavity changes the mean and fluctuating pressure distributions.Similarities are observed between a cylindrical cavity and a rectangular cavity for a compressible flow.The type of cavity flow field depends on the diameter-to-depth ratio and the length-to-depth ratio.The feedback loop is responsible for the generation of discrete acoustic tones.In this study,the selfsustained oscillation for a compressible cylindrical cavity flow was investigated experimentally.For open-type cavities,the power spectra show that the strength of resonance depends on the diameterto-depth ratio(4.43–43.0)and the incoming boundary layer thickness-to-depth ratio(0.72–7.0).The effective streamwise length is used as the characteristic length to estimate the Strouhal number.At higher modes,there is a large deviation from Rossiter’s formula for rectangular cavities.The gradient-based searching method was used to evaluate the values of the empirical parameters.Less phase lag and a lower convection velocity are observed.
©2017 Chinese Society of Aeronautics and Astronautics.Production and hosting by Elsevier Ltd.This is an open access article under the CC BY-NC-NDlicense(http://creativecommons.org/licenses/by-nc-nd/4.0/).
1.Introduction
Cavities occur in a large number offlight vehicles.1,2Flow over a cavity changes the distributions of the mean and fluctuating pressures inside and near the cavity.3–5Near the front edge of a cavity,an unsteady pressure difference between the high-speed external flow and the vortex structure in the cavity is responsible for the generation of shedding vortices.When the shedding vortices propagate downstream and impinge the rear edge,there is a trailing edge vortex and acoustic waves.This induces high-intensity oscillation at predominant frequencies.6–8Tracy and Plentovich9investigated the flow characteristics of rectangular cavities with variable geometry at Mach numbers ranging from 0.2 to 0.95.Their results show the length-to-depth ratio,L/H,of a cavity is an important parameter to characterize cavity flows.A closed type cavity occurs forL/H> 10–13,in which the shear layer separates from the leading edge,attaches to the bottom of the cavity,and then separates again before the trailing edge.There is a strong streamwise pressure gradient along the cavity floor.ForL/H< 6–8,known as an open-type cavity,the shear layer spans the entire cavity and the impingement of the shear layer around the rear corner of the cavity induces high pressure fluctuations.A transitionaltype cavity exhibits combined characteristics of both open-and closed-type cavities.The boundaries between different types of cavity flow also depend on the cavity’s width-todepth ratio,the freestream Mach number,the Reynolds number,and the incoming boundary layer thickness.4,9–11
For an open-type cavity flow,the cavity can be classified as a shallow or a deep cavity,in which oscillation propagates in longitudinal and transverse directions.Rockwell and Naudascher12demonstrated the transition between longitudinal and transverse oscillation occurs atL/H≈1.For a shallow cavity,Rossiter7proposed that a feedback loop between vortex shedding and acoustic disturbance is responsible for the generation of discrete acoustic tones.Vortices shed periodically from the upstream lip of the cavity to the downstream end of the cavity.Acoustic pulses were then generated and propagated upstream inside the cavity.A semi-empirical formula is derived by Rossiter:
wherenis the oscillation mode number for the corresponding Strouhal number,Stn.fnandU∞are the oscillation frequency and freestream velocity,respectively.Mais the freestream Mach number.α corresponds to the lag time between the passage of a vortex and the emission of a acoustic pulse.kcis the ratio of the convection velocity of vortices toU∞.The empirical parameters were determined by the measured data,in which α=0.25(L/H=1,2,4)andkc=0.57 for rectangular cavities.7However,Unalmis et al.13indicated that values of the empirical parameters depend on flow conditions andL/H.The suggested values ofkcrange from 0.5 to 0.757,14,15and α=0.062(L/H).16
For cylindrical cavities,Hiwada et al.17found two unstable flow behavior,that is,flapping and switching,occurs at diameter-to-depth(D/H)=1.43–2.5 and 2.5–5.0,respectively(U∞=10–25 m/s).Dybenko and Savory18verified an asymmetric flow pattern inside cylindrical cavities(D/H=0.47 and 0.7 atU∞=27 m/s)and showed a significant pressure drop because of the asymmetric disturbance of upstream velocity or pressure profiles.Detailed information of the flow topology and the turbulent structure of the asymmetrical flow pattern inside a cylindrical cavity (D/H=2.0 atU∞=12 m/s)with stereo and tomographic particle image velocimetry is also presented by Haigermoser et al.19For oscillation characteristics in cylindrical cavities,previous studies18,20for incompressible flows showed that the first resonant frequencies can be predicted by classical Rossiter’s semi-empirical formula.Furthermore,Czech et al.20suggested that the characteristic length used in Rossiter’s formula can be represented by the streamwise effective length,corresponding to the equivalent area for a cylindrical cavity and a square cavity.On the other hand,Verdugo et al.21evaluated the first three modes of oscillation frequencies,in which the diameter of a cylindrical cavity was chosen to be the characteristic length.The values ofStnwere well predicted with modified empirical parameters α andkc.For compressible flows,the distributions for mean and fluctuating pressure show similar characteristics for cylindricaland rectangular cavities.22A transitional cavity flow is observed atD/H=8.60-21.00.The effect of the incoming boundary layer thickness-to-depth ratio,δ/H,is only evident near the rear face of the open and transitional cavities,in which the trailing-edge expansion and the amplitude of the peak pressure fluctuations decrease as δ/Hincreases.23This study aims to investigate the selfsustained oscillation of cylindrical cavities for compressible flows.The distributions of power spectral density(PSD),based on surface pressure fluctuations,are presented.For an opentype cavity flow,the resonant frequencies and their amplitudes are evaluated.The Strouhal numbers based on the streamwise effective length are presented and compared with the prediction of Rossiter’s semi-empirical formula,including a best fit to the measured data for α andkc.
2.Experimental technique
2.1.Transonic wind tunnel and instrumentation
Experiments were conducted in the blowdown transonic wind tunnel at the Aerospace Science and Technology Research Center in National Cheng Kung University(ASTRC/NCKU),as shown in Fig.1.The test section has a constant cross-section area of 600 mm square and a length of 1500 mm with solid side walls and perforated top/bottom walls.The perforated testsection walls of a transonic wind tunnel induce strong acoustic waves.For the flat plate cases,the spectra show the existence of high-level discrete peaks,in which an increase inMaresults in a high frequency(4.2–4.8 kHz forMa=0.64–0.83).24The stagnation pressure was controlled by a rotary perforated sleeve valve and the test Mach number in a subsonic condition was monitored by two choked flaps.In this study,the stagnation pressure was(172±1)kPa((25.0±0.15)psia)while the stagnation temperature was at room temperature,Ma=0.64,0.70,0.83±0.01.
The NEFF 620 system was used to record test conditions and a National Instruments(NI-SCXI)system recorded the output signals of the dynamic pressure transducers(Kulite XCS-093-25A,B screen).The transducers were flushmounted and powered by a DC power supply(GW Instek PSS-3203)of 10.0 V.The natural frequency of the transducers is 200 kHz,as quoted by the manufacturer.The Ectron amplifiers(753 A)were used to improve the signal-to-noise ratio,with a roll-offfrequency of approximately 140 kHz at a gain of 20.Each sample record has 131072 data points and is measured with a 5 μs sampling rate.For the spectral analysis,one sample record was divided into 31 segments with 50%overlap,resulting in 8192 data points for each segment.The frequency resolution is approximately 24.4 Hz.These segments were then Hann windowed and processed by fast Fourier transform.Finally,each spectrum was generated by averaging 31 spectra for each test case.
2.2.Models and test conditions
As shown in Fig.2,the test model consists of a flat plate(150 mm×450 mm)for a naturally developed turbulent boundary layer and an instrumentation plate(150 mm square)with a cylindrical cavity.The cavity front face was located 500 mm from the leading edge of the flat plate.The boundary layer thickness δ ≈ 7 mm at 25 mm upstream of the cavity and the corresponding unit Reynolds numbers were(12.9–17.2)×106per meter.Thirteen instrumentation plates were fabricated and the geometry of the cavities is summarized in Table 1.There were nine cavities with a fixed diameter(D=43 mm)and variable depths(H=1.0–9.7 mm),soD/Hranges from 4.43 to 43.00.Four cavities(D=31 and 59 mm)withD/Hof 6.15–6.20 and 14.05–14.09 were also fabricated to investigate the effect of δ/H.Notably,the values of δ/Hrange from 0.72 to 7.0 in the present study.Besides,Hiwada et al.17conducted an experimental study for the turbulent boundary layer flow over cylindrical cavities and found a strong asymmetry in the mean surface pressure distribution occurring atD/H=2.0.AsD/Hincreased to 5.0,there was a fairly symmetric pattern of pressure contour in the streamwise direction.Therefore,the pressure transducers were only flushed-mounted along the centerline of each cavity in this study.
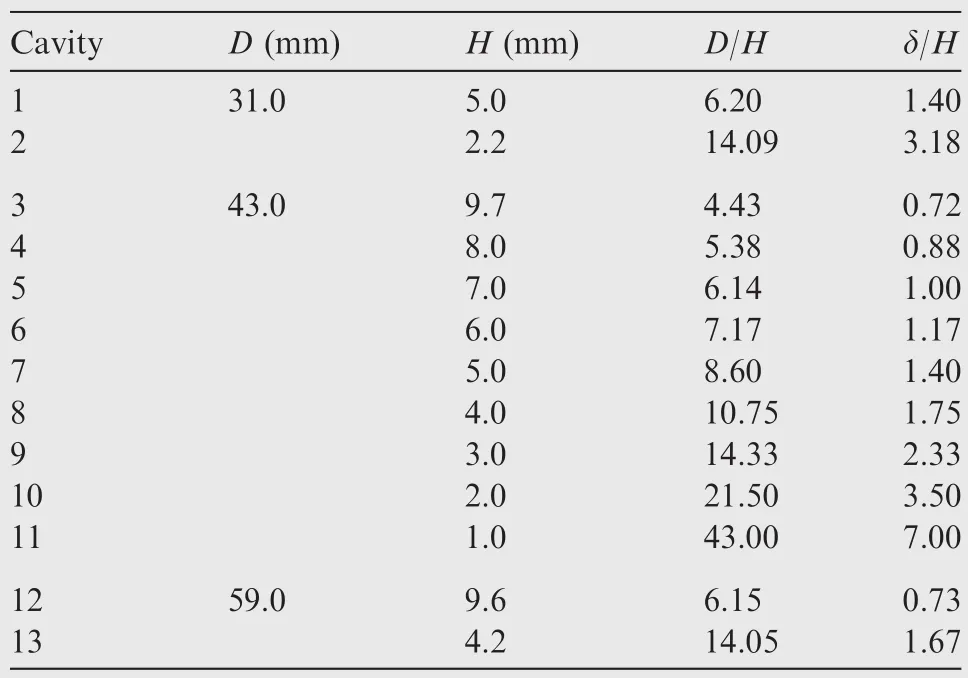
Table 1 Geometry of cylindrical cavities.
2.3.Empirical parameters in Rossiter’s formula
In the classical Rossiter’s equation,the empirical parameters for rectangular cavities were determined by a best fit to measured data.For cylindrical cavities,the optimal values of the empirical parameters can be evaluated by minimizing the difference between the experimental and predicted Strouhal numbers.In this study,the steepest descent optimization algorithm is adopted.25For each test case,the error between the experimental and expected Strouhal number is
Letx1=α andx2=1/kc,the objective function to be minimized is the sum of squared errors of each test case:
whereNis the number of test cases.For the first three resonant frequencies of six open-type cavities,N=54 forMa=0.64,0.70 and 0.83.The gradient ofF(x)is
With the known gradient of the objective function,one can utilize the gradient-based searching method to find the optimal vector x as follows.
(1)An initial vector is given,in which xold=[x1,x2]=[0.25,1/0.57].
(2)Evaluate F(xold)and▽F(xold).
(3)Evaluate a new vector,in which xnew=xold-a▽F(xold),whereais a constant.
(4)Evaluate F(xnew)and▽F(xnew).
(5)The iteration process is terminated when the difference between F(xnew)and F(xold)is smaller than a preset threshold value(1×10-15).
3.Results and discussion
3.1.Power spectra
For the present test configuration,the distributions of surface mean and fluctuating pressures are presented in Refs.22,23For an open-type cavity flow,the pressure gradient near the trailing edge for a cylindrical cavity is higher than that for a rectangular cavity.The amplitude of surface pressure fluctuations increases gradually along the streamwise direction and reaches a peak value ahead of the rear face.Distributions of the PSD,in terms of sound pressure level(SPL=shown in this study.In Fig.3,Ma=0.64 andD/H=4.43.The flat plate case, without the presence of a cavity, is also shown for comparison.Notably,there may be asymmetry in the mean surface pressure distribution under this test condition.Near the front edge of the cavity(x/D=0.06,0 at the leading edge and 1.0 at the trailing edge),two peaks are observed atf=1700 and 3700 Hz,corresponding to the first and second mode of oscillation frequency.The broad-band noise is approximately the same level as that for the flat plate case.Atx/D=0.64(near the center of the cavity), only the first mode is observed. Near the rear edge of the cavity(x/D=0.92),the third mode is also observed atf≈5600 Hz.The variation between front and rear is approximately 5 dB and 10 dB for the first and second mode,respectively.
On the Roissiter model,the feedback loop is mainly associated with the periodic vortex shedding near the front surface of the cavity.Tracy and Plentovich9suggested that the PSD measured at the forward wall has a better signal-to-noise ratio.Furthermore,Bilanin and Convert26proposed that the driving mechanism for self-sustained oscillation is due to the instabilities of the free shear layer and interaction between the shear layer and the cavity’s trailing edge,resulting in mass inflow and outflow near the rear face of a cavity.Therefore,the data of surface pressure fluctuations measured near the rear corner of the cavities are used to evaluate the oscillation frequencies.Distributions of the PSD forMa=0.83 near the rear corner of cylindrical cavities(x/D≈0.9)are plotted in Fig.4.
The flat plate case is also shown for reference.For clarity,only the uppermost plot has original values and other plots are offset by 10 dB consecutively.ForD/H=4.43–7.17,the value ofD/Hhas a minor effect on the peak frequencies,in which the self-sustained oscillation is observed atf1≈2150 Hz,f2≈4600 Hz andf3≈6500 Hz.For the flat plate case,the frequency of acoustic wave induced by the perforated walls of the wind tunnel is approximately 4800 Hz.Notably,the amplitude of peak SPL decreases as the value ofD/Hincreases.ForD/H=8.60–10.75(transitional-type cavities),no discrete peaks are observed.The PSD distributions forD/H=14.33–43.00 are similar to that for the flat plate case and the dominant frequency is approximately 4650 Hz,which is associated with the tunnel background noise rather than a resonance due to the presence of cavity.Further,the effect of the diameter of a cavity is of interest.Chung et al.23showed that the trailing-edge expansion and the amplitude of the peak pressure fluctuations decrease as δ/Hincreases.In Fig.4(c),the first-mode oscillation frequency(D/H≈6.15,open-type cavity)decreases asDincreases,in whichf1≈1465,2150,2540 Hz forD=31, 43, 59 mm, respectively. For transitional-and closed-type cavities,it appears that the background noise dominates PSD distributions.
ForMa=0.64,as shown in Fig.5,the PSD distributions have similar trends as those forMa=0.83.However,the peak frequencies decrease with a decrease inMa.The self-sustained oscillation is observed atf1≈1700 Hz,f2≈3700 Hz andf3≈5600 Hz.It is also noted the first mode appears for some transitional-and closed-type cavities(D/H=8.60,14.33 and 43.00).Furtherstudy isrequired.For the δ/Heffect(D/H≈6.15,open-type cavity),as shown in Fig.5(c),the minimumf1is observed forD=59 mm.ForD/H≈14.05(D=31 and 59 mm),the first mode(f1≈1700 Hz forD=43 mm andD/H=14.33)disappears.
3.2.Self-sustained oscillation for open-type cavities
For open-type rectangular cavities,previous studies demonstrate that the high intensity acoustic tones were well predicted by the semi-empirical Rossiter’s formula.For compressible cylindrical cavity flows,Verdugo et al.21showed that the first three modes of oscillation frequency can also be correctly predicted by the empirical formula.Nevertheless,some deviation is also observed.Fig.6 shows the Strouhal numbers for the first three modes of oscillation frequency.The effective streamwise lengthis used as the characteristic length.20The uncertainty ofStnis estimated to be±0.007,which is mainly related to the resolution of the PSD.AsD/Hdecreases,the deviation between a cylindrical cavity and a rectangular cavity is more evident at higher modes.In other words,there are lower oscillation frequencies for cylindrical cavities in compressible flows.Furthermore,Chung et al.23show that the amplitude of pressure fluctuations increases at a low δ/H.Bilanin and Covert26postulated that an energy-storing mechanism corresponds to self-sustained oscillations,in which the energy stored in a cavity is associated with cavity volume and depth.For the test case ofL/H=6.15 andD=59 mm,the values ofSt2andSt3are close to that of a rectangular cavity with higher oscillation frequencies,particularly at a lower Mach number.LowerSt2andSt3are also observed forL/H=6.20 andD=31 mm.Based on the steepest descent optimization algorithm,the optimized α andkcare 0.12 and 0.48,respectively.This implies that there is less phase lag and a lower convection velocity for a compressible flow over a cylindrical cavity than those for a rectangular cavity.
4.Conclusions
For compressible cylindrical cavity flows,resonance occurs for open-type cavities(D/H=4.43–7.17),while weak resonance occurs for a transitional-type cavity(D/H=8.6).The strength of resonance decreases asD/Hincreases.For a givenD/H,a larger diameter of the cavity results in lower resonant frequency.The Strouhal numbers at higher modes,based on the streamwise effective length,show a large deviation from Rossiter’s formula for rectangular cavities.The deviation can be remedied by the optimal setting of the empirical constants,in which the optimal values of α andkcare 0.12 and 0.48,respectively.This implies that there is less phase lag and a lower convection velocity for a cylindrical cavity than that for a rectangular cavity.
A
cknowledgement
The authors acknowledge the financial support of the Ministry of Science and Technology(No.MOST 103-2923-E-006-MY3).
1.Li Y,Wang XN,Zhang DJ.Control strategies for aircraft airframe noise reduction.Chin J Aeronaut2013;26(2):249–60.
2.Sun B,Luo XC,Feng F,Wu XS.Experimental investigations on cavity-actuated under-expanded supersonic oscillating jet.Chin J Aeronaut2015;28(5):1372–80.
3.Chung KM.Pressure fluctuations in rectangular cavity flows.Chin J Mech1999;15(3):97–102.
4.Chung KM.Three-dimensional effect on transonic rectangular cavity flows.Exp Fluids2001;30(5):531–6.
5.Lawson SJ,Barakos GN.Review of numerical simulations for high-speed,turbulent cavity flows.Prog Aerosp Sci2011;47(3):186–216.
6.East LF.Aerodynamically induced resonance in rectangular cavities.J Sound Vib1966;3(3):277–87.
7.Rossiter JE.Wind-tunnel experiments on the flow over rectangular cavities at subsonic and transonic speeds.Farnborough:Royal Aircraft Establishment;1964.Report No.:64037.
8.Handa T,Tanigawa K,Kihara Y,Miyachi H,Kakuno H.Frequencies of transverse and longitudinal oscillations in supersonic cavity flows.Int J Aerospace Eng2015;940:1–7.
9.Tracy MB,Plentovich EB.Cavity unsteady-pressure measurements at subsonic and transonic speeds.Washington D.C.:NASA;1997,Report No.:NASA-TP-3669.
10.Charwat AF,Roos JN,Dewey FC,Hitz JA.An investigation of separated flow—Part I:The pressure field.J Aerospace Sci1961;28(6):457–70.
11.Chung KM.Characteristics of transonic rectangular cavity flows.J Aircraft2000;37(3):463–8.
12.Rockwell D,Naudascher E.Review-self-sustaining oscillations of flow past cavities.J Fluids Eng1978;100(2):152–65.
13.Unalmis OH,Clemens NT,Dolling DS.Cavity oscillation mechanisms in high-speed flows.AIAA J2004;42(10):2035–41.
14.Zhang X,Edwards JA.An investigation of supersonic oscillatory cavity flows driven by thick shear layers.Aeronaut J1990;94(940):353–64.
15.Handa T,Miyachi H,Kakuno H,Ozaki T,Maruyama S.Modeling of a feedback mechanism in supersonic deep-cavity flows.AIAA J2015;53(2):420–5.
16.Atvars K,Knowles K,Ritchie SA,Lawson NJ.Experimental and computational investigation of an ‘open’transonic cavity flow.Proc Instit Mech Eng,Part G:J Aerospace Eng2009;223(4):357–68.
17.Hiwada M,Mabuchi I,Kumada M,Kawamura T.Some characteristics of flow pattern and heat transfer past a circular cylindrical cavity.Bull Jpn Soc Mech Eng1983;26(220):1744–52.18.Dybenko J,Savory E.An experimental investigation of turbulent boundary layer flow over surface-mounted circular cavities.Proc Instit Mech Eng,Part G:J Aerospace Eng2008;222(1):109–25.
19.Haigermoser C,Scarano F,Onorato M.Investigation of the flow in a circular cavity using stereo and tomographic particle image velocimetry.Exp Fluids2009;46(3):517–26.
20.Czech MJ,Crouch JD,Stoker RW.Cavity noise generation for circular and rectangular vent holes.Reston(VA):AIAA;2006,Report No.:AIAA 2006–2508.
21.Verdugo FR,Guitton A,Camussi R.Experimental investigation of a cylindrical cavity in a low Mach number flow.J Fluids Struct2012;28:1–19.
22.Lee KH,Chung KM,Chang KC.Characteristics of compressible cylindrical cavity flows.Asian-Pacific conference on aerospace technology and science,2015.
23.Chung KM,Lee KH,Chang KC.Characteristics of compressible flow over cylindrical cavities.J Aircraft2016;53(5):1565–7.
24.Chung KM,Chang PH,Chang KC.Tunnel background noise on compressible convex-corner flows.J Aircraft2013;50(4):1011–5.
25.Snyman JA.Practical mathematical optimization:An introduction to basic optimization theory and classical and new gradient-based algorithms.New York:Springer Science and Business Media,Inc.;2005.
26.Bilanin AJ,Convert EE.Estimation of possible excitation frequencies for shallow rectangular cavities.AIAA J1973;11(3):347–51.
16 June 2016;revised 10 October 2016;accepted 18 October 2016
Available online 7 June 2017
*Corresponding author.
E-mail address:kmchung@mail.ncku.edu.tw(K.-M.CHUNG).
Peer review under responsibility of Editorial Committee of CJA.
Production and hosting by Elsevier
http://dx.doi.org/10.1016/j.cja.2017.05.013
1000-9361©2017 Chinese Society of Aeronautics and Astronautics.Production and hosting by Elsevier Ltd.
This is an open access article under the CC BY-NC-ND license(http://creativecommons.org/licenses/by-nc-nd/4.0/).
Cavity flow;
Compressible flow;
Convection velocity;
Open cavity;
Oscillation
杂志排行

CHINESE JOURNAL OF AERONAUTICS的其它文章
- Wake structure and similar behavior of wake profiles downstream of a plunging airfoil
- Numerical studies of static aeroelastic effects on grid fin aerodynamic performances
- A new vortex sheet model for simulating aircraft wake vortex evolution
- Linear stability analysis of interactions between mixing layer and boundary layer flows
- Aerodynamic multi-objective integrated optimization based on principal component analysis
- Aerodynamic configuration integration design of hypersonic cruise aircraft with inward-turning inlets