Rotorcraft flight endurance estimation based on a new battery discharge model
2017-11-20FengCHENGHuWANGPinCUI
Feng CHENG,Hu WANG,*,Pin CUI
aSchool of Astronautics,Beihang University,Beijing 100083,China
bScience and Technology on Space Physics Laboratory,Beijing 100076,China
Rotorcraft flight endurance estimation based on a new battery discharge model
Feng CHENGa,Hua WANGa,*,Pin CUIb
aSchool of Astronautics,Beihang University,Beijing 100083,China
bScience and Technology on Space Physics Laboratory,Beijing 100076,China
To avoid the numerical complexities of the battery discharge law of electric-powered rotorcrafts,this study uses the Kriging method to model the discharge characteristics of Li-Po batteries under standard conditions.A linear current compensation term and an ambient temperature compensation term based on radial basis functions are then applied to the trained Kriging model,leading to the complete discharged capacity-terminal voltage model.Using an orthogonal experimental design and a sequential method,the coefficients of the current and ambient temperature compensation terms are determined through robust optimization.An endurance calculation model for electric-powered rotorcrafts is then established,based on the battery discharge model,through numerical integration.Laboratory tests show that the maximum relative error of the proposed discharged capacity-terminal voltage model at detection points is 0.0086,and that of the rotorcraft endurance calculation model is 0.0195,thus verifying their accuracy.A flight test further demonstrates the applicability of the proposed endurance model to general electric-powered rotorcrafts.©2017 Chinese Society of Aeronautics and Astronautics.Production and hosting by Elsevier Ltd.This is an open access article under the CC BY-NC-NDlicense(http://creativecommons.org/licenses/by-nc-nd/4.0/).
1.Introduction
In recent years,rotorcrafts have been widely applied in scouting,rescuing,surveying,and mapping,because of their capabilities for hovering and slow flight.Additionally,they are likely to be adopted in many other fields in the near future.1,2They are usually battery-powered,to leverage the small noise,low emission and high stability advantages of electric power systems.
In general,the flight endurance of electric-powered UAVs is mainly determined by two power-related factors:the power required to sustain the desired flight profile,and the battery discharge performance.Lindahl et al.3proposed a useful tool to select a good combination of propulsion components,based on a linear approximation to the ohmic region of the battery discharge law.Using the momentum theorem and blade element theory,Latorre4offered an optimal design for the electric power system of a quadrotor using the identification method,and proposed a mathematical model to select the optimal motor.Kaya et al.5used a polynomial model to estimate the rotor-propeller pair performance(from an endurance point of view)based on collected test data;in their endurance estimation formula,the battery current was considered to be constant.Starting from the propeller’s rotor disk area,Driessens and Pounds6modified the traditional configuration and designed a Y-shaped electric-powered rotorcraft,so as to decrease the required battery power and therefore increase endurance.Assuming an approximate linear relationship between the discharged capacity and the terminal voltage,Wang et al.7and Traub8established an endurance calculation model for electric-powered UAVs,using the Peukert equation and numerical integration.In addition,Traub8and Liu et al.9derived endurance formula models for electric-powered UAVs with and without considering Peukert effect respectively.By introducing the notions of available capacity and usable capacity factors,Abdillal et al.10obtained an endurance formula model for rotorcrafts driven by Li-Po batteries in 2015.In the same year,they proposed a technique to optimize the endurance of rotorcrafts by sub-dividing the monolithic battery into multiple smaller capacity batteries,which were then sequentially discharged and release.11Given the significant effect of weight on UAV endurance,12electric-powered rotorcrafts generally adopt composite materials with high strength-to-weight and stiffness-to-weight ratios for the fuselage structure,like nanosilica-loaded prepreg,carbon fiber,delrin plastic,and extruded polystyrene foam.13
The above-mentioned works3–12have insufficiencies,which stem from the lack of precise consideration of the complex discharge process of the batteries.Given the fundamental role of the battery as the energy source for the entire electric power system,it is important to consider not only the total power required from the battery,but also its discharge process.In fact,the dynamics of the discharge process are important to calculate the UAVs’endurance.This paper proposes a new battery discharge model,capable of accurately describing the dynamic discharge process;on the basis of this discharge model,a new endurance model for UAVs is then proposed.The proposed battery discharge model aims to improve the linear approximation used in previous works,3,7,8bringing the model as close as possible to the real nonlinear discharge law.The proposed endurance model can assist in estimating the UAV endurance under the chosen power consumption configuration,4,5by properly modeling the battery discharge process.In addition,the proposed endurance model will also be a useful,alternative theoretical tool to predict the endurance improvements obtained by new rotorcraft configurations6and the adoption of composite materials for the fuselage.13Some of the mentioned works8–10,12use formulas to estimate the endurance,in which the battery discharge process is again neglected;when deriving the equations for endurance estimation,they can therefore only consider the total capacity and/or total energy of the battery—and not the specific time profiles of the discharge processes.The proposed endurance model can help solve the above–mentioned issues encountered in formula endurance estimation.Finally,the proposed endurance model can also solve one of the drawbacks encountered when addressing the issue of optimum endurance:failing to consider the fact that a battery size decrease changes the discharge process,thereby reducing battery efficiency.11
To explore the calculation method for electric-powered rotorcraft endurance,a commercial quadrotor(E-450)and its Li-Po battery are used in this study.Using a theoretical approach and experimental test data,a model to estimate the battery power required for E-450 flights is first established;a discharged capacity-terminal voltage model for the battery is then proposed.This model uses the Kriging method,and considers both current and ambient temperature compensation terms,whose parameters are obtained with a robust optimization method;by numerically integrating the results of the previous models,a general calculation model for electric-powered rotorcraft endurance estimation is obtained.Finally,laboratory discharge tests and a flight test are conducted,to validate the results obtained with the proposed model.
2.Research strategy
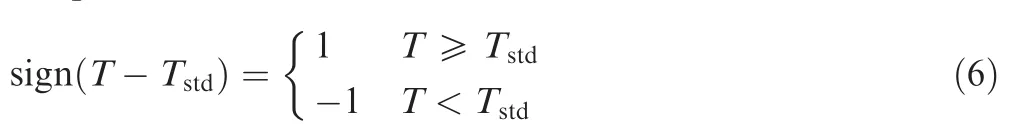
The E-450 rotorcraft and its Li-Po battery(brand:ACE;rated voltage:14.80 V;rated capacity:3989 mA·h,maximum discharge rate:25 C)are taken as research objects.First,a polynomial model of the rotorcraft electric power system efficiency is obtained using a regression method on measured flight test data;the required battery power for climbing and circling flight patterns are then analytically derived.The core part of the endurance calculation model proposed in this paper—the discharged capacity-terminal voltage model—is presented in the dotted box of Fig.1.A Kriging model is trained with the Li-Po battery discharge data obtained under standard operating conditions(with the discharged capacity as input,and the terminal voltage as output).Therefore,the obtained Kriging model represents the relationship between discharged capacity and terminal voltage under standard discharge conditions only(standard discharge current,8.00 A;standard ambient temperature,25°C).A linear current compensation term and an ambient temperature compensation term based on radial basis functions are then fused with the trained Kriging model,as described in Eq.(5).Briefly,the current compensation term is linearly applied to the trained Kriging model;the resulting expression is then multiplied by the ambient temperature compensation term;an extended discharged capacity-terminal voltage model is thus obtained.A robust optimization method—based on orthogonal experimental design and sequential modeling—is used to obtain optimized solutions for the coefficients of the current and ambient temperature compensation terms of the proposed discharged capacity-terminal voltage model;the objective function used in the robust optimization procedure is the weighted sum of the normalized expectation and standard deviation of the relative errors of the proposed discharged capacity-terminal voltage model. The final electric-powered rotorcraft endurance calculation model is obtained by combining the required battery power model and the discharged capacity-terminal voltage model,and numerically integrating the results of the latter(Fig.1).
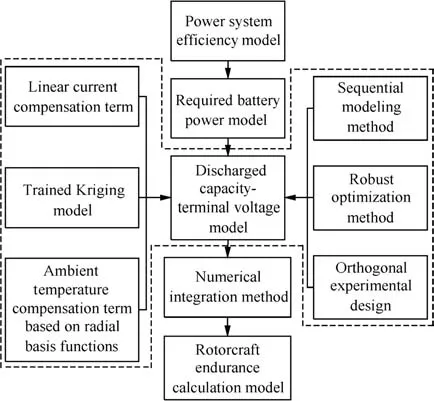
Fig.1 Design procedure of the proposed rotorcraft endurance model.
3.Required battery power
In this paper,two different flight profiles(vertical climbing and circular flight)are used to evaluate the performance of the proposed rotorcraft endurance model(see Section 7.2).To enable this evaluation,it is essential to determine the amount of battery power required in these two flight conditions,because it is the required battery power that allows the mapping from the herein proposed battery discharge model to the desired rotorcraft endurance model.
When an electric-powered rotorcraft flies vertically at a constant velocity,the climb velocity reduces the velocity induced at the rotor disk,and the required battery powerPbclis:14
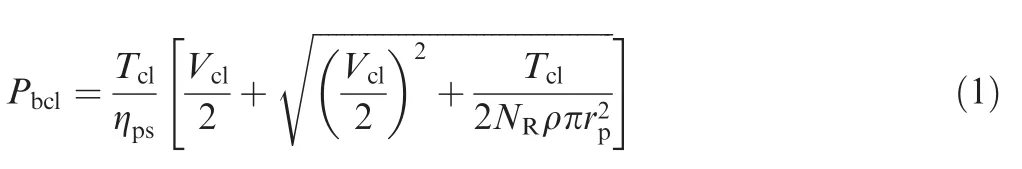
whereVclandTclare,respectively,the velocity and rotor thrust in vertical climbing flight,NRis the number of brushless motors,ηpsis the electric power system efficiency,rpis the radius of propeller,and ρ is the density of air.
According to Newton’s second law of motion,when the rotorcraft is in circular flight,the rotor thrustTciprovided by the power system,the centrifugal forceFcgenerated by the circular flight,and the weight must be balanced:whereFc=is the circular flight tangential velocity,ris the radius of circular flight,mis the rotorcraft mass,andgis the acceleration of gravity.The battery powerPhrequired for hovering can be estimated by14
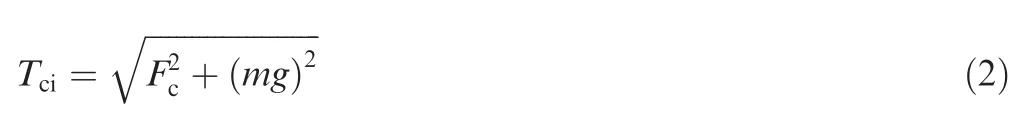
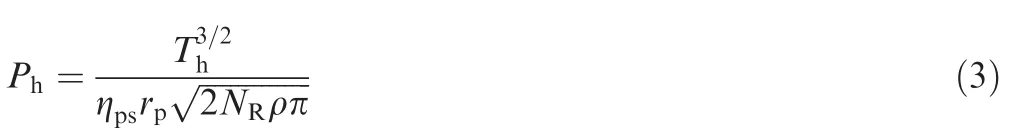
whereThis the required thrust.A previously proposed method15is used to calculate the required battery power for circular flightPbci,which means replacingThin Eq.(3)by Eq.(2).
The UAV electric power system efficiency varies with the driving input power.16Eq.(3)is used to estimate the E-450 power system efficiency under different driving input powers;flight tests are performed to measure battery power consumption,whereas the mass is measured on the ground.In the flight tests,the rotorcraft mass is gradually increased from 1372 g to 2146 g.The values ofgand ρ are taken asg=9.81 m/s2,and ρ=1.21 kg/m3.To calculate the electric power system efficiency,ten sets of voltage and current values are taken under each weight condition,and the average values of the required battery power and electric power system efficiency are calculated;17 measurement points are thus obtained.The relationship between the required battery powerPb(PbclorPbciin this paper,depending on the particular flight profile)and the E-450 electric power system efficiency is obtained by regressing the measured data using the least squares method:

To prevent round-off error,the power unit used in this regression is the kW.The obtained fitting curve(defined by Eq.(4))is shown in Fig.2,where the black squares represent the obtained measurement points.The confidence level for the variance analysis of the regression polynomial is taken as 0.95,since the obtained p-value is less than 0.05,and theR2value for this model is 0.851,Eq.(4)can be used to estimate the E-450 power system efficiency.The measured electric power system efficiency already includes the effects of the avionics power consumption;therefore,this factor does not need to be considered further when calculating the required battery power.
4.Discharged capacity-terminal voltage model
The most important aspect in the rotorcraft endurance estimation procedure is the characterization of the nonlinear relationship between the discharged capacityCdisand the terminal voltageUduring battery discharge,because the endurance estimate will result directly from the numerical integration of the obtained curve.To obtain the mathematical model of this nonlinear relationship,a Kriging model17is trained using the discharge data of Li-Po batteries under standard operating conditions(with the discharged capacity as input,and the terminal voltage as output).Being based on minimum-variance unbiased estimation,the Kriging model is an effective global approximation method with good nonlinear learning capabilities and multiple-peak prediction with low dimensional data.The battery terminal voltage can be obtained through the Shepherd model,the Unnewehr universal model,or the Nernst model.18These three models consider that the battery terminal voltage is linearly related to the discharge current existing at that moment.Moreover,the ambient temperature is also another important factor affecting the battery discharge characteristics,because of its influence on the activity level of the battery’s electrochemical components.Within a certain range of ambient temperatures,and with all other discharge condi-tions being constant,the higher the ambient temperature is,the slower the battery terminal voltage drop will be,and vice versa.
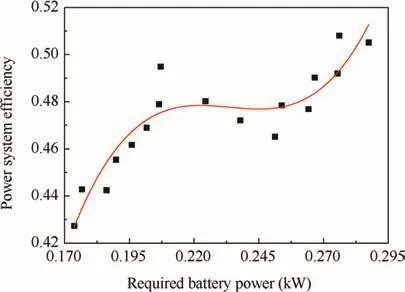
Fig.2 Fitting curve for required battery power vs power system efficiency relationship of E-450 rotorcraft.
Given the above discussion concerning the effects on the battery discharge characteristics of both the discharge rate and the ambient temperature,a linear current compensation term and an ambient temperature compensation term based on radial basis functions are applied to the trained Kriging model representing the standard discharge characteristics of Li-Po batteries,thus obtaining a more general and capable discharged capacity-terminal voltage model:
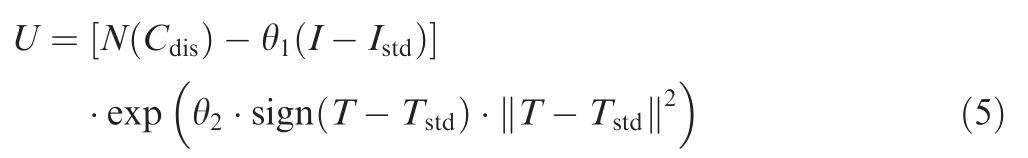
whereN(Cdis)is the trained Kriging model,θ1is the current compensation coefficient in the positive direction,Iis the actual discharge current,Istdis the standard discharge current,θ1(I-Istd)is the linear current compensation term,θ2is the ambient temperature compensation coefficient in the positive direction,Tis the actual ambient temperature,Tstdis the standard ambient temperature, andis the ambient temperature compensation term.
Given the effects of the temperature on the battery terminal voltage drop,19a radial basis function—with a simple form,space dimension independence,and isotropy—is introduced,to assist in expressing the relationship between ambient temperature and terminal voltage.The term expcan be used to represent the effects of ambient temperature on the terminal voltage,with ‖T-Tstd‖ designating the Euclidean distance between the two points.However,withTstdas the origin,there is an anisotropic relationship between the changes in ambient temperature and those of terminal voltage;therefore,a factor sign(T-Tstd)is used in the ambient temperature compensation term,with
This model avoids the need to solve the complex electrochemical dynamic equations of the processes occurring inside the battery;therefore,it circumvents the need to determine the electrochemical parameters,structural parameters,and the material characteristics of the battery,and of taking the effect of the internal battery temperature into consideration.
5.Parameter estimation
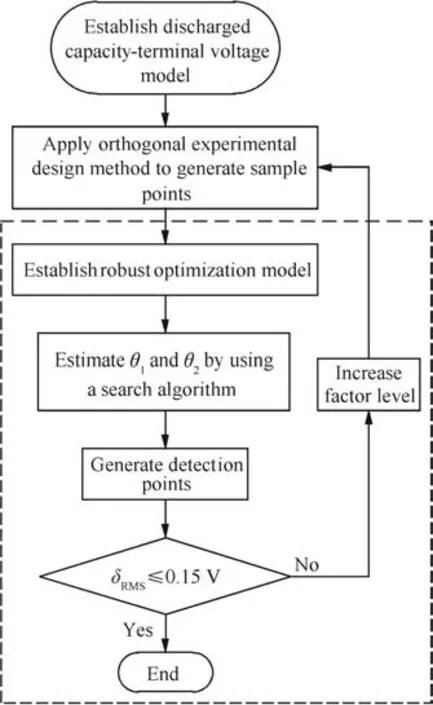
Fig.3 Procedure for estimating the parameters of discharged capacity-terminal voltage model based on robust optimization.
The values of θ1and θ2in Eq.(5)can be obtained by taking the average of multiple(preferably numerous)tests;however,doing so cannot ensure the precision of the discharged capacity-terminal voltage model.Therefore,a procedure including a robust optimization approach to determine θ1and θ2is adopted here,consisting in three steps(Fig.3):(1)establishment of the analysis model;(2)design of the battery discharge tests and test data collection;and(3)parameter determination based on robust optimization.Step 1 has been finished in Section 4––establishing the discharged capacity-terminal voltage model,as de fined by Eq.(5).For Step 2,sample data are obtained using an orthogonal experimental design;this step is detailed in Section 5.1.In Step 3,a sequential method is adopted to determine θ1and θ2(see the dotted box of Fig.3).Using Eq.(5)to estimate the terminal voltage at the current sample points,and combining both predictive and experimental values,a robust optimization procedure(detailed in Section 5.2)is implemented to determine θ1and θ2using a search algorithm.The distribution of the current sample points and the characteristics of the new analysis model are then analyzed.Detection points are generated with an additional factor level,and are used to verify whether this new model satisfies the accuracy criterion.If the accuracy criterion is still not being respected,the additional factor level used to generate the detection points will be added to the current factor levels;this new group of factor levels is then used to re-generate new sample points(based on the orthogonal experimental design),which are then used to update the analysis model repeatedly,until reaching the accuracy criterion—the root mean square(RMS)value of the absolute error δRMS:
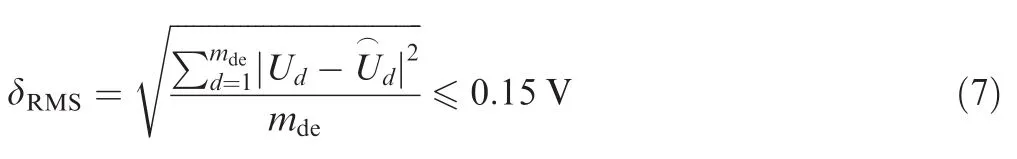
whereUdandare the test and model-predicted values,respectively,andmdeis the number of detection points.
5.1.Test data acquisition
Using Eq.(5)with a fixed discharged capacity,a set of battery terminal voltagesUi,jand their corresponding current and ambient temperature value pairs(Ii,Tj)(i,j=1,2,...,n;nis the number offactor level)can be used as sample points to determine θ1and θ2.In this study,an orthogonal experimental design is adopted to generate sample point triplets(Ii,Tj,Ui,j)(current and ambient temperature being the experimental factors)based on the chosen factor levels;sample points are obtained for discharged capacity values of 500,1000,1500,2000,2500,3000,3500,and 3800 mA·h.The required sample data is obtained from dedicated tests.
5.2.Robust optimization
Robust optimization20–22aims at minimizing the effects of the design variable fluctuations on the optimum values of the objective function.In this study,θ1and θ2are the design variables,and the objective functions to be minimized are the expectation and standard deviation of the relative errors of the discharged capacity-terminal voltage model in Eq.(5).However,the expected value and standard deviation of the relative errors are statistical features whose values depend on the probabilistic distribution of the relative errors and cannot be independently controlled;in general,they will not reach their minima simultaneously23in the feasible region for θ1and θ2;therefore,a weighting coefficient γ is used to transform the multi-objective optimization problem into a single objective optimization problem:23
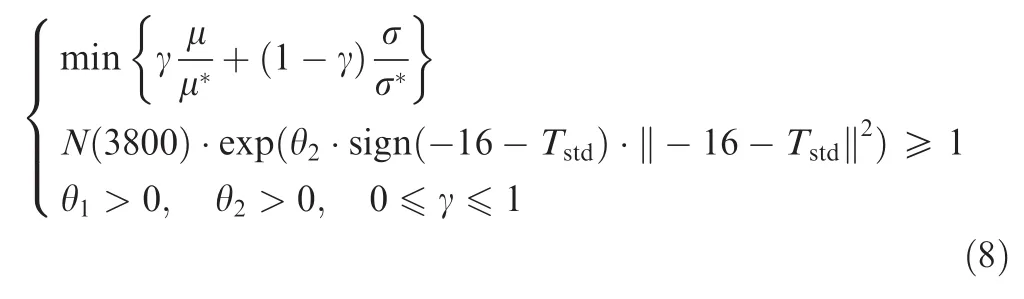
where γ depends on the relative importance of the objective functions μ and σ24,25in Eq.(8)and is chosen between 0 and 1;it is generally determined by the designer’s experience. μ and σ are the expected value and standard deviation of the relative errors at the sample points,respectively;μ*and σ*are the optimum values of μ and σ (respectively)when these statistics are individually considered as the sole objective function;μ*and σ*are therefore used to normalize the two objective function components.Determining θ1and θ2via a robust optimization method can help the discharged capacity-terminal voltage model reach a well-compromised balance of the different input variables(Ii,Tj)in terms of minimum relative error and stability.A genetic algorithm is used to search for the optimal point in the optimization problem defined by Eq.(8).The calculated value of σ*may be close to 0,because of the ambient temperature compensation term being close to 0(even though the ambient temperature compensation term is not very low for general operating ambient temperatures).To avoid such a singularity in the calculation of Eq.(8),a constraint is used to establish a threshold value for θ2in the optimization procedure;this constraint is used to evaluate whether the predicted value(the experimental value is 12.22 V)of the terminal voltage under a discharge condition of-16°C,8.00 A,at 3800 mA·h is greater than 1 V(the value of 1 V is used here to prevent the ambient temperature compensation from closing to 0;-16°C is assumed to be the lowest ambient temperature in real-life applications).
In this study,the minimum value and stability of the relative error are both equally important;therefore,the weighting coefficient is chosen as γ=0.5,leading to the optimal values θ1=0.05717 and θ2=0.0000367.In the last orthogonal experimental design that meets the termination criterion,the ambient temperature factor levels are-16,0,and 40°C and the current factor levels are 4.23,12.00,and 18.00 A.
6.Endurance calculation procedure
Based on the previously discussed discharged capacityterminal voltage model,a rotorcraft endurance model is created,using a previously proposed numerical integration method.7,8The procedure is shown in Fig.4,and can be described as follows:
Step 1.Given the initial values k=1,U1=16.80 V,and
C1,dis=0 mA·h,choose Δt=0.1 s as the time step.
Step 2.Verify the first termination condition

where k is the number ofiterations,Ukis the terminal voltage at thekth iteration,Uendis the cut-off voltage(12.80 V),and ε1is the specified error(0.001 V).If Eq.(9)is not satisfied,the iteration stops and goes to Step 6;otherwise,it proceeds to the next step.
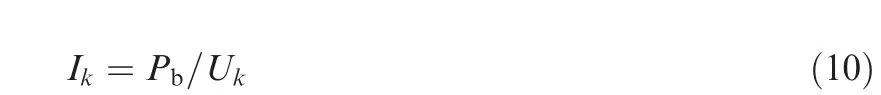
Step 3.Calculate the battery power Pbrequired for flight;the discharge current at thekth iteration can then be obtained by:
Step 4.Calculate the discharged capacity at the(k+1)th iteration:
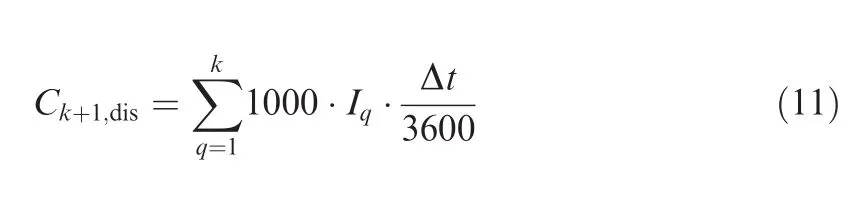
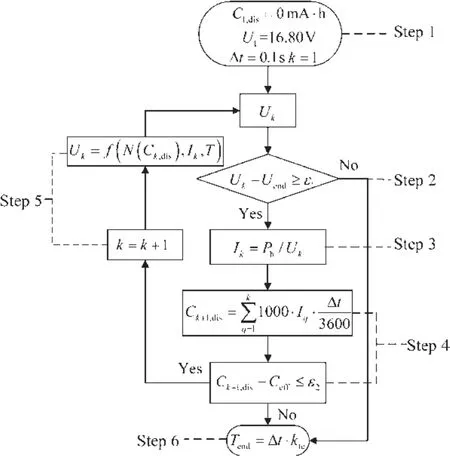
Fig.4 Procedure for calculating the endurance of the electricpowered rotorcraft.
The effective capacity of the batteryCeffcan be estimated using a previously proposed method:26
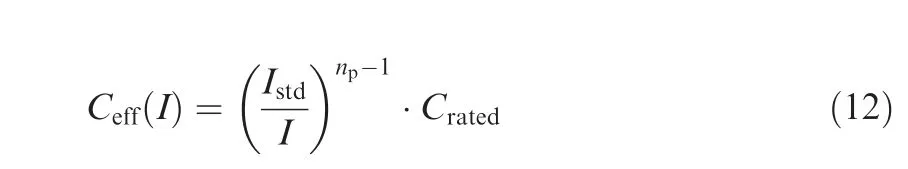
where npis the Peukert constant(1.01,measured under standard operating conditions)and Cratedis the rated battery capacity.Verify the second termination condition:

where ε2is the specified error(0.01 mA·h).If Eq.(13)is not satisfied,go to Step 6.Otherwise,proceed to the next step.
Step 5.Let k=k+1,and calculate the battery terminal voltage for the next iteration:

where e0=exp(0.0000367 ·sign(T-25)·(T-25)2);after updating Uk,go to Step 2.
Step 6.Calculate the rotorcraft endurance

where kteis the terminal iteration number.
7.Test validation and discussion
7.1.Laboratory tests
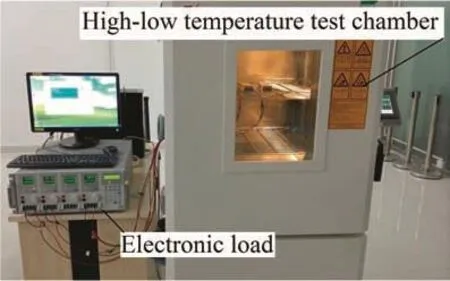
Fig.5 Laboratory test of battery discharge.
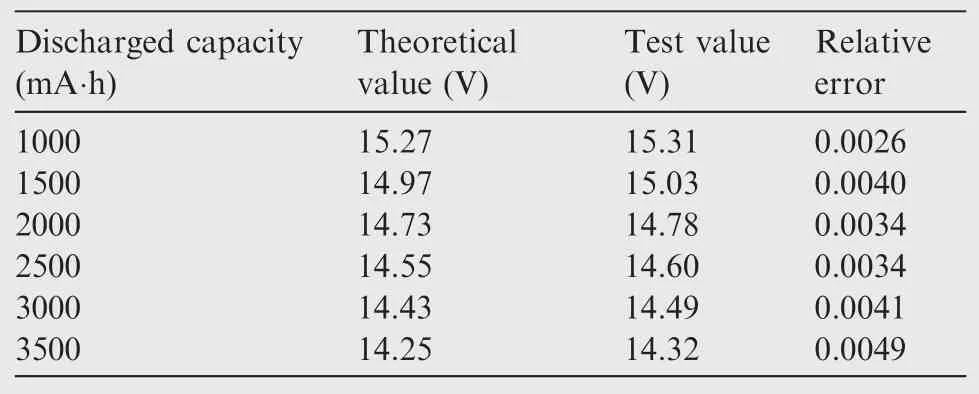
Table 2 Comparison of terminal voltages at different discharged capacity points(discharge at 13.6°C and 70 W).
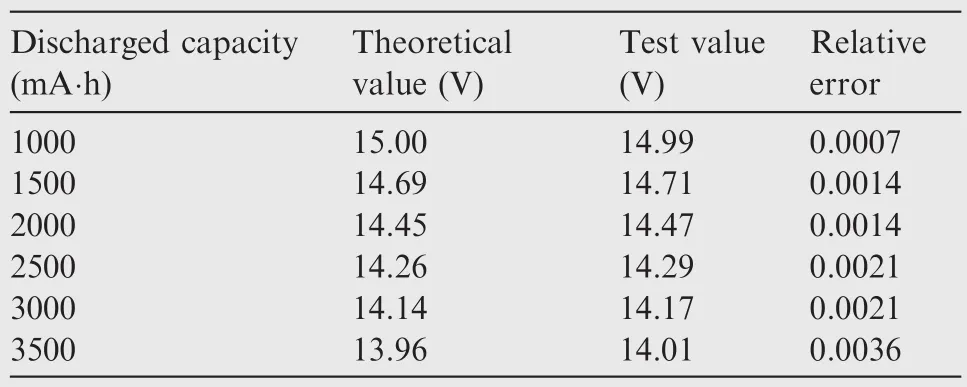
Table 3 Comparison of terminal voltages at different discharged capacity points(discharge at 13.6°C and 140 W).
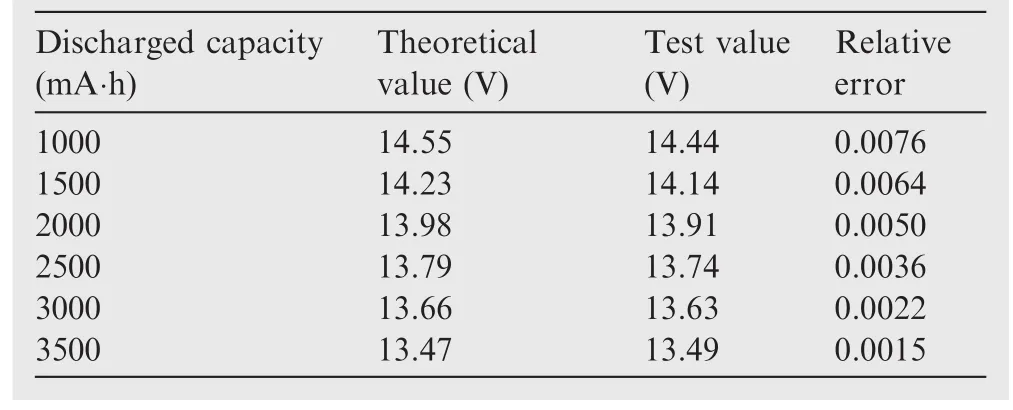
Table 4 Comparison of terminal voltages at different discharged capacity points(discharge at 13.6°C and 250 W).
To verify the correctness of the proposed rotorcraft endurance model,laboratory tests are carried out;in these tests,the ambient temperature for battery discharge is randomly chosen to be 13.6°C and discharge powers 70,140,250,and 350 W are used.Before the discharge tests,the Li-Po battery is placed in a high-low temperature test chamber for 2 h,to homogenize the internal battery temperature with the ambient temperature(as happens in actual application).An electronic load records the discharge data during the test(Fig.5).
Table 1 shows a comparison between the discharge times of the laboratory tested Li-Po battery and the values calculated with the proposed endurance model;as shown,the maximum relative error is 0.0195.Tables 2–5 show a comparison between the theoretical and laboratory test values for the terminal voltage at different discharged capacity points(1000,1500,2000,2500,3000,and 3500 mA·h are chosen as detection points);in these comparisons,the maximum relative error is 0.0086.
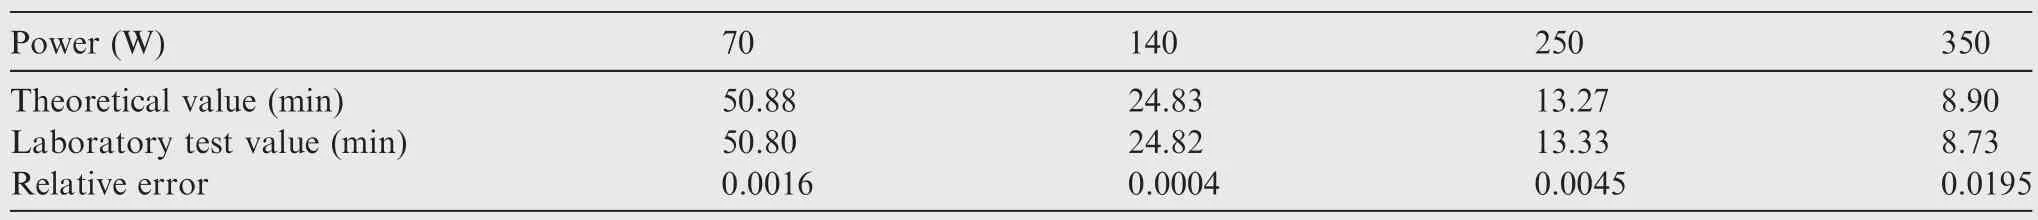
Table 1 Comparison between theoretical and laboratory test values for battery discharge time at 13.6°C.
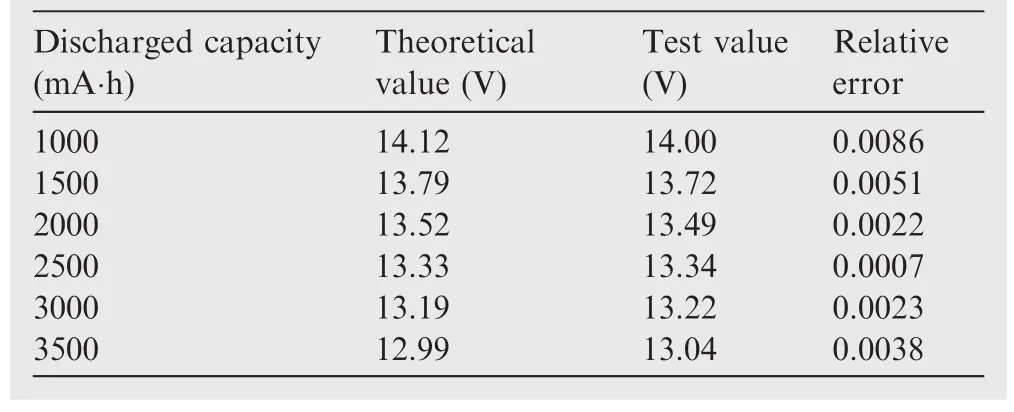
Table 5 Comparison of terminal voltages at different discharged capacity points(discharge at 13.6°C and 350 W).
Fig.6 shows a graphical view of the discharge processes;as can be seen,the values calculated with the proposed endurance model are in close agreement with the results of the laboratory tests.The above comparisons indicate the adequacy and accuracy of the two models proposed in this paper—the discharged capacity-terminal voltage model and the endurance calculation model.However,laboratory tests cannot fully replace flight tests.Therefore,flight tests are also performed,to further verify the correctness of the endurance calculation model.
7.2.Flight test
To verify the proposed rotorcraft endurance calculation model,a flight test is carried out with the E-450 rotorcraft.
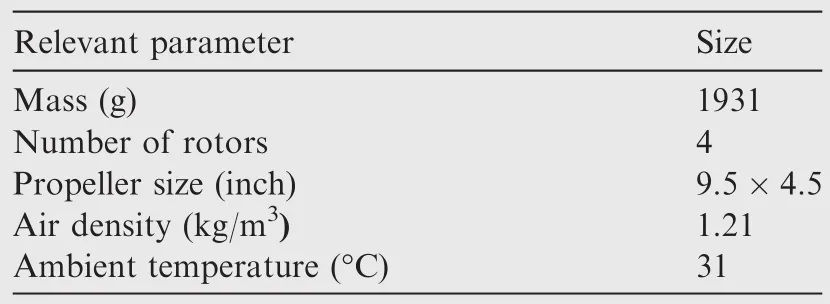
Table 6 Flight environment and E-450 parameters.
The test parameters and general flight conditions are shown in Table 6.The E-450 first climbs at a velocity of 1.76 m/s from 0 m to 30 m above sea level,and then enters into circular flight until the termination condition is satisfied.If the battery cannot maintain the required power during the designated flight,we assume that its effective capacity is exhausted.The tangential velocity and radius of the circular flight are 4.75 m/s and 30 m,respectively.During the flight test,the E-450 is controlled by a simple version of Pixhawk autopilot,so that the voltage and current values can be transmitted to the ground station in real time(see Fig.7).
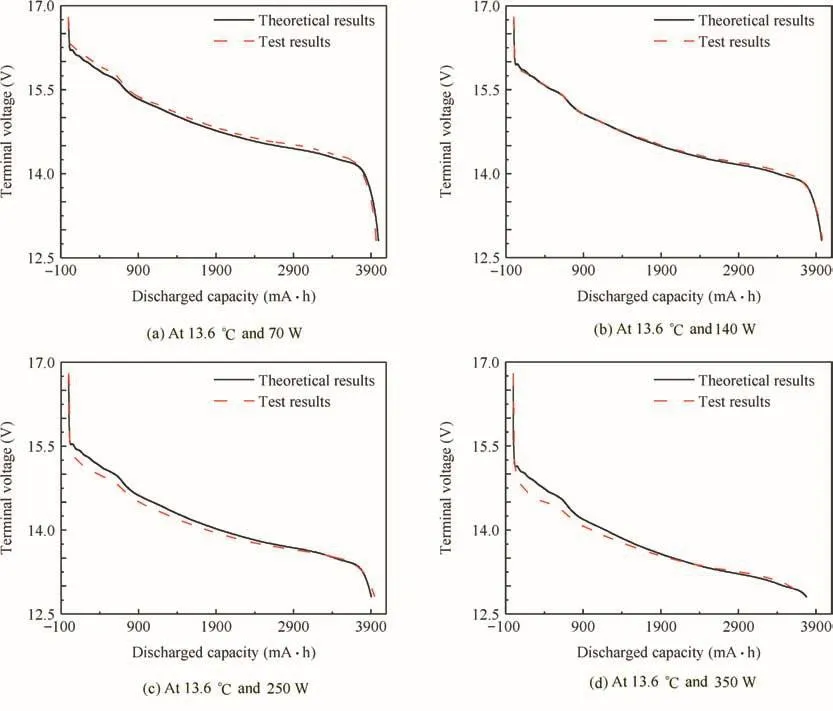
Fig.6 Graphical comparison of endurance model results with obtained laboratory test values.
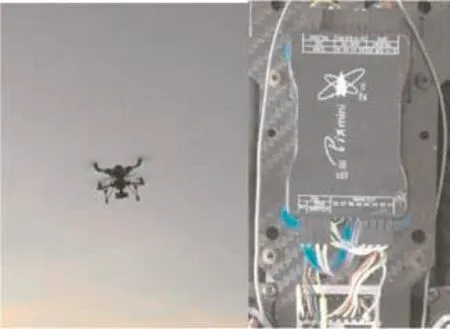
Fig.7 E-450 and the mini-Pixhawk.
Table 7 shows the theoretical results obtained with the endurance model and the obtained flight test result.In this table,Methods 1,2 and 3 respectively refer to previously proposed endurance calculation models.7–9In Methods 1 and 2,the Peukert constantnptakes the value of 1.01;In Method 2,the required battery power is considered to be 259.86 W,the time weighted average of the required battery power used in endurance calculations in this paper.As can be seen in Table 7,the proposed endurance model exhibits a performance superior to that of the other endurance calculation methods.The limitations of a closed-form approach to endurance calculation(endurance calculated by a static formula)lie in that it can only calculate the total endurance on the basis of the rated voltage and capacity;it cannot calculate the endurance for different cut-off voltages.
As shown in Fig.8,the terminal voltages measured during the flight test and those calculated using the proposed model at various discharged capacities agree well;accurate description of the discharge process can help to estimate accurate endurance for the different cut-off voltage requirements.Method 1 could not accurately describe the battery discharge process(Fig.8);as expected,the discharged capacity-terminal voltage model exhibits a linear relation,as previously reported.7However,for the most part of the battery discharge,the terminal voltage predicted by the proposed endurance calculation model tends to be slightly lower than the flight test values.The main reason for this discrepancy is twofold:first,the wires used for obtaining the data to construct the model are longer than the ones used when obtaining the data to validate the model in the flight test;secondly,the accuracy of the rotorcraft measuring sensor is limited.Overall,the presented comparisons and analyses evidence the accuracy of the proposed endurance model and its adequacy for engineering applications requiring endurance estimation.
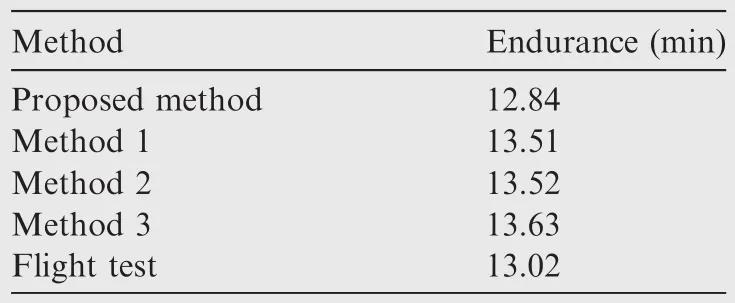
Table 7 Comparison between the theoretical estimates and the obtained flight test values for endurance.
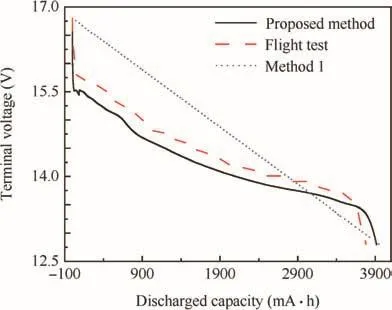
Fig.8 Comparison between the results obtained with endurance model and those offlight test.
8.Conclusions
As seen in Fig.8,the proposed discharged capacity-terminal voltage model can lead to a more accurate description of the discharge process than a simple linear approximation.3,7,8Hence,the endurance model can help in estimating the performance of the chosen electric power system by accurately modeling the battery discharge.4,5The analysis results presented in Section 7 indicate that the proposed endurance model can be used as an effective theoretical method to estimate the endurance improvements afforded by new UAV configurations6and by adopting composite materials for the fuselage.13The comparisons in Section 7.2 show that the proposed endurance model is more accurate than the considered previously proposed methods7–9,12(two of these methods8,12use the same endurance estimation formula);these comparisons also indicate that the dynamics of the discharge process is an important factor in the final endurance.The proposed endurance model is based on the proposed battery discharge model;its correctness and accuracy show that it can provide a theoretical analysis method to quantify the contributions of previous work,11by considering the reduction in battery efficiency resulting from the changed discharge process implied by battery size decrease.
In conclusion,the proposed battery discharge model accurately describes the discharge process of the target Li-Po battery.As a result,it is applicable in the endurance calculation of systems with variable amounts offlight power requirements and different cut-off voltage requirements.The practicality of this model is demonstrated with laboratory and flight tests.Moreover,the good agreement levels obtained between the experimental and theoretical curves demonstrate the accuracy of the proposed discharged capacity-terminal voltage model,as well as the adequacy of the proposed parameter estimation method based on robust optimization.Compared with other battery discharge models,the proposed rotorcraft battery discharge model requires only two parameters,which greatly reduces the number of tests and data processing workload.This battery discharge model is suitable not only for the endurance calculation of electric-powered rotorcraft,but also for electric-powered fixed-wing(and other configurations)UAVs.
However,it should be noted that the data to construct the model and the data to validate it(Section 7.1)are collected basically under the same experimental conditions:same battery status(all new),same equipment for battery discharge,same season/place when/where the tests are performed,etc.Therefore,factors such asbattery aging,cycle times,measuring equipment,and air humidity do not influence the comparisons presented in Section 7.1.Those factors have also not been incorporated into the proposed discharged capacityterminal voltage model.To further refine this model,the above factors should be considered in future work.Furthermore,factors such as battery aging,temperature change,and cycle times should also be considered in the estimation of the Peukert constant.
1.Gans NR,Curtis JW,Barooah P,Sheah JM,Dlxon WE.Balancing mission requirement for networked autonomous rotorcrafts performing video reconnaissance.AIAA guidance,navigation,and control conference;2009 Aug 10–13;Chicago.Reston(VA):AIAA;2009.p.1–17.
2.Abershitz A,Rubinets R,Gali S.Autonomous landing of unmanned rotorcraft aerial vehicle—laser scanner terrain mapping.AIAA Infotech@aerospace conference;2009 April 6–9;Washington.Reston(VA):AIAA;2009.p.1–20.
3.Lindahl P,Moog I,Shaw SR.Simulation,design,and validation of an UAV SOFC propulsion System.IEEE Trans Aerosp Electron Syst2012;48(3):2582–91.
4.Latorre ES.Propulsion system optimization for an unmanned lightweight quadrotor[dissertation].Barcelona:Universitat Polite`cnica de Catalunya;2011.
5.Kaya D,Kutay AT,Kurtulus DF,Tekinalp O,Simsek I,Soysal S,et al. Propulsion system selection and modeling for a quadrotor with search and rescue mission.54th AIAA aerospace sciences meeting;2016 Jan 4–8;California.Reston(VA):AIAA;2016.p.1–10.
6.Driessens S,Pounds PEI.Towards a more efficient quadrotor configuration.2013 IEEE/RSJ international conference on intelligent robots and systems(IROS);2013 Nov 3–7;Tokyo.Piscataway(NJ):IEEE Press;2013.p.1386–92.
7.Wang G,Hu Y,Song BF,Tan C.Optimal design endurance estimation of propulsion system for electric powered unmanned aerial vehicle.J Aerosp Power2015;30(8):1834–40[Chinese].
8.Traub LW.Range and endurance estimates for battery-powered aircraft.J Aircraft2011;48(2):703–8.
9.Liu X,Zhu R,Ye XY,Zhou ZY,Xiong W.Endurance optimization for micro air vehicles.Acta Aeronautica et Astronautica Sinica 2008;29(1):80-4[Chinese].
10.Abdillal A,Richards A,Burrow S.Power and endurance modelling of battery-powered rotorcraft.2015 IEEE/RSJ international conference on intelligent robots and systems(IROS);2015 Sept 28–Oct 2;Hamburg.Piscataway(NJ):IEEE Press;2015.p.675–80.
11.Abdilla A,Richards A,Burrow S.Endurance optimization of battery-powered rotorcraft.16thannual conference,towardsautonomous robotic systems;2015 Sept 8–10;Liverpool.Berlin:Springer;2015.p.1–12.
12.Traub LW.Optimal battery weight fraction for maximum aircraft range and endurance.J Aircraft2016;53(4):1176–8.
13.Makeev A,Bakis C,Strauch E,Chris M,Holemans P,Miller G,et al.Advanced composite materials technology for rotorcraft through the use of nanoadditives.J Am Helicopter Soc2015;60(3):1–10.
14.Johnson W.Rotorcraft aeromechanics.New York:Cambridge University Press;2013.p.39–50.
15.Mulgaonkar Y,Whitzer M ,Morgan B,Kroninger CM,Harrington AM,Kumar V.Power and weight considerations in small,agile quadrotors.Spie Defense+Security 2014;9083(2):90831Q.
16.Ostler JN,Bowman W.Flight testing of small,electric powered unmanned aerial vehicles.U.S.air force Tamp;E days;2005 Dec 6–8;Nashville.Reston(VA):AIAA;2006.p.1–12.
17.Martin JD,Simpson TW.Use of Kriging models to approximate deterministic computer models.AIAA J2005;43(4):853–63.
18.Plett GL.Extended Kalman filtering for battery management systems of LiPB-based HEV battery packs Part 2.Modeling and identification.J Power Sour2004;134(2):262–76.
19.Hausmann A,Depcik C.Expanding the Peukert equation for battery capacity modeling through inclusion of a temperature dependency.J Power Sour2013;235:148–58.
20.Pishvaee MS,Rabbani M,Torabi SA.A robust optimization approach to closed-loop supply chain network design under uncertainty.Appl Math Modell2011;35(2):637–49.
21.Paiva RM,Carvalho ARD,Crawford C,Suleman A,Canfield R.Robust and reliability-based design optimization framework for wing design.AIAA J2014;52(4):711–24.
22.Boopathy K,Rumpfkeil MP.Robust optimizations of structural and aerodynamic designs.15th AIAA/ISSMO multidisciplinary analysis and optimization conference;2014 Jun 16–20;Atlanta,GA.Reston(VA):AIAA;2014.p.1–30.
23.Marques S,Badcock KJ.Impact of structural variability on robust flutter optimization.53rd AIAA/ASME/ASCE/AHS/ASC structures,structural dynamics and materials conference;2012 Apr 23–26;Hawaii.Reston(VA):AIAA;2012.p.1–11.
24.Zaman K,Mahadevan S.Robustness-based design optimization of multidisciplinary system under epistemic uncertainty.AIAA J2013;51(5):1021–31.
25.Lee KH,Park GJ.Robust optimization considering tolerances of design variables.Comput Struct2001;79(1):77–86.
26.Doerffel D,Sharkh SA.A critical review of using the Peukert equation for determining the remaining capacity of lead-acid and lithium-ion batteries.J Power Sour2006;155(2):395–400.
20 September 2016;revised 20 November 2016;accepted 17 February 2017 Available online 7 June 2017
*Corresponding author.
E-mail address:Whua402@163.com(H.WANG).
Peer review under responsibility of Editorial Committee of CJA.
Production and hosting by Elsevier
http://dx.doi.org/10.1016/j.cja.2017.05.008
1000-9361©2017 Chinese Society of Aeronautics and Astronautics.Production and hosting by Elsevier Ltd.
This is an open access article under the CC BY-NC-ND license(http://creativecommons.org/licenses/by-nc-nd/4.0/).
Kriging model;
Orthogonal experimental design;
Robust optimization;
Rotorcraft endurance;
Sequential method
杂志排行

CHINESE JOURNAL OF AERONAUTICS的其它文章
- Wake structure and similar behavior of wake profiles downstream of a plunging airfoil
- Self-sustained oscillation for compressible cylindrical cavity flows
- Numerical studies of static aeroelastic effects on grid fin aerodynamic performances
- A new vortex sheet model for simulating aircraft wake vortex evolution
- Linear stability analysis of interactions between mixing layer and boundary layer flows
- Aerodynamic multi-objective integrated optimization based on principal component analysis