Heuristics of node selection criteria to assess robustness of world airport network
2017-11-20MnelSORIAOriolLORDANJoseMrSALLAN
Mnel SORIA,Oriol LORDAN,Jose´Mrı´ SALLAN
aDepartment of Physics–Aeronautics Engineering,Universitat Polite`cnica de Catalunya-BarcelonaTech,Terrassa 08222,Spain
bDepartment of Management,Universitat Polite`cnica de Catalunya-BarcelonaTech,Terrassa 08222,Spain
Heuristics of node selection criteria to assess robustness of world airport network
Manel SORIAa,Oriol LORDANb,*,Jose´Marı´a SALLANb
aDepartment of Physics–Aeronautics Engineering,Universitat Polite`cnica de Catalunya-BarcelonaTech,Terrassa 08222,Spain
bDepartment of Management,Universitat Polite`cnica de Catalunya-BarcelonaTech,Terrassa 08222,Spain
The world airport network(WAN)is one of the networked infrastructures that shape today’s economic and social activity,so its resilience against incidents affecting the WAN is an important problem.In this paper,the robustness of air route networks is extended by defining and testing several heuristics to define selection criteria to detect the critical nodes of the WAN.In addition to heuristics based on genetic algorithms and simulated annealing,custom heuristics based on node damage and node betweenness are defined.The most effective heuristic is a multiattack heuristic combining both custom heuristics.Results obtained are ofimportance not only for advance in the understanding of the structure of complex networks,but also for critical node detection.
©2017 Chinese Society of Aeronautics and Astronautics.Production and hosting by Elsevier Ltd.This is anopenaccessarticleundertheCCBY-NC-NDlicense(http://creativecommons.org/licenses/by-nc-nd/4.0/).
1.Introduction
Most of today’s economic and social activity is supported by networked systems.These systems facilitate access to energy(e.g.,the power grid),information(the Internet)and transportation of goods and people(e.g.,air and railway transport networks).One of these systems is the world airport network(WAN),shaped by the aggregation of air routes planned by airlines.The WAN is one of the most important networked infrastructures,as it contributes to facilitating the movement of people and merchandise worldwide,pushing forward globalization in a similar way as what Internet has done with dissemination of information.1
Given the importance of the air transport network for economic and social development,its resilience against incidents affecting parts of the network is a major concern.Incidents such as the eruption of the Eyjafallajo¨kul volcano in 2010 affected the connections between Europe and the United States,causing the delay or cancelation of 10 millions offlights,2and economic losses of around 1.7 billion USD.3Although the probability of occurrence of such an incidence in everyday operations is low,the isolation of central airports of the air transport network can have serious economic consequences and seriously affect global mobility.
Although safety consideration is a major concern in airline industry,the WAN has not been planned to be resilient to the isolation of a set of relevant airports,but it is rather the result of the aggregation of the route portfolio decisions made by air-lines and alliances,that is driven not only by commercial reasons,but also on geographical,technical and even political grounds.For instance,airlines following a Full-Service Carrier business model will organize their routes in a hub-and-spoke basis,aggregating passenger traffic in hub airports to increase the load factor of long-distance flights(usually profitable only with large aircrafts).Airlines following the Low-Cost Carrier business model,although operate with point-to-point flights,will also concentrate flights in technical hubs for commercial and technical reasons.As the WAN is the aggregation of all operating airlines,it is not surprising that large differences of connectivity and centrality are observed in airports worldwide.
A usual approach to detect the critical airports of the WAN is to model them as air route networks.4The nodes of these networks are the origins and destination of routes(usually airports,sometimes cities served by one or several airports)and the edges are direct routes between nodes.The resulting unweighted,undirected graph can be analyzed using complex network theory,which analyzes real world systems composed by a large number of dynamical units.One of the results of this theory is that the way that the network is shaped or constructed affects their topological properties,which in turn affect their robustness to network isolation.In random networks,where all possible connections between nodes have the same probability,all nodes are homogeneous,and therefore are equally resilient to errors(isolation of nodes chosen at random)as to attacks(isolation of central nodes,or nodes chosen to maximize damage to connectivity).On the other hand,networks built following preferential attachment mechanisms(the probability of linking to a given node increases as the node is connected to more nodes)tend to have a few highly-connected nodes together with a large number of lowconnected nodes.5The degree distribution of these networks tends to follow a power law,and thus they are called scalefree networks,while the degree distribution of random networks follows a Poisson distribution.Scale-free networks tend to be much more resilient to errors than to attacks,as the isolation of central nodes of the latter may have a large impact on network connectivity.6
An approach to evaluate robustness of complex networks is to check the evolution of the size ofits largest connected component(giant component)as a function of the fraction of isolated nodes.Robustness to attacks is usually assessed by choosing the nodes to isolate using a given node selection criterion with an adaptive strategy:in each step,the node to isolate is selected using a selection criterion(e.g.,degree).Once all connections coming from the isolated node are deleted,the parameter defining the selection criterion is recalculated for all nodes before the next node is chosen.Previous research shows that the performance of selection criteria is contingent upon the network considered.While a criterion based on modal analysis has good performance for power grid networks,7criteria based on node betweenness and damage perform better with air route networks.8Recent development of this stream of research explores more sophisticated approaches to node selection,based on reversed strategies9or particle swarm optimization heuristics.10–12
The analysis of network robustness described above can also be seen as an application of the critical node detection problem(CNP),in particular its second variant,consisting in identifying the subset of nodes whose disconnection makes the largest connected component contain no more than a fixed number of nodes.13Research on CNP has identified exact methods to solve this problem,based on integer linear programming.14,15But the application of these methods for assessing robustness of large networks can lead to high computational costs.Although the enhanced ILP approaches described in Ref.15deal at most with networks of the same order of magnitude of the WAN(more than 3500 nodes),the CNP approach solves the problem for one value of the number of isolated nodesl,while approaches based on complex networks offer solutions for a range of values ofl.This output can help to assess network robustness better than the solution given for a single value ofl.
The aim of this paper is to develop algorithms to efficiently detect the critical airports of airport networks,taking into account the specific properties of such networks and offering superior performance than existing approaches,mainly based on adaptive strategies.Heuristics based on adaptive strategies,genetic algorithms and simulated annealing will be presented first,which will be followed by custom heuristics that take advantage of the structure of the WAN.All these heuristics will be tested for a specific instance of the WAN.
2.Detection of critical airports through adaptive strategies
To compare the performance of different algorithms of critical node detection,a WAN has been constructed for retrieving air traffic data of August 2014 from the official aviation guide(OAG)dataset.This dataset contains information about most flights scheduled by commercial airlines.For the purposes of this research,the WAN is modeled as a graph,with nodes representing airports,linked by edges if there is at least a direct flight between them.The resulting unweighted,undirected network has an adjacency matrix A,whose componentsaijequal one if nodes(i,j)are connected,and zero otherwise.The degreekiof nodeiis the number of edges incident to the node:
An airport with high degree has a large number of direct connections with other airports;therefore nodes with high degree represent well connected airports.The betweennessBiof nodeiis defined as
wherenjkis the number of the shortest paths between any pair of nodesj,k,andnjk(i)is the number of the shortest paths betweenjandkincludingi.An airport with high betweenness is in the middle of many shortest paths between airports not connected by direct flights,then it is considered a central airport.A feature of the WAN is the existence of central airports with few connections.16,8Two possible node selection criteria to simulate attacks can be defined to disconnect in each iteration of the adaptive strategy the node with maximum value of degree and betweenness,respectively.Such strategies to attack the WAN will be hereinafter referred to as adaptive degree(A-DEG)and adaptive betweenness(A-BET).
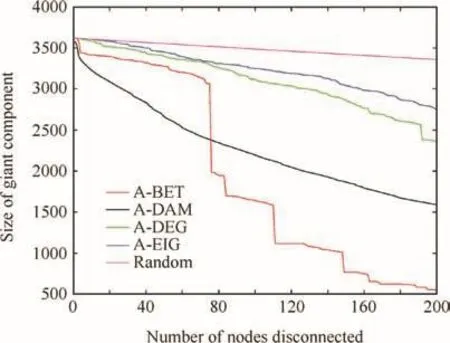
Fig.1 Size of giant component as a function of number of disconnected nodes for several adaptive strategies.
Another two node selection criteria have been considered:eigenvector and damage(A-EIG and A-DAM).The eigenvector centrality is obtained from the eigenvector of the adjacency matrix corresponding to the maximum eigenvalue.Eigenvector centrality of a node depends on eigenvector centralities of the nodes connected to it.17The critical damage18of a node is the reduction of the size of the giant component obtained when the node is disconnected.
Fig.1 shows the performance of the four adaptive strategies based on criteria defined above.It also includes the results of averaging 100 realizations of node selection criteria at random.The WAN has a two-regime power law distribution,more similar to scale-free than to random networks,which explains its resilience against random errors and its vulnerability to intentional attacks.It can also be observed that betweenness and damage criteria outperform degree and eigenvalue.For low values oflbelow 80,damage performs better than betweenness,but betweenness performs better than damage for higher values ofl.This behavior is similar to that obtained in Ref.8 for the WAN constructed with flights scheduled from November 2011 to November 2012.
3.Genetic algorithms
Genetic algorithms(GAs)19,20are a family of algorithms inspired by natural selection processes and extensively used in science and engineering problems.21GAs work with a population of candidate solutions or phenotypes,which are used to evaluate the fitness function for each candidate solution.Solutions with a good fitness can be allowed to mate.To do so,each solution is coded with a genotype.Genotypes of solutions are combined using a crossover operator to generate new individuals that will hopefully have better fitness.Each iteration of this process is known as a generation.In order to prevent the algorithm from being stalled in local optima,genotype of some of the elements of the population is randomly altered by a mutation operator.To ensure that the best solutions are not lost,a small elite of individuals22with good fitness is allowed to pass unchanged to the following generation.
Many implementations of the GA for a given problem are possible,depending on the definition ofits elements.In the GA implementation presented,no distinction has been made between genotype and phenotype:Both are a vector of integers,representing the nodes to be disconnected.The fitness function to be minimized is the size of the giant component after the nodes included in the genotype are disconnected.The population is set ofnpopvectors oflnodes.The vectors of the initial population are generated by picking nodes at random from a candidate list of the 1000 nodes of higher betweenness.The population of each generation is created as follows:
(1)The elite of 4 best-fitting elements is passed straightly to the next generation.
(3)To prevent the algorithm from stalling in local optima,elements are constructed from stratch,in the same way as the ones of the initial population.
(4)The remaining elements of the next generation,until npopelementsare completed,are constructed by mating two elements of the population.All the elements of the previous generation have the same mating probability.The new element is constructed by picking a random number of elements between 2 and l of one of the parents.Theremaining nodes are picked at random from the set of nodes of the second parent,taking care that no node is repeated.
The typical convergence behavior of the algorithm is illustrated in Fig.2(a)with the results of several sample runs of the algorithm with populations of 100 and 400 elements(black and red lines)andl=65.As can be seen,after a number of iterations,the algorithm stalls,failing to produce results better than the A-DAM and A-BET strategies.This is a well-known feature of GA,known as premature convergence:the algorithm converges to a suboptimal solution and despite mutation the differences between individuals tend to be too small.One way to mitigate this problem is the use of islands,23a concept also inspired by natural selection processes.In GA with Islands(GAI),the population is divided in subsets that are not allowed to interact except very scarce migrations of individuals(as in the case of reptiles in archipelagos).This allows each island to converge quicker to a different solution.Then,the individuals that migrate allow the propagation of the best solutions of each island.In Fig.2(b),the results of applying the GAI algorithm are shown.It can be observed that GAI has faster convergence and better results than GA,but it also does not outperform the results of A-DAM and A-BET.
4.Simulated annealing
Simulated annealing(SA)19,24is a probabilistic heuristic,originally inspired in metallurgy annealing processes designed to find an approximation to global optima in large search spaces,either discrete or continuous.The algorithm is based on improving a starting solution s,rather that a whole population as in the case of GA.In our implementation,the stateLis a vector oflnodes to be disconnected.At each step,SA selects randomly a new solutionL',using the mutation operation defined for the GA.Then,the energyE(L')is computed.In the defined implementation,energy is the size of the giant component after the nodes ofLare disconnected.IfE(L')<E(L),the new solution is adopted,thus makingL=L'.To avoid stalling in local extrema,L'can be accepted even ifit is worse thanE(L')≥E(L),with a probability equal to
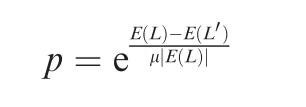
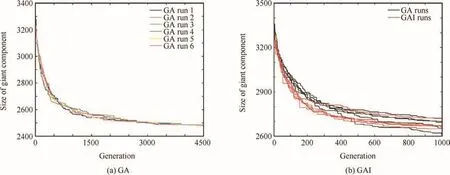
Fig.2 Evolution of size of giant component after several iterations of GA and GAI.
Here μ is a parameter that controls the probability to accept worse solutions.IfL'is not accepted,a new neighboring candidate is selected.Selection of an appropriate value for μ is critical for SA performance.If it is too low,the algorithm becomes conservative,refusing to accept changes that increase the energy but that could eventually lead to a global optimum.If it is too high,SA tends to jump erratically.For the present implementation,values around μ=10-3yield good results,as can be seen in Fig.3(a)where the performance of the SA algorithm as a function of the number of iterations has been represented for different values of μ.
SA algorithm is known to be a good heuristic for complex non-linear problems,but its original formulation cannot exploit modern parallel computers since each iteration depends on the previous solution.Parallel simulated annealing(PSA)algorithms allow for a better use of the available computing resources and the simultaneous exploration of different regions of the search domain.A detailed taxonomy of different ways to implement PSA can be found in Ref.25.In the present study,the clustering algorithm for simulated annealing26has been used.In this approach,each processor explores a different realization of the algorithm.Processors synchronize their states periodically,adopting the best solution available.The iterations proceed until no further improvement is made after a number of synchronizations.The results of the application of this algorithm are reported in Fig.3(b).
By comparing the results reported in Figs.2(b)and 3(a)for GAI and SA respectively with the results of the adaptive strategies in Fig.1,it can be seen that these algorithms do not yield better results than the adaptive strategies.
5.Custom heuristics
An alternative strategy that can be explored in this context is to define heuristics customized for the WAN.In this case,we can take advantage of the fact that adaptive strategies based on damage and betweenness of nodes are particularly effective to break the WAN,defining damage and betweenness improvement heuristics.
The damage improvement heuristic(DIH)starts with a random solution,and starts replacing the element of minimal damage contributioni*(the one whose reconnection leads to a less increase of giant component)with the nodej*of the candidate list whose disconnection together with the rest of the solution minimizes size of giant component.The process is repeated until no size of giant component reduction is obtained,and then the algorithm picks the second element of the list asi*,and so on until thepmaxelement of the list is reached.
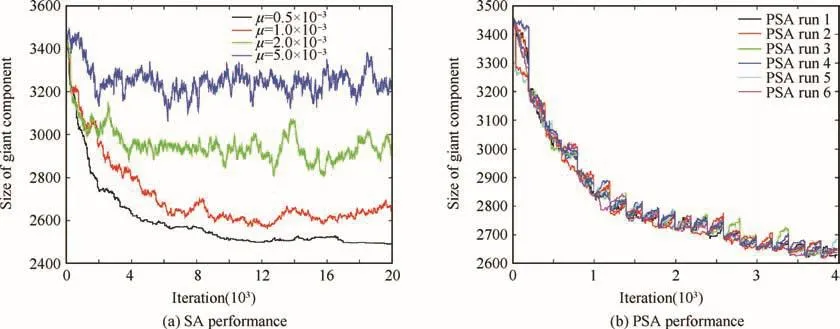
Fig.3 SA performance for several values of μ and performance of several runs of PSA for l=45.
The algorithm pseudocode is listed below.We notate asL-ithe setL{i}resulting from removingifromL(that is,reconnecting a previously disconnected nodei),and asL+jthe setL∪{j}resulting from adding nodejtoL(that is,disconnecting a previously connected nodej).The size of giant component when a particular set of nodesSis disconnected is notated asG(S).
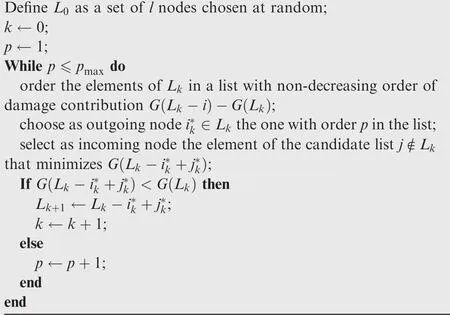

Fig.4 Illustrative evolution of BIH heuristic as iterations proceed and begin with a random vector of l=65.
The betweenness improvement heuristic(BIH)works in a similar way as the DIH.In each iteration,the node with less betweenness,if reconnected,is removed from the current solution,and the node with maximum betweenness,after the reconnection,is added to the solution.The algorithm stops when the node to be entered has been included in any of the previous solutions.The pseudocode of the algorithm is as follows
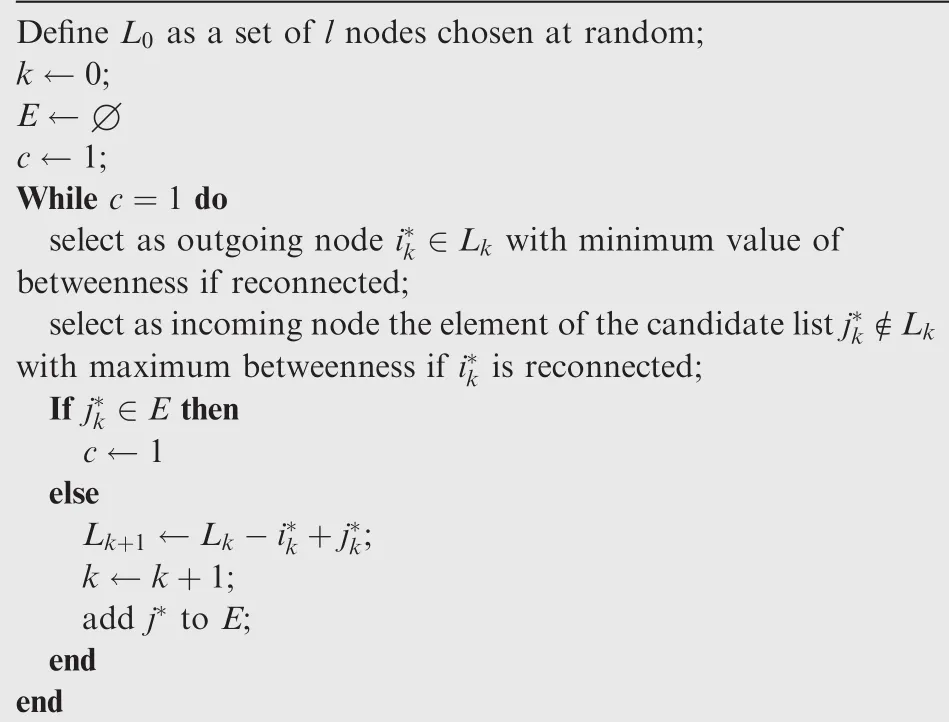
Fig.4 shows how the BIH heuristic works,the betweennessBjandBiof nodes entering and leavingL,and the evolution of giant size component as BIH iterations proceed.Contrary to DIH heuristic,which leads to a progressive reduction of size of giant component,the BIH causes sudden decreases of the size of giant component(in this case,around iterations 5 and 51)once a set of critical nodes of the network is detected.Note also that application of BIH can lead to an increase of the size of giant component in some iterations,so the set of nodes with minimal size of giant component must be retained as final result.
The performance of both heuristics is shown in Fig.5.While DIH reduces the size of the giant node steadily in each iteration,BIH acts in a similar way as A-BET:once a set of critical nodes is disconnected,the size of giant component decreases abruptly.From iteration 40,nodes of high betweenness are disconnected,which leads to a large decrease ofG.

Fig.5 Evolution of size of giant component as a function of number ofiterations for several runs of DIH and BIH heuristics for l=65.
This sudden decrease represents the disconnection of large regions of the WAN from the giant component.
As DIH and BIH break the WAN in different ways,several combinations of the application of both heuristics were tested.The most effective combination involved the following steps:
(1)Apply the DIH heuristic to a random set of L nodes to disconnect.
(2)Apply the BIH heuristic to the solution obtained in the first step.
(3)Apply again the DIH heuristic to the solution obtained in the second step.
The results of applying this multiple betweenness-damage heuristic(MBDH)are represented in Fig.6 for several values ofl,ranging from 10 to 200.It can be seen that,for values ofl>50,this combined heuristic leads to the largest reduction of the size of giant component of all the defined heuristics.
6.Results and discussion
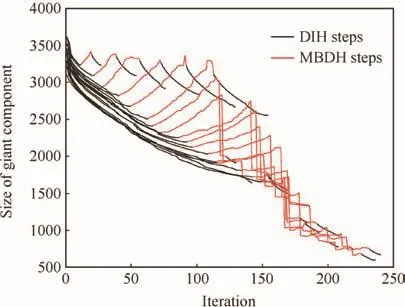
Fig.6 Evolution of size of giant component when applying MBDH heuristics to sets of l=10,20,...,200 nodes.
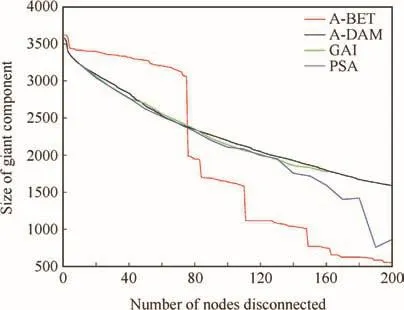
Fig.7 Comparison of adaptive strategies based on damage,betweenness,GAI and PSA.
Application of the random search heuristics(GA,GAI,SA and PSA)beginning from a random set of nodes do not produce results significantly better than the adaptive strategy,as can be seen in Fig.7,for a typical execution of GAI and PSA.For small sets of nodes switched off,GAI and PSA produce results similar to A-BET and A-DAM strategy seems to be less efficient than GAI and PSA,but when it eventually switches off a large portion of the WAN,GAI and PSA cannot compete with it.The search space seems to be too large for random search strategies to identify the most critical nodes.
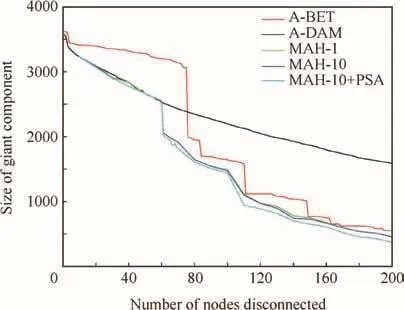
Fig.8 Comparison of adaptive strategies based on damage,betweenness and three different variants of MAH.
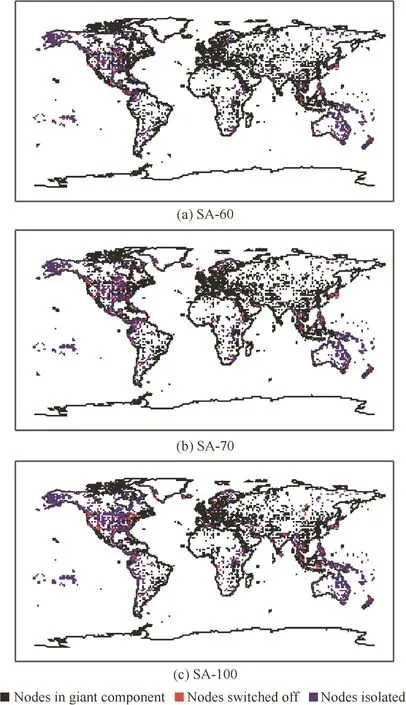
Fig.9 WAN areas isolated by simulated annealing.
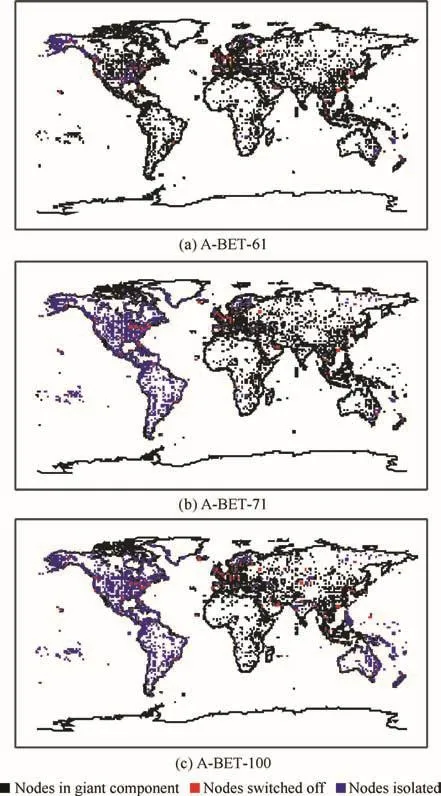
Fig.10 WAN areas isolated by adaptive betweenness.
On the other hand,the application of the custom heuristics designed specifically for the WAN can outperform the adaptive strategy.In Fig.8,the results of three slightly different variants of MAH are compared with A-BET and A-DAM strategies.The green line(MAH-1)is the result of applying MAH heuristic to replacing only the worse node in the DIH step.The blue line(MAH-10)is the result of applying DIH to replacing up to the 10th worse node in the DIH step.Finally,the cyan line is the result of the application of PSA to the results of MAH-10(with μ=10-3,6000 local iterations and 4 threads).
The behavior of the different heuristics can be better understood by examining the spatialstructure ofthe WAN areas unreachable from the giant component after a number of nodes have been switched off(Fig.9 for SA,Fig.10 for A-BET,and Fig.11 for MAH).In these figures are depicted the nodes disconnected by each heuristic,for three values of disconnected nodes.Results show that MAH is more effective than the other two heuristics:with 61 nodes disconnected,American airports are disconnected from the giant component,while in the other two heuristics East Coast and South American airports still belong to the giant component.With 100 nodes disconnected,MAH breaks up the European network,thus leaving America as the giant component.
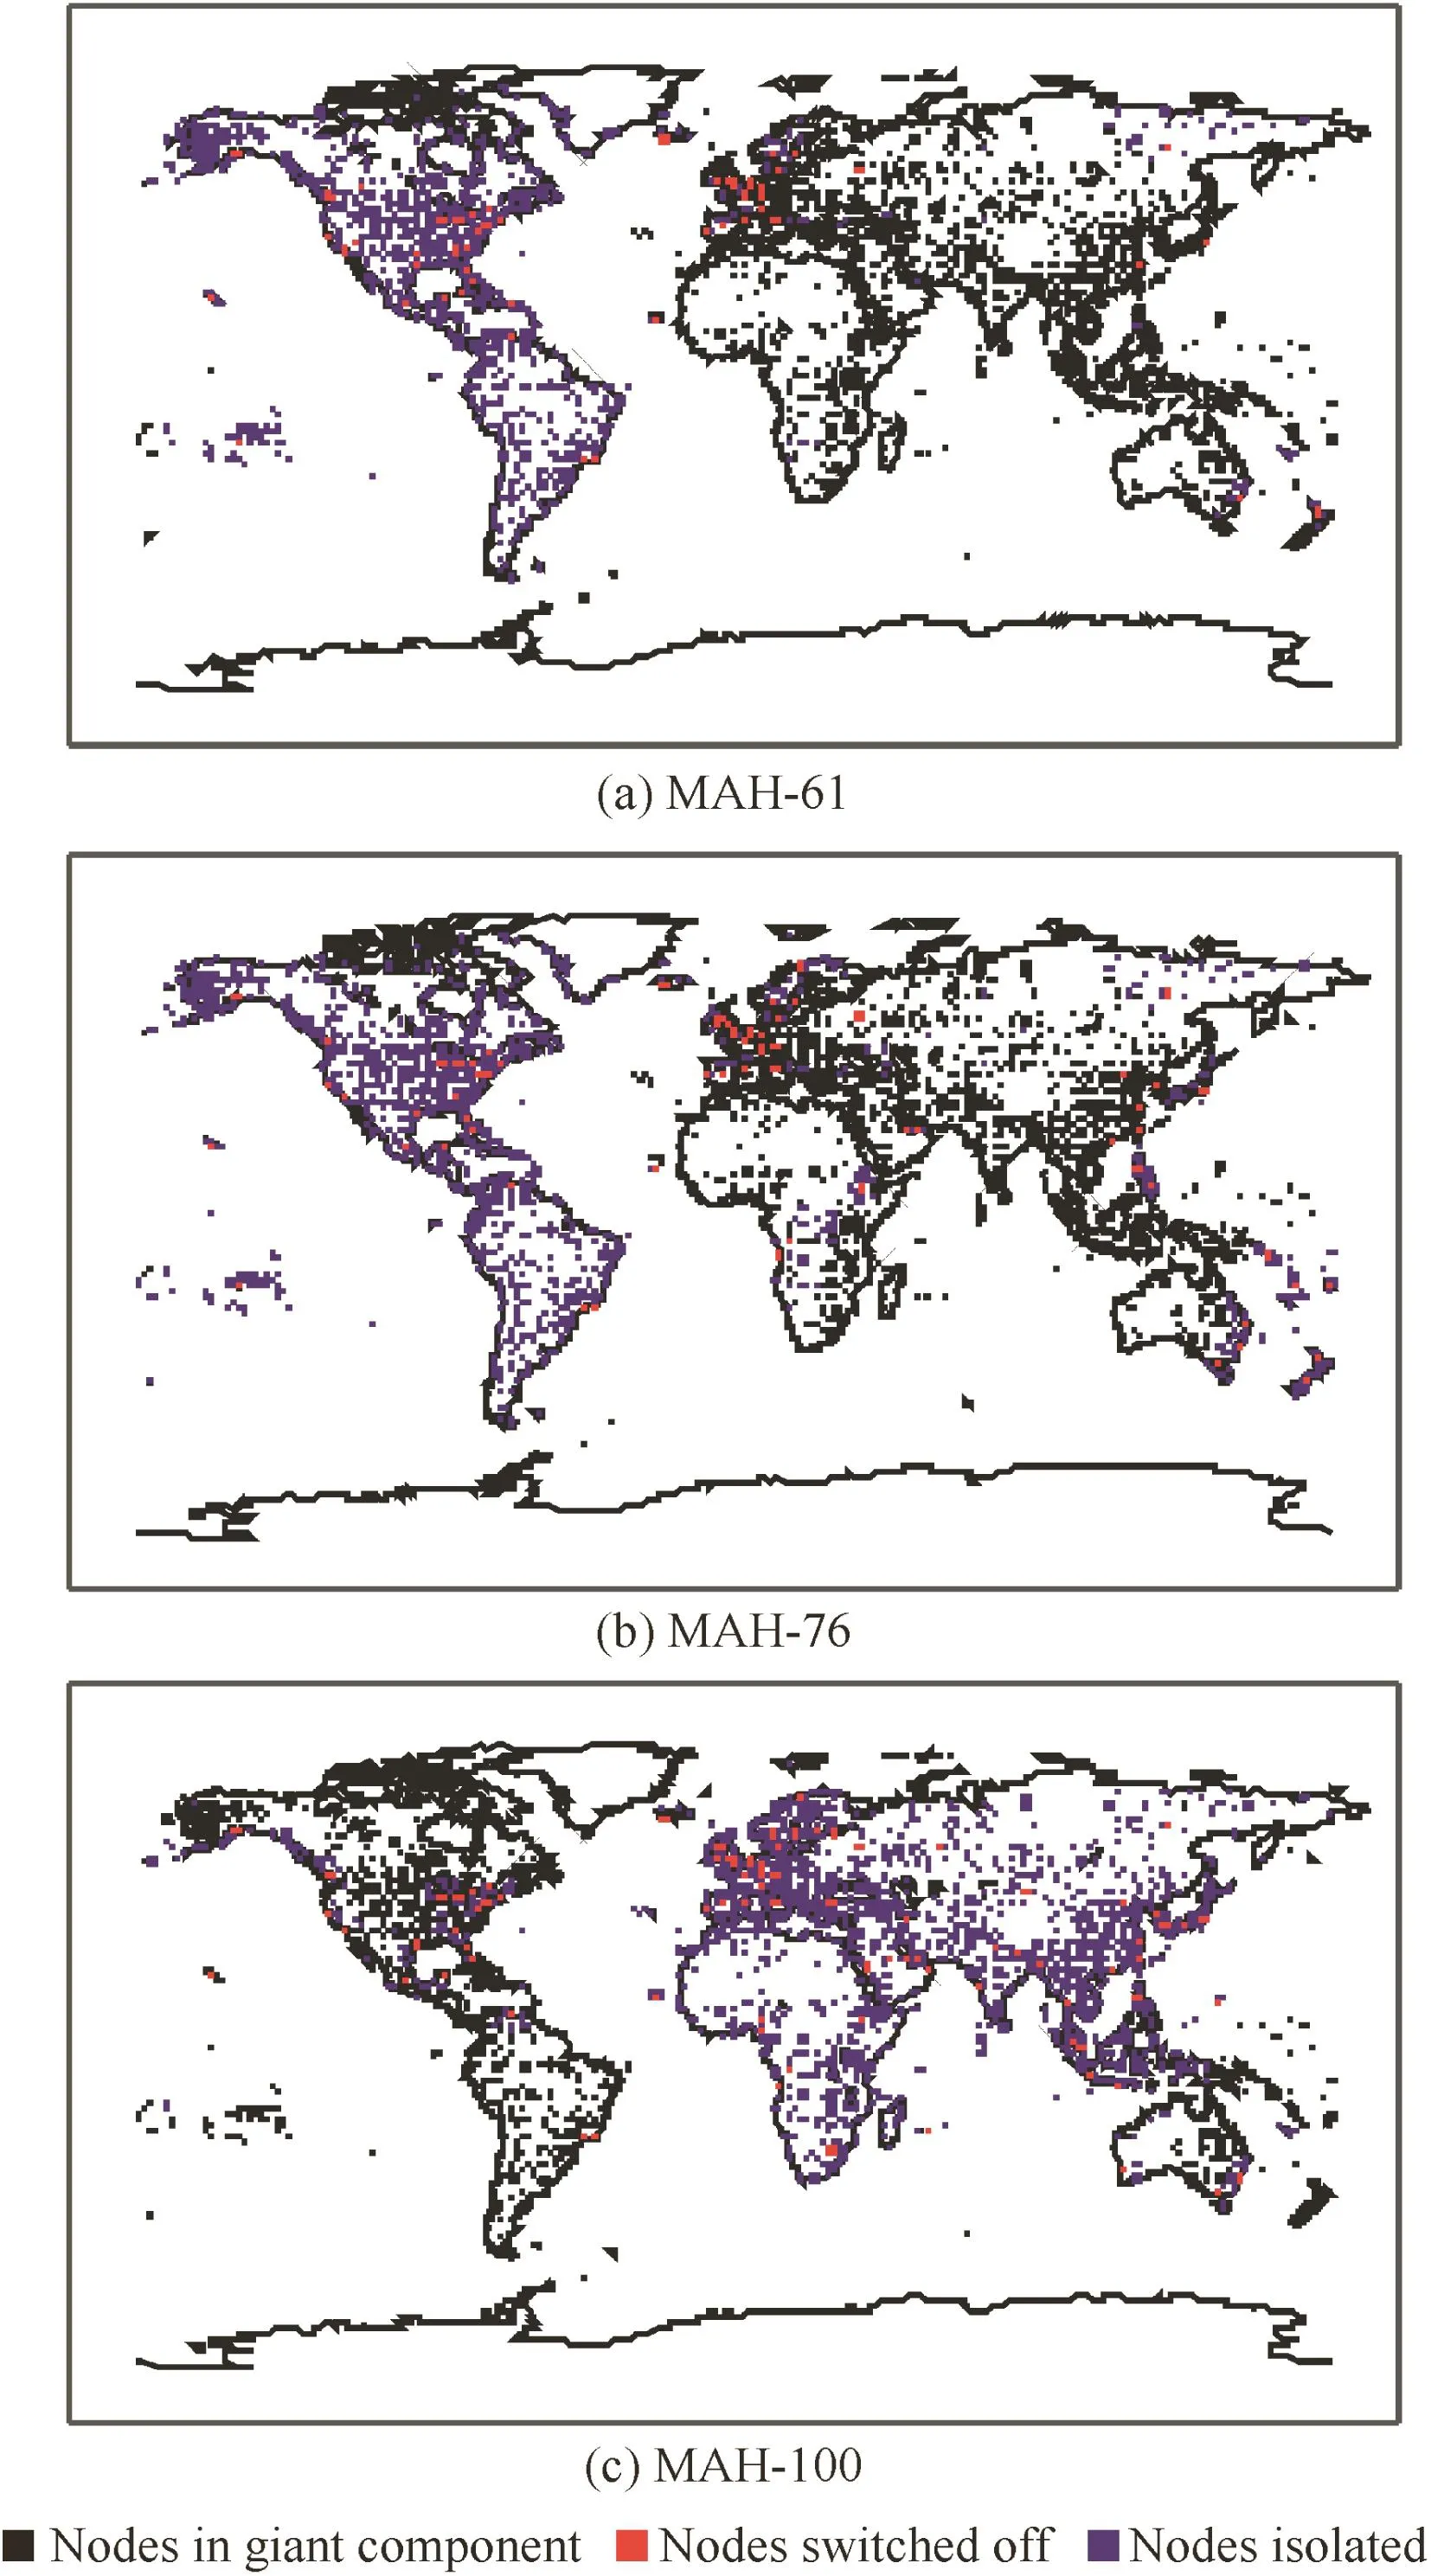
Fig.11 WAN areas isolated by multiple attack heuristic.
7.Conclusions
One of the ways of assessing the robustness of complex networks is through the analysis of the evolution of the size of the giant component as a fraction of isolated nodes.Robustness to errors is assessed through isolation of nodes selected at random,and robustness to attacks through isolation of central nodes,chosen by using a node selection criterion and usually performing an adaptive strategy,where the criterion measure is recalculated after each disconnection.Robust networks will experience a slow decrease of the size of giant component as the number ofisolated nodes increases.
The world airport network(WAN),as other transportation networks,is resilient to errors,but not to attacks.Previous research8has found that adaptive strategies based on node betweenness and node damage are particularly effective to break down the network.This result has been replicated in the sample of WAN used in this research,as is shown in Fig.1.
Several alternative node selection criteria have been tested to find most effective ways to break down the WAN(i.e.,dramatically reduce the size of giant component).Several versions of node selection criteria heuristics based on genetic algorithms(traditional GAs and GAI)and simulated annealing(traditional SA and PSA)have been defined and tested on the WAN.As can be seen in Fig.7,these heuristics alone do not perform better than damage and betweenness adaptivestrategies.
Damage and betweenness heuristics behave differently when the network is broken up.As seen in Fig.1,while damage steadily reduces the size of giant component as the number of isolated nodes increases,betweenness reduces it abruptly,once it detects a set of central nodes which isolates a large region of the WAN.Based on this fact,specific custom heuristics based on damage and betweenness(DIH and BIH)have been defined.These heuristics amplify the effect of damage and betweenness adaptive strategies.The best results are obtained when these heuristics are applied sequentially in a multi-attack heuristic MAH.Performance of the resulting algorithm can be enhanced if a PSA heuristic is applied to the result of the MAH,as indicated in Fig.8.
These results represent a meaningful contribution not only to the analysis of robustness of complex networks,6but also to the critical node detection(CNP)problems on graphs.13On the one hand,the MAH heuristic helps us to deepen our understanding of the mechanisms that drive robustness of complex networks,and in particular offlight networks.On the other hand,CNP literature can benefit from the fact that some algorithms can be particularly effective for specific networks,as usually CNP heuristics are defined without considering network structure.More researches are encouraged to find specific heuristics to other complex networks,such as the power grid,7which can help us to better understand the structure of complex networks.
1.Lordan O,Sallan JM,Simo P.Study of the topology and robustness of airline route networks from the complex network approach:a survey and research agenda.J Transp Geogr2014;37:112–20.
2.Brooker P.Fear in a handful of dust:aviation and the Icelandic volcano.Significance2010;7(3):112–5.
3.Mazzocchi M,Hansstein F,Ragona M.The 2010 volcanic ash cloud and its financial impact on the European airline industry.Cesifo Forum2010;11(2):92–100.
4.Zanin M,Lillo F.Modelling the air transport with complex networks:a short review.Eur Phys J Spec Top2013;215(1):5–21.
5.Baraba´si AL.Emergence of scaling in random networks.Science1999;286(5439):509–12.
6.Albert R,Jeong H,Baraba´si AL.Error and attack tolerance of complex networks.Nature2000;406(6794):378–82.
7.Petreska I,Tomovski I,Gutierrez E,Kocarev L,Bono F,Poljansek K.Application of modal analysis in assessing attack vulnerability of complex networks.Commun Nonlinear Sci Numer Simul2010;15(4):1008–18.
8.Lordan O,Sallan JM,Simo P,Gonzalez-Prieto D.Robustness of the air transport network.Transp Res Part E:Logis Transp Rev2014;68(68):155–63.
9.Lordan O,Sallan JM,Simo P,Gonzalez-Prieto D.Robustness of airline alliance route networks.Commun Nonlinear Sci Numer Simul2015;22(1–3):587–95.
10.Du W,Gao Y,Liu C,Zheng Z,Wang Z.Adequate is better:particle swarm optimization with limited-information.Appl Math Comput2015;268:832–8.
11.Du WB,Ying W,Yan G,Zhu YB,Cao XB.Heterogeneous strategy particle swarm optimization.IEEE Trans Circ SystⅡExpress Briefs2017;64(4):461–71.
12.Gao Y,Du W,Yan G.Selectively-informed particle swarm optimization.Sci Rep2015;5:9295.
13.Pullan W.Heuristic identification of critical nodes in sparse realworld graphs.J Heurist2015;21(5):577–98.
14.Veremyev A,Prokopyev OA,Pasiliao EL.An integer programming framework for critical elements detection in graphs.J Combin Optimiz2014;28(1):233–73.
15.Veremyev A,Prokopyev OA,Pasiliao EL.Critical nodes for distance-based connectivity and related problems in graphs.Networks2015;66(3):170–95.
16.Guimera`R,Mossa S,Turtschi A,Amaral LaN.The worldwide air transportation network:anomalous centrality,community structure,and cities’global roles.Proc Natl Acad Sci USA2005;102(22):7794–9.
17.Bonacich P.Power and centrality:A family of measures.Am J Sociol1987;92(5):1170–82.
18.Latora V,Marchiori M.Vulnerability and protection of infrastructure networks.Phys Rev E2005;71(1):015103.
19.Brownlee J.Clever algorithms:nature-inspired programming recipes.Lulu.com2011;61(9):1278–89.
20.Holland JH.Adaptation in natural and artificial systems:an introductory analysis with applications to biology,control,and artificial intelligence.Massachusetts:MIT Press;1992.
21.Gen M,Cheng R.Genetic algorithms and engineering optimization.New York:John Wileyamp;Sons;2000.
22.Murata T,Ishibuchi H,Tanaka H.Multi-objective genetic algorithm and its applications to flowshop scheduling.Comput Ind Eng1996;30(4):957–68.
23.De Jong KA.Evolutionary computation:A unified approach.Massachusetts:MIT Press;2006.
24.Kirkpatrick S,Gelatt CD,Vecchi MP.Optimization by simulated annealing.Science1983;220(4598):671–80.
25.Greening DR.Parallel simulated annealing techniques.Physica D1990;42(1–3):293–306.
26.Ram DJ,Sreenivas T,Subramaniam KG.Parallel simulated annealing algorithms.JParallelDistribComput1996;37(2):207–12.
14 July 2016;revised 8 October 2016;accepted 17 February 2017
Available online 14 June 2017
*Corresponding author.
E-mail address:oriol.lordan@upc.edu(O.LORDAN).
Peer review under responsibility of Editorial Committee of CJA.
Production and hosting by Elsevier
http://dx.doi.org/10.1016/j.cja.2017.04.012
1000-9361©2017 Chinese Society of Aeronautics and Astronautics.Production and hosting by Elsevier Ltd.
This is an open access article under the CC BY-NC-ND license(http://creativecommons.org/licenses/by-nc-nd/4.0/).
Adaptive strategy;
Air route networks;
Complex networks;
Intentional attacks;
Network robustness
杂志排行
CHINESE JOURNAL OF AERONAUTICS的其它文章
- Wake structure and similar behavior of wake profiles downstream of a plunging airfoil
- Self-sustained oscillation for compressible cylindrical cavity flows
- Numerical studies of static aeroelastic effects on grid fin aerodynamic performances
- A new vortex sheet model for simulating aircraft wake vortex evolution
- Linear stability analysis of interactions between mixing layer and boundary layer flows
- Aerodynamic multi-objective integrated optimization based on principal component analysis