Relationship between frequency spectrum characteristics and vibration responses of Ginkgo biloba trees during mechanical harvesting operation
2017-11-01LinHuanXuLinyunZhouHongpingXuanYanJiaZhichengChenQing
Lin Huan, Xu Linyun, Zhou Hongping, Xuan Yan, Jia Zhicheng, Chen Qing
Relationship between frequency spectrum characteristics and vibration responses oftrees during mechanical harvesting operation
Lin Huan, Xu Linyun※, Zhou Hongping, Xuan Yan, Jia Zhicheng, Chen Qing
(210037,)
Mechanical harvesting is the most effective method for the forest fruit harvesting. Under forced vibration, the removal of fruits is affected by not only the excitation amplitude, frequency, and duration, but also the morphology and inherent frequency spectrum characteristics of the fruit tree itself.In order todiscover the relationship between the frequency spectrum characteristics and the vibration responses and attain the difference among the vibration responses in different directions, the frequency spectrum of a small Y-shapedtree in different directions was tested under the impact excitation in the laboratory. Then the spatial acceleration response under the harmonic excitation was detected at the frequency of the peak and trough points in the frequency spectrum curves. Results of this study indicate that there was a corresponding relation between the frequency spectrum characteristicsand vibration responses. Strong vibration response couldn’t be induced by thefundamental frequency and the frequency lower than 10.00 Hz. The maximal amplitudes could be tested at the resonant frequency but the values were small at low frequency and increased as the excitation frequency increased. When the excitation frequency was higher than 25.00 Hz, stronger acceleration response couldn’t be induced again. The optimal excitation frequency was 23.75 Hz for the small Y-shapedtree. At the same testing position, vibration responses in three directions exhibited the similar characteristics but different amplitudes. The acceleration amplitude in the direction parallel to the growing orientation of trees increased significantly as the testing position was located away from the excitation point. At the same time, this direction was the dominant direction during the process of the vibration response transmission. This suggests that during the mechanical harvesting of forest fruits, the frequency spectrum of trees could be firstly tested to obtain the resonant frequency. Then trees could be excited under the certain resonant frequency to achieve strong vibration response. Higher excitation frequency didn’t necessarily induce stronger vibration response.There was difference among different directions at the same testing position and fruits on different positions could be removed by the inertial force in different directions.
mechanization; vibrations; harvesting; acceleration; frequency spectrum;
0 Introduction
is one of the oldest species of tree dating back 300 million years. The seed has the high value of edible and medicine[1-4]. The planting area in China is about 1 213 million hm2and accounts for 90% of the world’sresources.Because the harvesting time is intensive and the availability of skilled labor is uncertain, harvesting operation is seen as one of the most time-consuming and labor-intensive operations in forest fruit production[5-7]. Current harvest techniques mainly use the mechanical vibration to shake the fruit trees. The advantage of the vibratory harvest is that the mature fruits could be separated quickly and efficiently[8-10]. During the vibratory harvest, vibratory energy is transmitted to fruiting limbs and then converted into the inertial force on fruit-stems. Fruits removal will occur when the inertial force exceeds the bonding force between the stem and fruit[11-14].
In order to improve the removal efficiency of forest fruits and reduce the damage to the trunk, many researchers conducted experiments on the harvest of mango, lime, apricot, et al[15-17].Many tests and analyses reflected that excitation amplitude, frequency, duration and position affected the removal efficiency and fruit damage of fruits[18-22]. In addition, Mateev et al[23]established a probabilistic model describing mathematically the vibratory fruit removal under different specified harvest conditions and validated the precision of the model. Wang et al[24]established the mathematic model between the excitation amplitude, frequency, position and the removal efficiency of blackcurrant.
The removal of fruits is affected by not only the excitation amplitude, frequency, and duration, but also the morphology and inherent dynamic characteristics of the fruit tree itself. Fruit tree generally grows into the branch-on-branch structure and the limb vibration induced by the external force is often unevenly distributed on different parts of the tree[25]. Therefore, the tree modelwas developed by a simulation tool and the dynamics analysis was solved by the finite element software (ANSYS Workbench)[26-28]. Wang et al[29]attained the modal parameters of blackcurrant branches by using the stepping sinusoidal excitation, one-point excitation and multi-point acceleration response method. During the process of vibration energy transmission, the resonant frequencies of fruittrees could be identified by seeking the peak displacement or acceleration amplitude of limbs under different vibration frequencies. Then the dynamic responses of thetrees and the relative kinetic energy ratio were tested under the specific resonant frequencies[30-34]. However, few experiments were conducted on the inherent frequency spectrum characteristics oftrees. At the same time, the dynamic responses oftrees excited at the frequency of the peak and trough points in frequency spectrum curves have not been detected. Although the spectral analysis method was the conventional method during the signal analysis, the frequency response characteristics between the anisotropic live trees and the isotropous metal components had no comparability.
Therefore, the current work was to discover the relationship between the frequency spectrum characteristics and the vibration responses by determining the acceleration responses in spatial directions under the impact and harmonic excitations on atree.
1 Materials and methods
1.1 Experimental materials and distribution of testing positions
A small Chinesetreewas selected as the experimental specimen from Nanjing Forestry University (Nanjing, Jiangsu Province, China, 32.1°N, 118.8°E). As shown in Fig. 1, it mainly consisted of a trunk, two first branches1and2originating from the trunk. Both the branches were almost located in the same perpendicular plane. During the experiment, the root segment below position0was fixed vertically using clamps to ground. Testing positions1was located at the crotch node and the other testing positions were averagely arranged according to the length of each branch.Every testing position was marked by a white circle. The major branch indexes and their geometric parameters were listed in Table 1. The experiment was conducted immediately after the tree specimen was delivered to the laboratory (16th-18th March, 2017). The relative humidity of the laboratorywas maintained at 60% and the temperature was controlled at 25 ℃.

Note: A is trunk of the Ginkgo biloba tree; A1 is testing position; B1 and B2 are two first branches originating from the trunk A.

Table 1 Dimension parameters of a Ginkgo biloba tree
1.2 Method of testing the fundamental frequency and damping ratio
The fundamental frequency could be concluded by the pull-release test. Testing equipment included a laser displacement sensor (OD-P85W20I0, SICK-Sensor Intelligence, Waldkirch, Germany), a 12 V steady voltage supply (YU1220, Guangzhou Meanwell Electronic Product Co., Ltd. Guangzhou, China), a data acquisition device (HRU-420E, Shanghai Horizon Electronic Technology Co., Ltd. Shanghai, China), and a vibration testing and analysis software (HRsoft-DW V1.3, Shanghai Horizon Electronic Technology Co., Ltd. Shanghai, China). A rope was tied on the trunk, then pulled and released to exert the step force on the tree specimen. The laser focused on a position 200 mm below the crotch node1. The fundamental frequency0, and damping ratiocould be calculated by equation (1) and (2), respectively.
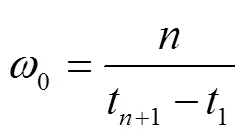

Where1andP+1are the first and (+1) peak values,1andt+1are the corresponding time to reach these two peaks in the displacement attenuation curve (Fig.2).

Note: P1 and Pn+1 are the first and (n+1) peak values, t1 and tn+1 are the corresponding time to reach these two peaks in the displacement attenuation curve.
1.3 Method of testing the frequency spectrum characteristics and vibration
The frequency spectrum characteristics of tree specimen were induced by the impacting force produced by an impact hammer (LC-02A, Jiangsu Sinocera Piezotronics Inc, Yangzhou, China). By computing the power spectrum with the recording and analyzing software (CRAS V7.1, The First Test Software Engineering, Co., Ltd, Nanjing, China), the frequency under the peak and trough points could be indicated.
The vibration response testing equipment consisted of a single-eccentric type excitation motor(Puta Vibrating Motor, Xin Jia Hong Technology Co., Ltd. Shenzhen, China), a frequency converter (JVFT-S5, Jinhui Instrumentation, Co., Ltd. Shenzhen, China), four triple-axis accelerometers (CA-YD-141, Jiangsu Sinocera Piezotronics Inc, Yangzhou, China), two charge amplifiers (YE5853A, Jiangsu Sinocera Piezotronics Inc, Yangzhou, China), and three data acquisition units (NI cDAQ-9174, The National Instrument Co., Ltd, USA).
The excitation motor was fixed at a position 400 mm below the crotch node1. The growing orientation of tree sample was treated as-direction. The direction parallel to the rotating center of the motor and the center of the tree sample was treated as-direction. As shown in Fig. 1,-direction was vertical to these two directions.The triple-axis accelerometer could record the acceleration signals in three directions under impact and harmonic excitations. During the experiment, when the treatments of four testing positions were completed, the accelerometers were moved to the next four testing positions until all positions were completed. The same treatment of each testing position was repeated three times.
To describe the transmission characteristics of the dynamic response along the branches on thetree, the dynamic acceleration transmission ratio (DATR) was defined using the following equation[35].
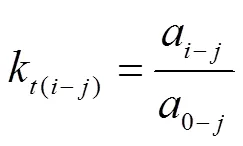
Wherek(i-j)is the DATRof the testing positionindirection,ais the accelerationof the testing positionindirection,0-jis the accelerationof the reference position indirection. In this paper, the testing position1was regarded as the reference position.
2 Results and discussion
2.1 Frequency spectrum characteristics
For thetree illustrated in Fig. 1, through pull-release test, the fundamental frequency was 1.88 Hz and damping ratio was 0.05 by calculation of equations (1) and (2) whenwas selected as 10 in Fig.2.
By the impact excitation test, the acceleration curve as a function of time could be attained. The power spectrum curves were shown in Fig.3 by the frequency spectrum treatment. Since the appropriate excitation frequency was generally 10-30 Hz for the fruit harvesting[23-24,36], the maximum analysis bandwidth in the power spectrum was 30 Hz.
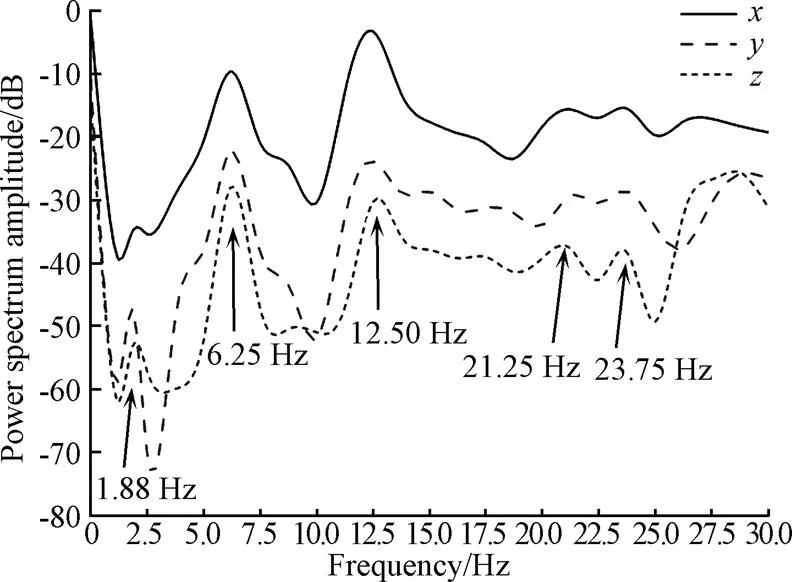
Fig.3 Power spectrum of testing position A1
In accordance with the pull-release test, the first resonant frequency was also 1.88 Hz for the power spectrum curves in three directions from Fig.3. The following common resonant frequencies were 6.25, 12.50, 21.25 and 23.75 Hz. For the power spectrum in-direction, the curve also presented the peak point at 27.50 Hz. Both the curves in-direction and-direction showed another obvious peak point at 28.75 Hz. This revealed that there was consistency among the frequency spectrum characteristics in different directions at the same testing position.
2.2 Acceleration amplitude under harmonic excitation
There were still slight peak and trough points on the power spectrum curves in three directions. In order to study the relationship between the frequency spectrum characteristics and the vibration responses, tree specimen was excited under the frequency where the apparent and slight peak and trough peaks occurred in the power spectrum curves.
Testing position1located at the top of the trunk and was the crotch node between branches1and2. As shown in Fig.4, the vibration responses at the fundamental frequency 1.88 Hz were weak in three directions and the lowest value 0.17 m/s2occurred in-direction. At the resonant frequency 6.25 Hz, the maximal values in three directions were respectively 5.14, 5.71 and 1.04 m/s2. However, the values were only 0.74-2.32 m/s2at 10.00 Hz, where the trough point occurred in the power spectrum curves (Fig.3). At the third resonant frequency 12.50 Hz, vibration responses were strengthened again. Meanwhile, the value in-direction was 2.7 times larger than that in-direction. As the frequency increased continuously, the acceleration amplitudes in three directions presented gradually increasing trend and exhibited the maximal values 46.60, 40.12 and 28.94 m/s2at the fifth resonant frequency 23.75 Hz. When the frequency increased to 25.00 Hz, the acceleration amplitudes decreased obviously and almost remained unchanged under higher frequency. A possiblereason for this was that the vibratory energy was weak at 25.00 Hz due to the existence of the trough point in the power spectrum. Although there was another resonant frequency 27.50 Hz, stronger acceleration response couldn’t be induced again.

Fig.4 Acceleration amplitude of testing position A1
As shown in Fig. 5a, the vibration responses on branch1were also weak at the resonant frequencies 1.88 and 6.25 Hz. At 10.00 Hz, the acceleration amplitudes exhibited the minimal values in consistence with the characteristics of the testing position1. The maximal values also occurred at the third resonant frequency 12.50 Hz. Meanwhile, the values 10.38, 10.33 and 12.82 m/s2at the testing position11were much smaller than those at the latter two testing positions shown in Fig.5a. As the frequency increased, the acceleration amplitudes generally presented decreasing trend. However, when the frequency was higher than 17.50 Hz, all the values increased sharply and attained another maximal values at the fifth resonant frequency 23.75 Hz. At the testing position11, the acceleration amplitudes in three directions were 157.44, 118.04 and 115.82 m/s2. However, at the testing positions12and13, the values in-direction were only 64.90 and 95.67 m/s2. By contrast, the values in-direction attained the maximums 161.09 and 180.94 m/s2. Similarly to the testing position1, the acceleration responses decreased at 25.00 Hz and didn’t change obviously at higher frequency.
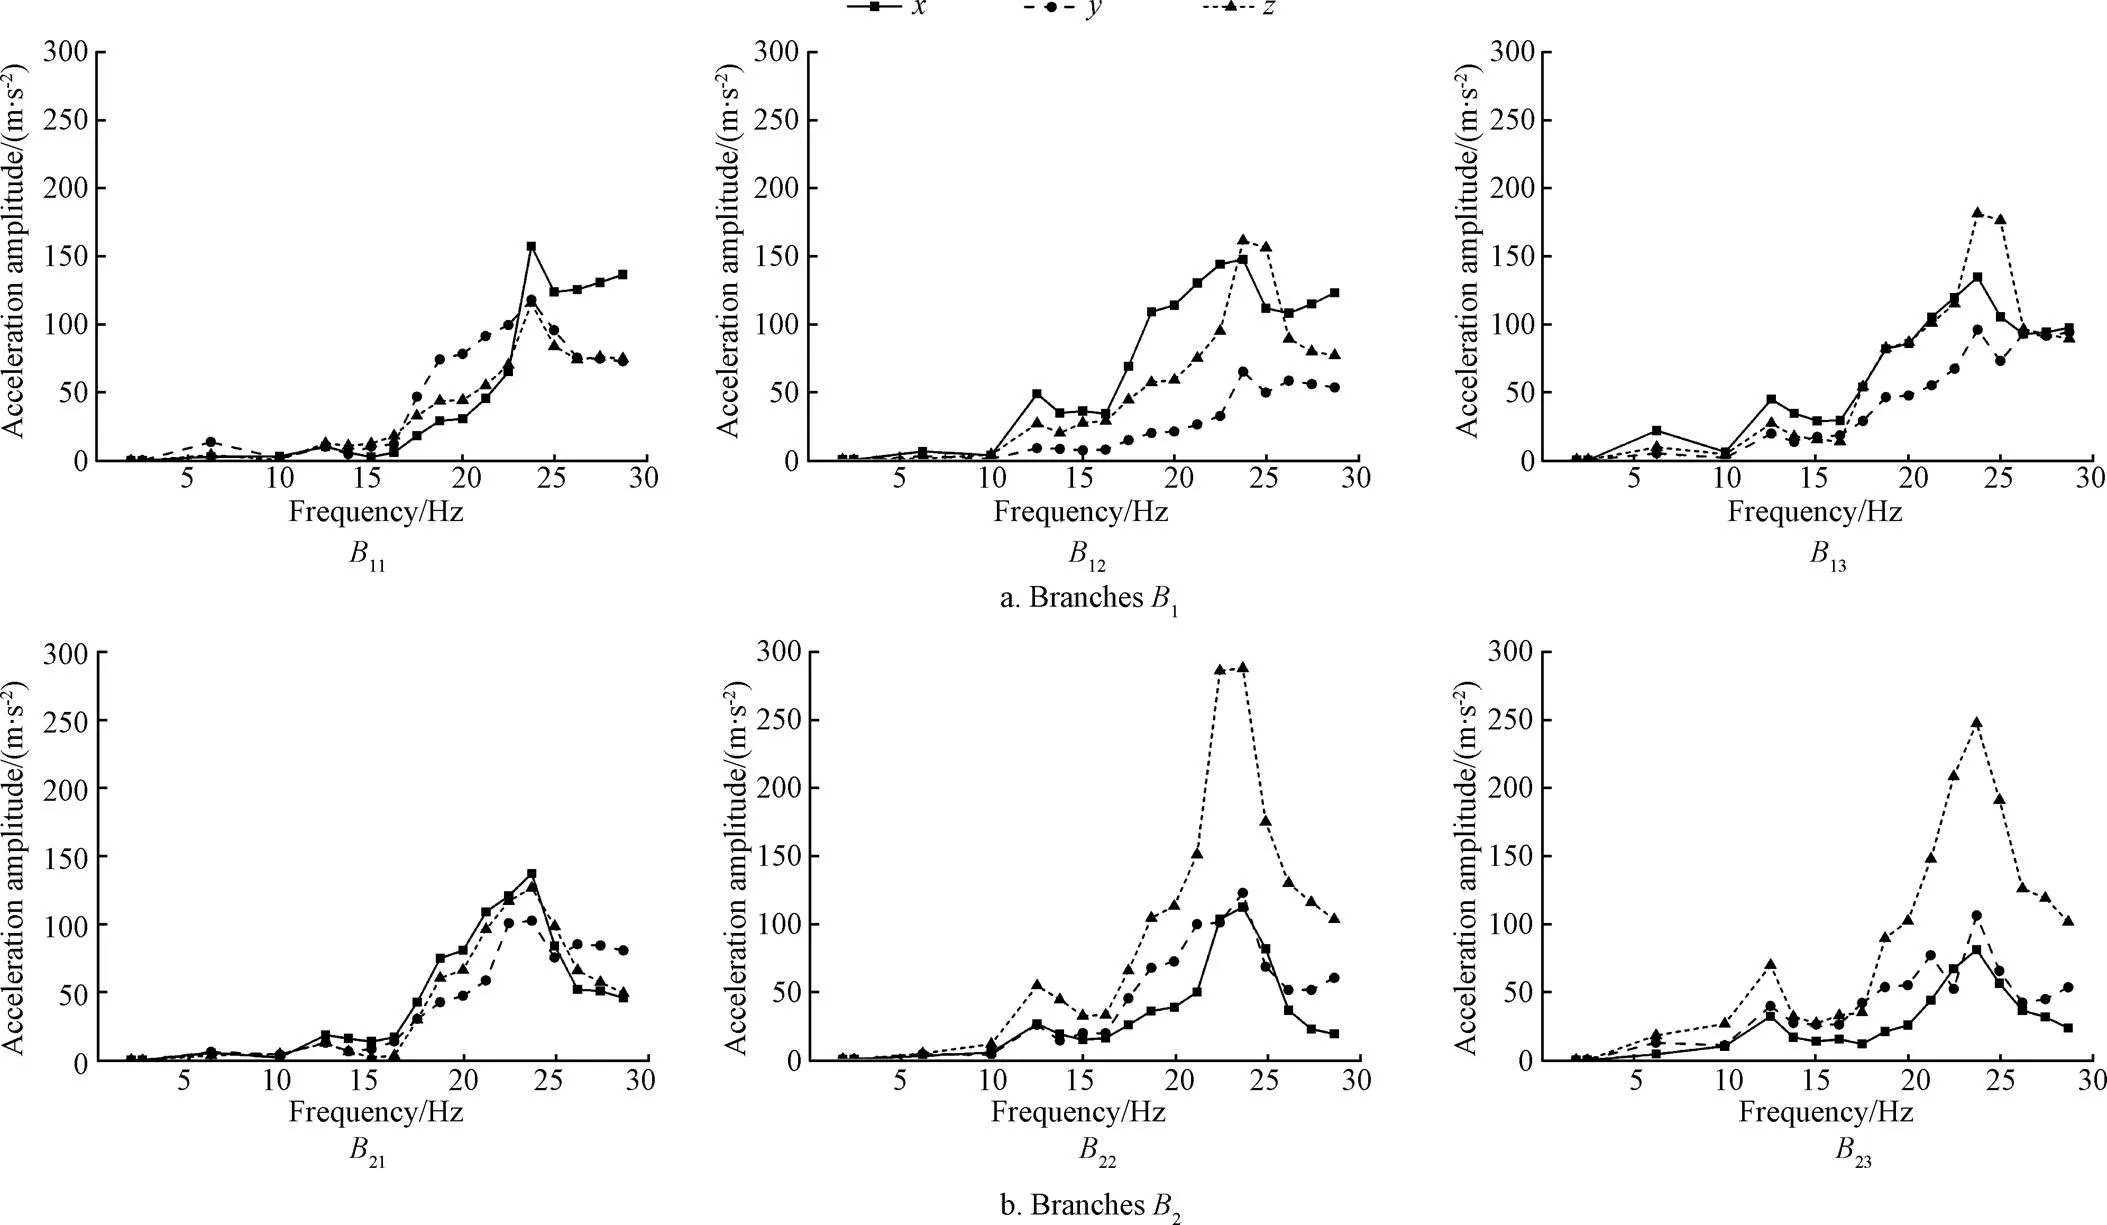
Fig.5 Acceleration amplitudes of testing positions on branches B1 and B2
Similarly to the testing position1and branch1, the vibration responses on branch2were also weak at the low resonant frequencies 1.88 and 6.25 Hz (Fig. 5b). At 10.00 Hz, all the values were small except for the value 26.80 m/s2in-direction at the testing position23. The acceleration amplitudes of three testing positions peaked at the third resonant frequency 12.50 Hz. In addition, the largest value occurred in-direction at the testing position21but in-direction at the testing positions22and23(Fig.5b). At the frequency band 12.50-17.50 Hz, the acceleration amplitudes were small and exhibited the minimums at 15.00 Hz. As the frequency increased continuously, the acceleration amplitudes increased significantly and attained the maximums at the resonant frequency 23.75 Hz. At the testing position21, the values in three directions were 137.05, 103.34 and 126.43 m/s2. For the following testing positions22and23, the values in-direction and-direction didn’t fluctuate a lot while the values in-direction increased sharply to 287.32 and 247.22 m/s2. Compared with the acceleration amplitudes in-direction on branch1, the values were larger on branch2.At the following frequencies, the vibration responses generally presented decreasing trend. Although at the resonant frequency 27.50 Hz, greater acceleration amplitude couldn’t be detected again.
Therefore, there was a correspondence between the frequency spectrum characteristics and the vibration responses. The maximal amplitudes could be induced by the resonant frequency but the values were small at low frequency and increased as the excitation frequency increased. However, at the frequency higher than 25.00 Hz, stronger acceleration response couldn’t be induced again. In this study, the optimal excitation frequency was 23.75 Hz for thetree. The vibration responses in three directions exhibited the similar characteristics but different acceleration amplitudeson the tree specimen. The values in-direction were small at the testing positions near the crotch node but increased significantly at the latter two testing positions on branches. This reflected that fruits on different positions were removed by the traction force in different directions.
2.3 Dynamic acceleration transmission characteristics
In order to study the transmission characteristics of the dynamic response and the difference among three directions, the DATR was calculated by equation (3). Only the acceleration amplitudes under two resonant frequencies 12.50 and 23.75 Hz were analyzed because they were identified as the most effective bands of excitation.
As shown in Table 2, at 12.50 Hz, there were some DATRs in-direction and-directionwere lower than 1.00, reflecting the attenuation of the vibration response. The minimum 0.39 in-direction and 0.42 in-direction appeared at the testing position11and12, respectively. As the testing position was located away from the crotch node, the values in-direction and-direction generally exhibited slight increase.By contrast, all the DATRs in-direction were greater than 1.00. The values increased slowly along branch1but sharply along branch2. In addition, the maximum reached 9.61 at the testing position23.

Table 2 Obtained dynamic acceleration transmission ratio in three directions at different resonant frequencies
At the high resonant frequency 23.75 Hz, the values in-direction and-direction were 1.62-3.38, which were larger than the values at 12.50 Hz. As the testing position was located away from the crotch node, the values in-direction and-direction generally exhibited slight decrease. However, in-direction, the DATRs increased significantly along two branches. Since the value at the testing position23slightly reduced, the maximum 9.93 occurred at the testing position22. Similarly to the characteristics at 12.50 Hz, branch2had greater DATR than that on branch1.
The increase in excitation frequency was beneficial to improve the efficiency of vibration responsetransmission. The effect of the testing position on the DATR was weak in-direction and-direction but strong in-direction. Meanwhile, there were greater DATRand increase amplitude in-direction.A possiblereason for this was that the crotch angle between the testing positions increased along the growing direction of branches and strengthened the vibration response in-direction. Therefore, the dynamic response transmitted to branches was mainly in-direction.
3 Conclusion and discussion
Test with the impact excitation and pull-release test revealed the same fundamental frequency 1.88 Hz for the tree specimen. At the same testing position, the frequency spectrum characteristics in different directions exhibited the consistency.
Generally, there was a corresponding relation between the frequency spectrum characteristicsand vibration responses. Strong vibration response couldn’t be induced by the fundamental frequency and the frequency lower than 10.00 Hz. The maximal amplitudes could be tested at the resonant frequency but the values were small at low frequency and increased as the excitation frequency increased. At the frequency higher than 25.00 Hz, stronger acceleration response couldn’t be induced again. The maximums occurred at the resonant frequency 23.75 Hz. This suggested that during the mechanical harvesting of fruits, the frequency spectrum of trees could be firstly tested to obtain the resonant frequency higher than 20.00 Hz but lower than 25.00 Hz. Then trees could be excited under the certain resonant frequency to achieve strong vibration response. Higher excitation frequency didn’t necessarily induce stronger vibration response.
The vibration responses in three directions exhibited the similar characteristics but different acceleration amplitudeson the tree specimen. At the testing positions near the crotch node, there was almost no difference among the acceleration amplitudes in three directions. However, at other testing positions, the value in-direction was much larger than the values in-direction and-direction. During the process of the vibration response transmission, the acceleration response in-direction was gradually strengthened while the values of-direction and-direction almost remained unchanged. This reflected that-direction was the dominant direction and fruits on the top of branches could be removed by the traction force in-direction.
The morphology of trees mainly contains monopodial branching and sympodial branching. The Y-shaped tree was representative. In future research, trees with other shapes could be tested to verify if the results of this study were universal.
[1] Sierpina V S, Wollschlaeger B, Blumenthal M. Ginkgo biloba[J]. American Family Physician, 2003, 68(5): 923-926.
[2] Zhang Hui, Wang Zhang, Xu Shiying. Optimization of processing parameters for cloudy ginkgo (Linn.) juice[J]. Journal of Food Engineering, 2007, 80: 1226-1232.
[3] Diamond B J, Shiflett S C, Feiwel N, et al.extract: Mechanisms and clinical indications[J]. Archives of Physical Medicine and Rehabilitation, 2000, 81(5): 668-678.
[4] Guo Jing, Wang Guibin, Feng Chaonian, et al.The model classification and comprehensive benefits evaluation of ginkgo under-forestry economy[J]. Journal of Central South University of Forestry & Technology, 2017, 3(1): 118-122.
[5] Sanders K F. Orange harvesting systems review[J]. Biosystems Engineering, 2005, 90(2): 115-125.
[6] Chen Du, Du Xiaoqiang, Wang Shumao, et al. Mechanism of vibratory fruit harvest and review of current advance[J]. Transactions of the Chinese Society of Agricultural Engineering (Transactions of the CSAE), 2011, 27(8): 195-200.
[7] Gupta S K, Ehsani R, Kim N H. Optimization of a citrus canopy shaker harvesting system: Mechanistic tree damage and fruit detachment models[J]. Transactions of the ASABE, 2016, 59(4): 761-776.
[8] Wang Changqin, Xu Linyun, Zhou Hongping, et al. Development and experiment of eccentric-type vibratory harvester for forest-fruits[J]. Transactions of the Chinese Society of Agricultural Engineering (Transactions of the CSAE), 2012, 28(16): 10-16.
[9] Peterson D L. Harvest mechanization progress and prospects for fresh market quality deciduous tree fruits[J]. HortTech, 2005, 15(1): 72-75.
[10] Du Xiaoqiang, Ni Ke’nan, Pan Ke, et al. Parameter optimization of stroke-adjustable and monodirectional pulling fruit harvester[J]. Transactions of the Chinese Society of Agricultural Engineering (Transactions of the CSAE), 2014, 30(16): 26-32.
[11] Blanco-Roldán G L, Gil-Ribes J A, Kouraba K, et al. Effects of trunk shaker duration and repetitions on removal efficiency for the harvesting of oil olives[J]. Applied Engineering in Agriculture, 2009, 25(3): 329-334.
[12] San Yunlong, Niu Changhe, Qiao Yuanyuan. Development of fruit mechanized harvest and its relevant research[J]. Xinjiang Agricultural Sciences, 2013, 50(3): 499-508.
[13] Torregrosa A, Albert F, Aleixos N, et al. Analysis of the detachment of citrus fruits by vibration using artificial vision[J]. Biosystems Engineering, 2014, 119(3): 1-12.
[14] Du Xiaoqiang, Li Songtao, He Leiying, et al. Optimal design and experiment on vibratory fruit harvesting mechanism with three-dimensional excitation[J]. Transactions of the Chinese Society of Agricultural Engineering (Transactions of the CSAE), 2017, 33(16): 48-55.
[15] Loghavi M, Mohseni S H. The effects of shaking frequency and amplitude on detachment of lime fruit[J]. Iran Agricultural Research, 2006, 24(2): 27-38.
[16] Erdoğan D, Güner M, Dursun E, et al. Mechanical harvesting of apricots[J]. Biosystems Engineering, 2003, 85(1): 19-28.
[17] Torregrosa A, Ortí E, Martín B, et al. Mechanical harvesting of oranges and mandarins in Spain[J]. Biosystems Engineering, 2009, 104(1): 18-24.
[18] He Miao, Kan Za, Li Chengsong, et al. Mechanism analysis and experiment on vibration harvesting of wolfberry[J]. Transactions of the Chinese Society of Agricultural Engineering (Transactions of the CSAE), 2017, 33(11): 47-53.
[19] Zhou J, He L, Zhang Q, et al. Evaluation of the influence of shaking frequency and duration in mechanical harvest of sweet cherry[J].Applied Engineering in Agriculture, 2013, 29(5): 607-612.
[20] Zhou J, He L, Zhang Q, et al. Effect of excitation position of a handheld shaker on fruit removal efficiency and damage in mechanical harvesting of sweet cherry[J]. Biosystems Engineering, 2014, 125(9): 36-44.
[21] Láng Z. A one degree of freedom damped fruit tree model[J]. Transactions of the ASABE, 2008, 51(3): 823-829.
[22] Pezzi F, Caprara C. Mechanical grape harvesting: Investigation of the transmission of vibrations[J]. Biosystems Engineering, 2009, 103(3): 281-286.
[23] Mateev L, Kostadinov G. Probabilistic model of fruit removal during vibratory morello harvesting[J]. Biosystems Engineering, 2004, 87(4): 425-435.
[24] Wang Yecheng, Chen Haitao, Lin Qing. Optimization of parameters of blackcurrant harvesting mechanism[J]. Transactions of the Chinese Society of Agricultural Engineering (Transactions of the CSAE), 2009, 25(3): 79-83.
[25] D’Agostino A, Giametta F, Giametta G, et al. Preliminary tests to assess the dynamics of the vibrations transmitted on olive trees by mechanized harvest by shakers[J]. Acta Horticulturae, 2008, 791: 285-295.
[26] Horvath E, Sitkei G. Energy consumption of selected tree shakers under different operational conditions[J]. Journal of Agricultural Engineering Research, 2001, 80(2): 191-199.
[27] Savary S K J U, Ehsani R, Schueller J K, et al. Simulation study of citrus tree canopy motion during harvesting using a canopy shaker[J]. Transactions of the ASABE, 2010, 53(5): 1373-1381.
[28] Wu Chuanyu, He Leiying, Du Xiaoqiang, et al. 3D reconstruction of Chinese hickory tree for dynamics analysis[J]. Biosystems Engineering, 2014, 119(3): 69-79.
[29] Wang Yecheng, Chen Haitao, Qiu Lichun. Modal experiment analysis on blackcurrant branches[J]. Transactions of the Chinese Society of Agricultural Engineering (Transactions of the CSAE), 2011, 27(Supp. 2): 45-49.
[30] He Long, Zhou Jianfeng, Du Xiaoqiang, et al. Energy efficacy analysis of a mechanical shaker in sweet cherry harvesting[J]. Biosystems Engineering, 2013, 116(4): 309-315.
[31] Du Xiaoqiang, Chen Du, Zhang Qin, et al. Dynamic response of sweet cherry tress under vibratory excitations[J]. Biosystems Engineering, 2012(111): 305-314.
[32] Du Xiaoqiang, Chen Du, Zhang Qing, et al. Response of UFO (upright fruiting offshoots) on cherry trees to mechanical harvest by dynamic vibratory excitation[J]. Transactions of the ASABE, 2013, 56(2): 345-354.
[33] Liu Zilong, Wang Chunyao, Wei Tingpeng, et al. The research of fruit trees dynamic characteristics with impact vibration[J]. Journal of Xinjiang University: Natural Science Edition, 2016, 33(6): 495-499.
[34] Lu Fei, Wang Chunyao, Luo Jianqing, et al. Vibration harvesting experiment on crabapple trees[J]. Jiangsu Agricultural Science, 2017, 45(2): 207-210.
[35] Du Xiaoqiang, Wu Chuanyu, He Leiying, et al. Dynamic characteristics of dwarf Chinese hickory trees under impact excitations[J]. International Journal of Agricultural and Biological Engineering, 2015, 8(1): 17-25.
[36] Salamon Z. Mechanical harvest of Black Currants and their sensitivity to damage[J]. Acta Horticulturae, 1993, 352: 109-112.
机械采收作业中银杏树频谱特性与振动响应关系研究
林 欢,许林云※,周宏平,宣 言,贾志成,陈 青
(南京林业大学机械电子工程学院,南京 210037)
机械采收是林果收获最有效的方法,在受迫振动下果实的掉落不仅受到激振振幅、频率和持续时间的影响,还与果树自身的生长形态和固有频谱特性有关。为了研究银杏树的频谱特性与振动响应之间的关系以及振动响应在不同方向上的差异性,该文在室内冲击激振下测试了一棵Y型银杏树不同方向的频谱特性。然后,通过频谱曲线中峰值点和谷值点所在的频率对果树树干进行简谐激振获得空间加速度响应。结果显示频谱特性与振动响应之间存在一定的对应关系,基频以及10.00 Hz以下的激振频率无法激发起很大的振动响应。共振频率能够引起极大的振动响应,但是加速度幅值在低频下较小并且随着激振频率的增加而增大。当频率高于25.00 Hz时并不能再次引起较强的加速度响应,样品树的最佳激振频率为23.75 Hz。在同一个测试位置,3个方向的振动响应呈现出相似的特性但振幅不同。随着测试位置逐渐远离激振点,沿着果树生长方向的加速度幅值显著增加,并且该方向是振动响应传递过程的主导方向。结果表明在机械采收林果时,可以首先测试果树的频谱来获得共振频率,然后在特定的共振频率下对果树进行激振来获得较强的振动响应,更高的激振频率并不一定引起更强烈的振动响应。同一个测试位置不同方向之间存在差异性,不同位置的果实可以被不同方向的惯性力移除。
机械化;振动;收获;加速度;频谱;银杏
10.11975/j.issn.1002-6819.2017.17.007
S225.93
A
1002-6819(2017)-17-0051-07
2017-07-29
2017-08-16
National Key Research and Development Plan of China (Grant No. 2016YFD0701501)
Lin Huan, PhD, engaged in the modern mechanical design theory and methods. Email: huanlinphd@163.com.
Xu Linyun, professor, engaged in the research of the forestry machinery. Email: lyxu@njfu.com.cn.