Preparation of filter paper with chiral separation function by oxidation and Schiff-base reaction
2017-09-14LUOLixinZHAOXinghuaJIANGMinjieZHANGHaiyanWANGYu
LUO Lixin, ZHAO Xinghua, JIANG Minjie, ZHANG Haiyan, WANG Yu
(College of Chemistry and Molecular Science, Wuhan University, Wuhan 430072, China)
Communication
Preparation of filter paper with chiral separation function by oxidation and Schiff-base reaction
LUO Lixin*, ZHAO Xinghua, JIANG Minjie, ZHANG Haiyan, WANG Yu
(College of Chemistry and Molecular Science, Wuhan University, Wuhan 430072, China)
Paper chromatography (PC) is a highly flexible, fast, and efficient separation method. In this study, a chromatographic paper with a chiral separation function was investigated and a paper chromatographic method for chiral separation was developed. Single-factor experiments and orthogonal tests were used to determine the optimal oxidation conditions for filter paper. The optimal conditions were that sodium periodate 4% (mass percentage), pH 2 buffer solution, reaction temperature 45 ℃, and reaction time 4 h. Under the optimal conditions, the aldehyde group content of a dialdehyde-based filter paper was 57.93% (amount of substance percentage). A paper-based chiral separation material was synthesized by a microwave-assisted Schiff-base reaction of the oxidized filter paper with L-glutamic acid. The developing solvent for separating racemic tartaric acid using this chiral filter paper consisted of 100 mL ofn-butanol, 50 mL of 50%(v/v) acetic acid, and 0.100 0 g of bromophenol blue. The rate of flow (Rf) values of L-tartaric acid and D-tartaric acid were 0.52 and 0.40, respectively. This method does not require large-scale equipment to perform the chiral separation and it is therefore suitable for general teaching, research, and industrial applications.
paper chromatography (PC); chiral separation; dialdehyde filter paper (DaFP); chiral separation filter paper (CFP); Schiff-base reaction
In paper chromatography (PC), paper fibers act as the carrier and adsorbed water acts as the stationary phase. Separation is achieved based on differences among the distribution coefficients of the samples. PC is flexible, fast, and efficient [1]. However, few studies of chiral separation using PC have been reported [2]. At present, in academic research and industrial applications chiral separation is generally achieved by liquid chromatography, using a chiral separation column [3,4]. This method requires expensive equipment, which hinders the use of chiral separation in general teaching and research activities. Furthermore, the lack of visual effects makes the results less convincing in independent analytical processes. In this study, PC was used to separate racemic products, without the use of any supplementary equipment. The process is efficient and visible. We developed a dialdehyde-based filter paper (DaFP) via oxidation of the raw material, i. e., filter paper, with sodium periodate [5,6]. A chiral amino acid was then anchored on the DaFP to produce a chiral filter paper (CFP) [7,8]. This material gave good results in chiral separation tests.
1 Experimental
1.1Materials
Qualitative filter paper from Hangzhou Whatman-Xinhua Filter Paper Ltd. (Hangzhou, China) was used. Reagents were all purchased from the Sinopharm Group Chemical Reagent Co., Ltd. (Shanghai, China).
1.2Experimental methods

CFP: a DaFP sample of dimensions 30 cm×4 cm was immersed in a reactor containing an ethanol solution of sodium L-glutamate. After microwave irradiation for 1.5 min, the mixture was removed and cooled to room temperature. The filter paper was then washed with water and dried to obtain the CFP.
The carbonyl content was determined using a semi-trace hydroxylamine method [9,10]. The dried oxidized filter paper carbonyl content was accurately determined as follows. The oxidized filter paper was filtered into a flask. Hydroxylamine hydrochloride methanol solution and then thymol blue methanol indicator were added. The mixture was heated in a bath at 70 ℃ for 2 h. After cooling, titration was performed with standard sodium hydroxide methanol solution, until the color of the solution changed from pink to yellow. A blank test was performed at the same time.
2 Results and discussion
2.1Factors affecting oxidation of filter paper
2.1.1Effect of sodium periodate concentration on oxidation of filter paper
Table 1 shows the aldehyde group contents and morphologies of filter papers oxidized using sodium periodate mass percentages ranging from 2% to 10%.
The data in Table 1 show that the aldehyde group content of the filter paper increased with increasing concentration of sodium periodate, and the maximum aldehyde group content obtained was 85.06% (amount of substance percentage). However, when the sodium periodate mass percentage was higher than 4%, the filter paper became yellowish. Further increases in the sodium periodate concentration led to an increase in the aldehyde group content of the filter paper, but the filter paper became yellowish and even shrank, i. e., a well-functioning filter paper was not obtained. The optimal oxidation condition was therefore less than 4% (mass percentage) NaIO4.

Table 1 Effect of sodium periodate concentration on aldehyde group content and morphology of DaFP
x(Aldehyde): amount of substance percentage of aldehyde.
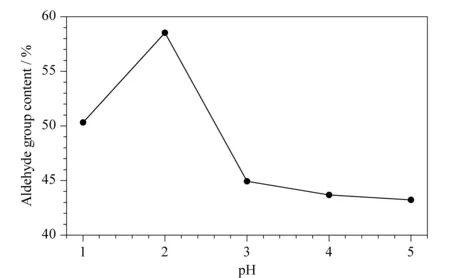
Fig. 1 Effect of pH on aldehyde group contents of DaFP
2.1.2Effect of pH on efficiency of filter paper oxidation
Fig. 1 shows the aldehyde group contents of filter papers oxidized using 4% (mass percentage) sodium periodate at pH values ranging from 1 to 5.
Fig. 1 shows that the pH significantly affected the oxidation capacity of sodium periodate. At pH 2, the oxidizing ability of sodium periodate was strongest, and the aldehyde group content of the filter paper was highest, reaching 58.53% (amount of substance percentage). At pH 1, reduction of sodium periodate can easily occur, therefore the content of aldehyde groups decreased. When pH>2, because of the less acidic environment in the solution, the oxidizing capacity of sodium periodate was less strong, therefore the aldehyde group content was low. The optimal pH for oxidation using sodium periodate was therefore 2, based on the percentage of aldehyde group content.
2.1.3Effect of reaction temperature on oxidation of filter paper
Table 2 shows the aldehyde group contents and morphologies of filter papers treated under the optimal conditions, i. e., 4% (mass percentage) sodium periodate solution and pH 2, at reaction temperatures ranging from 25 to 65 ℃.

Table 2 Effect of temperature on aldehyde group content and morphology of DaFP
The data in Table 2 show that when the reaction temperature was less than 45 ℃, the oxidation rate with sodium periodate was low, resulting in a low aldehyde group content. When the reaction temperature was greater than 45 ℃, sodium periodate became unstable and decomposed because of the high temperature; this resulted in a decrease in the aldehyde group content produced by the oxidation reaction. The experimental results showed that the aldehyde group content of the oxidized filter paper reached a maximum at 45 ℃, and the appearance of the oxidized filter paper showed that it remained in good condition. The optimal temperature for the oxidation reaction was therefore 45 ℃.
2.1.4Effect of reaction time on oxidation of filter paper
Table 3 shows the aldehyde group contents and morphologies of DaFP obtained using various oxidation times. The other reaction conditions were the optimal conditions, i. e., sodium periodate 4% (mass percentage), pH 2, and temperature 45 ℃.
The data in Table 3 show that the aldehyde group content increased with increasing reaction time up to 4 h, finally reaching 57.93% (amount of substance percentage). When the reaction time was prolonged, the aldehyde group content decreased. This is because the hydroxyl and aldehyde groups can be condensed under acidic conditions to produce acetals and hemiacetals. As the reaction progressed, the aldehyde groups in the filter paper reacted with the hydroxyl groups that did not participate in the oxidation reaction, leading to a lower aldehyde group content. The optimal reaction time for the synthesis of the oxidized filter paper was therefore considered to be 4 h.
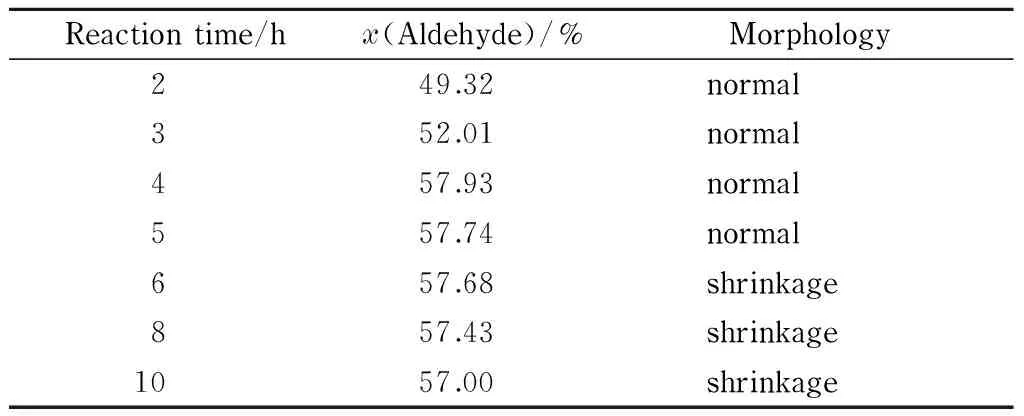
Table 3 Effect of reaction time on aldehyde group content and morphology of DaFP
2.1.5Orthogonal design and results of optimization of oxidation conditions for DaFP synthesis
Four factors and three levels of experiments were used for the orthogonal design. The four factors were mass percentage of sodium periodate, pH value, temperature, and oxidation time, and the three corresponding levels are shown in Table 4.
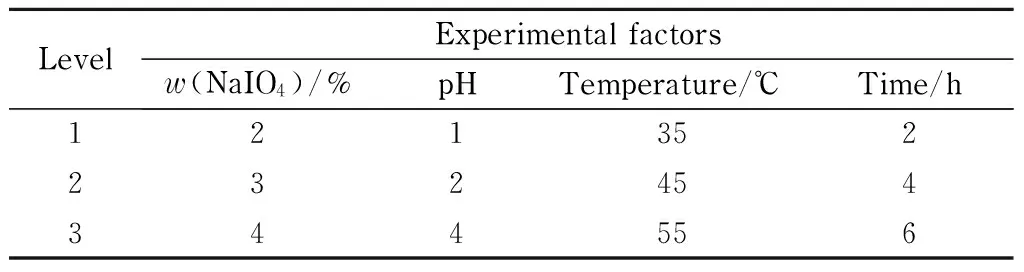
Table 4 Orthogonal test factors and levels
The data in Table 5 show that the mass percentage of sodium periodate significantly affected the amount of aldehyde groups in the oxidized filter paper. The degree of impact of each factor on the aldehyde group content was mass percentage of sodium periodate>pH> temperature>time. Under the optimal conditions, i. e., A3, B2, C2, and D2, the maximum aldehyde group content of the oxidized filter paper was 57.93% (amount of substance percentage).

Table 5 Analysis of orthogonal test results
K1,K2,K3represent the sum of the numerical values corresponding to the “1, 2, 3” levels, respectively;R: range=maximum average yield-minimum average yield.
2.2Chiral filter paper synthesis and spectral analysis
The CFP was produced by a microwave-assisted Schiff-base reaction using the DaFP and sodium L-glutamate as the raw materials. The infrared spectra a, b, c, and d in Fig. 2 show carbonyl to amino group ratios of 1∶1, 1∶2, 1∶3, and 1∶4 (amount of substance ratio), respectively. The carbonyl groups were derived from the oxidized filter paper and the amino groups were derived from sodium L-glutamate. The peaks at 1 630.66, 1 630.81, 1 631.02, and 1 630.89 cm-1in the CFP are all attributed to C=N; these peaks confirm the formation of imino groups. The absorption peak for C=N at 1 630.90 cm-1indicates the reaction of oxidized cellulose with the -NH2groups on theα-carbon of sodium L-glutamate.

Fig. 2 Infrared spectra of CFP samples prepared using different proportions of raw materials a, b, c, and d show carbonyl to amino group ratios of 1∶1, 1∶2, 1∶3, and 1∶4 (amount of substance ratio), respectively.
2.3Determination of nitrogen content of CFP
The amount of substance ratios of carbonyl to amino groups were 0.5∶1, 1∶1, 1∶2, 1∶3, and 1∶4, respectively. The product was synthesized using a microwave-assisted Schiff-base reaction. The nitrogen contents of different CFP samples were determined quantitatively using the Kjeldahl method. The results are shown in Table 6.
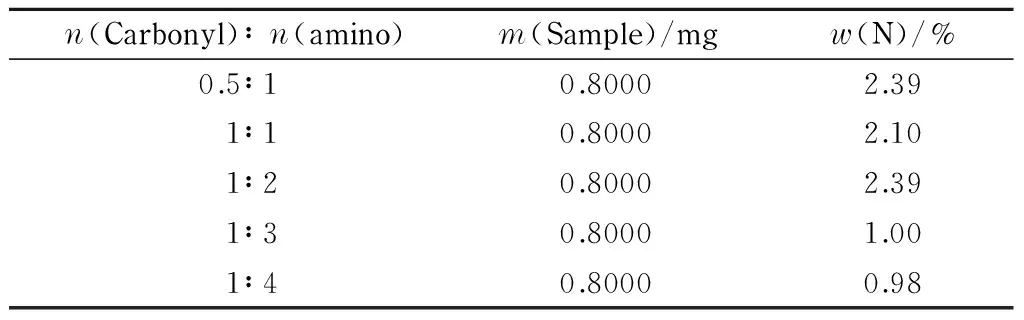
Table 6 Nitrogen contents of CFP samples synthesized using different proportions of raw materials
2.4Separation of racemic tartaric acid using CFP
In this study, an improved PC expansion method [1] was used for the separation of tartaric acid. The quantities of developer and coloring agent were 100 mL ofn-butanol and 50 mL of acetic acid, and 0.100 0 g of bromophenol blue, and the developing time was 4 h. The rate of flow (Rf) value was fixed at about 0.35 under laboratory conditions. Spots developed as a result of the separation were yellow, whereas the background was blue because of the coloring agent used. The spots were clear and stable. No smearing was observed, which made the results easy to interpret by visual inspection.

Fig. 3 Separation of tartaric acid using CFP a. racemic tartaric acid, untreated filter paper; b and d. 2.5% (mass percentage) racemic tartaric acid, chiral filter paper; c. 5% (mass percentage) racemic tartaric acid, chiral filter paper; e. 2.5% (mass percentage) L-tartaric acid, chiral filter paper; f. 2.5% (mass percentage) D-tartaric acid, chiral filter paper.
Fig. 3 shows the separation of tartaric acid using the improved PC expansion method. Column a shows the separation of racemic tartaric acid on untreated filter paper. Column b shows the separation of 2.5% (mass percentage) racemic tartaric acid after development; itsRfvalues correspond to 0.52 and 0.40. Column c shows the separation of 5% (mass percentage) racemic tartaric acid after development; itsRfvalues correspond to 0.54 and 0.41. Column d shows the results for 2.5% (mass percentage) racemic tartaric acid after development; itsRfvalues correspond to 0.51 and 0.40. Column e shows the result for 2.5% (mass percentage) L-tartaric acid after development; itsRfvalue corresponds to 0.52. Column f shows the result for 2.5% (mass percentage) D-tartaric acid after development; itsRfvalue corresponds to 0.40. The spot withRf=0.40 in column e indicates that the purity of the L-tartaric acid sample was not high and it contained enantiomers. Racemic tartaric acid was separated into two clearly defined yellow spots at the bottom of the CFP after development. Single-enantiomer L-tartaric acid developed only one clearly defined yellow spot. The position andRfvalue of the L-tartaric acid spot correspond to those of the top yellow spots after D-expansion. The single enantiomer of D-tartaric acid was also clearly defined as one yellow spot with anRfvalue corresponding to the bottom yellow spot after D-expansion. These results show that the racemic compound can be separated using the CFP.
3 Conclusions
In this study, we oxidized filter paper with sodium periodate to develop a DaFP. A paper-based chiral separation material, CFP, was synthesized using a microwave-assisted Schiff-base reaction. A modified PC method was used to separate racemic tartaric acid on the CFP; the known single enantiomers, i. e., L-tartaric acid and D-tartaric acid, were used as reference samples. Under the same conditions, the CFP successfully separated racemic tartaric acid.
[1] Akira S, Yoshihisa T. Paper Chromatography and Its Application. Tokyo: Kyoritsu Publishing Co., Ltd., 1971
[2] Kotake M, Sakan T, Nakamura N, et al. J Am Chem Soc, 1951, 73(6): 2973
[3] Zhao Y F, Song J X, Sun J Y, et al. Chinese Journal of Chromatography, 2014, 32(8): 832
[4] Luo A, Wan Q, Fan H J, et al. Chinese Journal of Chromatography, 2014, 32(9): 1013
[4] Guigo N, Mazeau K, Putaux J L, et al. Cellulose, 2014, 21(6): 4119
[6] Siller M, Amer H, Bacher M, et al. Cellulose, 2015, 22(4): 2245
[7] Sharma U, Sood S, Sharma N, et al. Med Chem Res, 2013, 22(11): 5129
[8] Jiang W J, Kuang D Z, Feng Y L, et al. Chinese Journal of Organic Chemistry, 2014, 34(11): 2288
[9] Maekawa E, Koshijima T. J Appl Polym Sci, 1984, 29: 2289.
[10] Feng Y Q, Liu Y, Zhang X D. Journal of Tianjin University, 2002, 35(6): 766.
利用氧化和希夫碱反应制备具有手性分离功能的滤纸
罗立新*, 赵兴华, 姜敏洁, 张海雁, 王 玉
(武汉大学化学与分子科学学院, 武汉 430072)
纸色谱具有微量、快速、高效和灵活程度高等特点。以滤纸为原料用高碘酸钠氧化法合成了二醛基滤纸,通过希夫碱反应接枝手性氨基酸,合成了一种具有手性分离功能的新型纸色谱材料。通过单因素试验和正交试验确定滤纸氧化的最佳合成条件为:高碘酸钠的质量分数为4%, pH值为2,反应温度45 ℃和反应时间4 h,该条件下氧化滤纸醛基含量为57.93%(物质的量分数)。氧化滤纸与L-谷氨酸通过微波合成得到具有手性分离功能的色谱用纸。利用该种手性滤纸分离外消旋酒石酸,展开剂配方为100 mL 50%正丁醇,50 mL乙酸和0.100 0 g溴酚绿。结果显示,L-酒石酸比移值(Rf)为0.52, D-酒石酸Rf为0.40。该方法不需要使用大型设备,适合一般的教学、研究及工业应用。
纸色谱;手性分离;双醛氧化滤纸;手性分离滤纸;希夫碱反应
10.3724/SP.J.1123.2017.04020
O658 Document code: A Article IC:1000-8713(2017)09-0912-06
Foundation item: 2013 Hubei Province Small and Medium-Sized Enterprises (SME) Technology Innovation Project (No. 201319).
* Received date: 2017-04-19
* Corresponding author. Fax: (027)81710188, E-mail: lxluo@whu.edu.cn.
