Coupling of the flow field and the purification efficiency in root system region of ecological floating bed under different hydrodynamic conditions*
2016-12-26LeiRAO饶磊PeifangWANG王沛芳YangLEI雷阳ChaoWANG王超
Lei RAO (饶磊), Pei-fang WANG (王沛芳), Yang LEI (雷阳), Chao WANG (王超)
1. College of Mechanics and Materials, Hohai University, Nanjing 21100, China, E-mail: rao_lei@163.com
2. Key Laboratory of Integrated Regulation and Resource Development on Shallow Lakes, Ministry of Education, Hohai University, Nanjing 210098, China
3. College of Environment, Hohai University, Nanjing 210098, China
Coupling of the flow field and the purification efficiency in root system region of ecological floating bed under different hydrodynamic conditions*
Lei RAO (饶磊)1, Pei-fang WANG (王沛芳)2,3, Yang LEI (雷阳)3, Chao WANG (王超)2,3
1. College of Mechanics and Materials, Hohai University, Nanjing 21100, China, E-mail: rao_lei@163.com
2. Key Laboratory of Integrated Regulation and Resource Development on Shallow Lakes, Ministry of Education, Hohai University, Nanjing 210098, China
3. College of Environment, Hohai University, Nanjing 210098, China
The artificial ecological floating bed is a commonly adopted in situ treatment technique for repairing and purifying polluted water. The plant root system of the floating bed is the primary region to absorb and degrade the pollutant of water. Its inner flow field characteristics and the interactive water quantity with the surrounding water greatly impact the purification efficiency of the floating bed. In this paper, the particle image velocimetry (PIV) technology and the boundary velocity direct extraction method are used to study the velocity distribution of the root system region by numerical simulations and experiments in an experimental water channel. A pollution removal rate (PRR) evaluation model is built to calculate the PRR by coupling with the flow velocity field of the root system region. The variations of the total pollutant removal rate (TPRR) are discussed for different center distances (L =0.30 m, 0.45 m, 0.60 m), flow velocities (v=0.007 m/s, 0.015 m/s, 0.025 m/s, 0.040 m/s, 0.055 m/s, 0.070 m/s) and root system porosities (P=54.73%, 68.33%, 79.17%). The results indicate that the position arrangement of the floating beds influences the TPRR significantly, and the distance should be limited in a reasonable range for a high purification efficiency. Moreover, the root systems with higher porosity (P =68.33%, 79.17%) have higher TPRR value than a lower porosity root system (P=54.73%) within a certain flow velocity range, and the higher porosity root system has less fluctuation of the TPRR value than a lower porosity situation within a wide flow velocity range. Furthermore, under the same center distance condition, the lower flow velocity condition brings about a significantly higher TPRR value than the higher flow velocity situation.
ecological floating bed, root system region, flow velocity, pollutant removal rate, PIV
Introduction
The artificial ecological floating bed is widely used in various water bodies to treat polluted water.The pollutant in the water (such as Ammonia-Nitrogen) can be absorbed by the plant root system, and also can be degraded by the microorganisms that have parasitized the root systems. The implementation practice indicates that the ecological floating beds can effectively purify water and significantly enhance the self-repair ability of rivers and lakes[1,2]. In recent years, an immense amount of studies was carried out focusing on the influences of the plant type, the number of plants per unit area and the coverage rate on the pollutant removal rate (PRR)[4,5], as well as the influence of the shape of the floating bed and the arrangement mode on the river flow pattern[6,7].
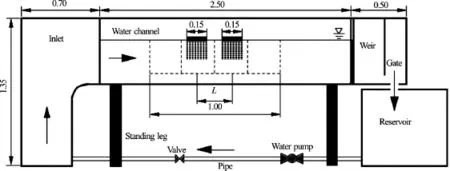
Fig.1 The dimension of water channel and experimental domain (m)
The plant root system of a floating bed is the primary region to absorb and degrade the pollutant of water, and its inner flow field characteristics and the interactive water quantity with the surrounding water are closely related with the purification efficiency of the floating bed. Many studies show that the quantity of the water flow and the hydraulic retention time (HRT) of the root system region are the main parameters to decide the PRR of the floating bed[8-10]. Generally, a larger water flow quantity can bring more pollutant through the root system region, which is beneficial to enhance the pollutant absorbing quantity by plants. However, the HRT decreases with the increase of the flow quantity, and a too short HRT is disadvantagious to the biochemical reaction process. Thus, the hydrodynamic characteristics of the root system region are the most important factor in the purification process of the floating bed. So far, little experimental and simulation studies of the flow field in the root system region have been carried out, especially those related with the coupling of the flow field and the purification efficiency of the root system region[11].
In this paper, the PIV technology and the boundary velocity direct extraction method are used to study the velocity distribution of the root system region by numerical simulations and experiments in an experimental water channel. Meanwhile, the pollution removal rate evaluation model is built to calculate the PRR by coupling with the flow velocity field of the root system region. The variations of the total pollutant removal rate (TPRR) are discussed for different center distances (L=0.30 m, 0.45 m, 0.60 m), flow velocities (v=0.007 m/s, 0.015 m/s, 0.025 m/s, 0.040 m/s, 0.055 m/s, 0.070 m/s) and root system porosities (P =54.73%, 68.33%, 79.17%).
1. Experimentation design
1.1 Experimental equipment
A rectangular section circulation water channel is used to simulate a natural river. The water channel is fixed on a steel frame base with a dip angle of 0.1oalong the length direction. The water flow in the channel is driven by a circulating water pump, and the flow velocity in the channel can be controlled by the inverter motor driver and the accessory valve system. To eliminate the inlet velocity fluctuation, the water is pumped into the reservoir first and then flows into the water channel through an inlet weir gate between the reservoir and the channel. At the outlet side of the channel, a moveable outlet weir gate is used to control the water level of the channel (with the water depth of 0.40 m). Two floating beds are arranged in the middle region of the channel with the center distance of L. The 100cm middle section of the channel is selected as the experimental domain. The sketch of the experimental channel and the dimension of the experimental domain are shown in Fig.1.

Fig.2 The experimental channel and the PIV system
To accurately measure the flow velocity field around the root system region, a particle image velocimetry (PIV) system is used, as shown in Fig.2. The laser light sheet is arranged under the water channel, which is overlapped with the middle longitudinal section of the channel. The camera is placed at the outside of the channel, perpendicular to the middle section of the channel. A few tracer particles are put into the circulation water, which can be illuminated by the laser light sheet, their positions can be captured by the camera and transformed to the real time flow velocity field[12]. Due to the limitation of the exposure area ofthe laser light sheet, the experimental domain is divided into four sections, and the global flow velocity field is assembled by these sections (Fig.1).
1.2 Experimental materials
The floating beds are made of polystyrene foamed plastic slabs with three kinds of plastic aquatic plants, as shown in Fig.3. The polystyrene foamed plastic slabs are used as the floating body, with the dimensions of about 0.15 m×0.30 m×0.05 m. The aquatic plant is fixed under the plastic slabs uniformly to simulate the root system region of the floating bed. To study the influence of the root system porosity (P)on the inner flow field, different planting densities of the aquatic plant are considered.
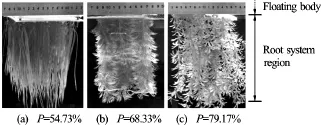
Fig.3 The root system of floating bed
2. Numerical models
The governing equations are in the two dimensional form (inx,z plane), and the root system is assumed to be a continuous porous medium, with possible flows in this region. In addition, to simplify the calculation, the dimension of the root system region keeps unchanged in the calculation process, and the root swing in the water flow is neglected here.
2.1 Flow field governing equations
The continuity equation is as follows

where uxand uzrepresent the velocity components inxandz directions.
For describing the water flow in the root system region, an additional source item is required in the Navier-Stokes equations to describe the drag resistance of the root system to the water flow. The momentum equations are as follows[13,14]
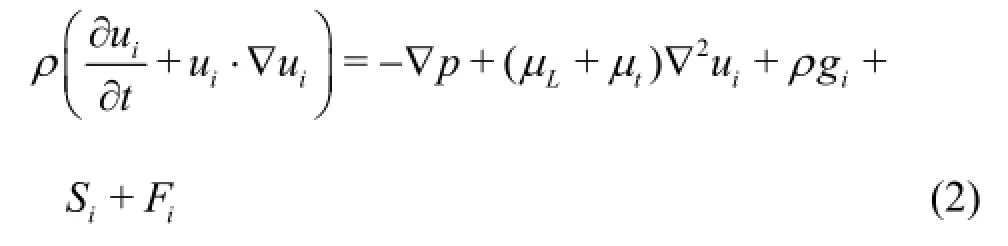
where ρis the density of the water,uiis the velocity,t is the time,p is the time-averaged pressure, giis the acceleration of gravity,µLis the molecular viscosity coefficient, and µtis the turbulence eddy viscous coefficient of the water.Siis the additional source item of the drag resistance of the root system, and it is described by the momentum variation due to the viscosity and the inertia of the fluid in the continuous porous media.Fiis the coupling source item which describes the momentum exchange between the floating bed and the flow[15].
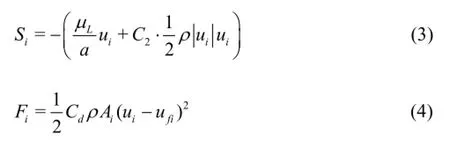
wherea is the viscosity drag coefficient,C2is the inertia drag coefficient. Based on Darcy’s law, these two parameters can be determined by experiments.Cdis the comprehensive resistance coefficient of the floating bed,Aiis the projected area on each coordinate plane, and ufiis the velocity of the floating bed.
The floating beds can produce a turbulent flow in the channel. Here, the k-εequations are used:
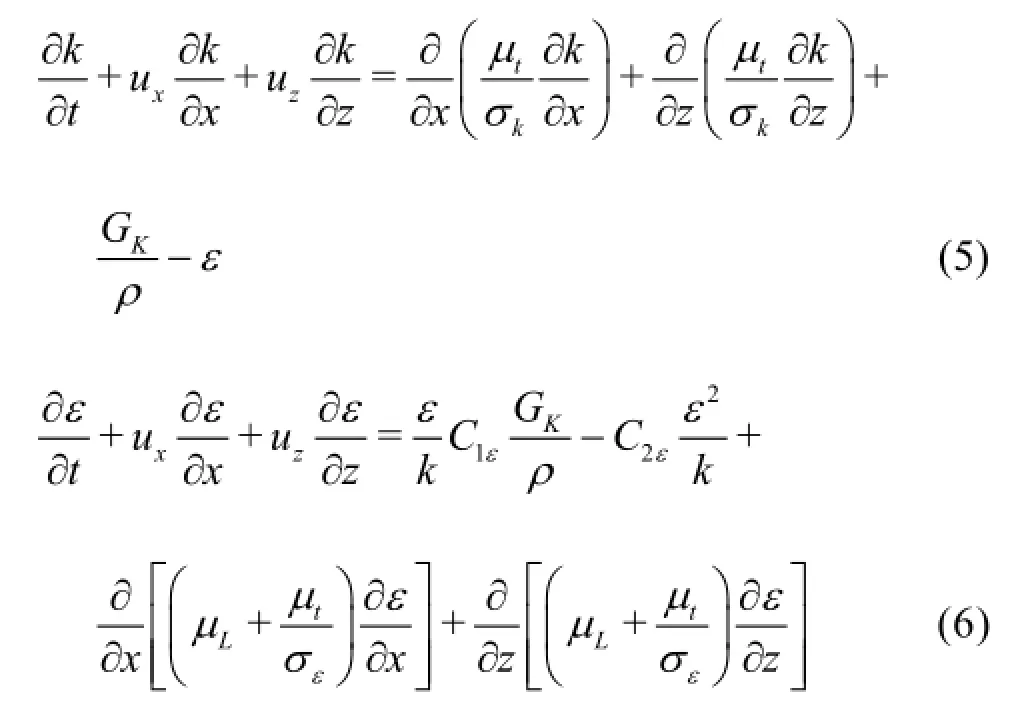
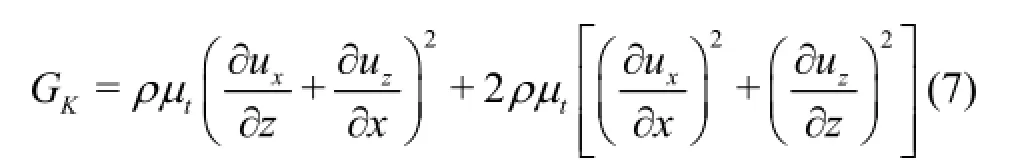
wherek is the turbulence kinetic energy,εis the dissipation rate of the turbulence kinetic energy.σkand σεare the Prandtl numbers corresponding to k andε, respectively.σ1εand σ2εare empirical constants.Gkis the turbulent kinetic energy produced by the gradient of the average velocity, and it can be described as follows
Based on the kandε, the turbulence eddy viscous coefficient of the waterµtcan be expressed as follows
where Cµis an empirical constant. In this paper, Cµ=0.09.
2.2 Degradation governing equations
Ammonia-Nitrogen (NH3-N) and the various organics are the major pollutant in the water body. The plant root and the microorganism can absorb and degrade these pollutants effectively. To evaluate the purification efficiency of the floating bed, the NH3-N degradation rate equations of porous filler are as follows[16]:

where ηiis the NH3-N degradation rate of a subregion, i is the index of the subregion,Ci-1is the initial NH3-N concentration of the inflow water,Ciis the final NH3-N concentration of outflow water,K is the total degradation coefficient,asis the total interface area between the water and the root system per unit area,Lis the total area of the floating beds,Ais the sectional area of the channel,usis the average flow velocity in the channel,PRR is the pollutant removal rate of a floating bed,Qiis the water flow rate of a subregion.

Fig.4 The boundaries of computational domain
2.3 Boundary conditions
To calculate the flow velocity distribution in the root system region, the boundary velocity around the root system region is measured by the PIV system. To avoid the velocity fluctuation due to the root swing, 0.025 m thick boundary layers are placed around the root system region of each floating bed. Thus, the computation domain is a little larger than the root system region (Fig.4). The boundaries are labeled from S1 to S6. Boundaries S1, S2, S4 and S5 are taken as the inlet boundary of the root system region in the calculation, and S3 and S6 are taken as the outlet boundary. Moreover, the lower surface of the floating body is treated as the no-slip wall boundary in the calculation.
3. Experiment and simulation results and analyses
3.1 Experiment results and boundary velocity extraction
To study the flow velocity distribution in the root system region under different hydrodynamics conditions, a series of experiments are performed for different flow velocities (v=0.007 m/s, 0.015 m/s, 0.025 m/s, 0.040 m/s, 0.055 m/s, 0.070 m/s), center distances between two floating beds (L=0.30 m, 0.45 m, 0.60 m) and root system porosities (P= 68.33%, 54.73%, 79.17%). The boundary flow velocity distributions (S1 to S6) are measured by the PIV system. To avoid randomness in the flow velocity measurement, 20 frame images within 5 s are captured and a statistical average method is used to generate the average velocity field. Figure 5 shows the measured velocity field of the experimental domain by the PIV system under the condition of v =0.025 m/s,L= 0.45 m and P =68.33%.

Fig.5 The measured velocity field of experimental domain
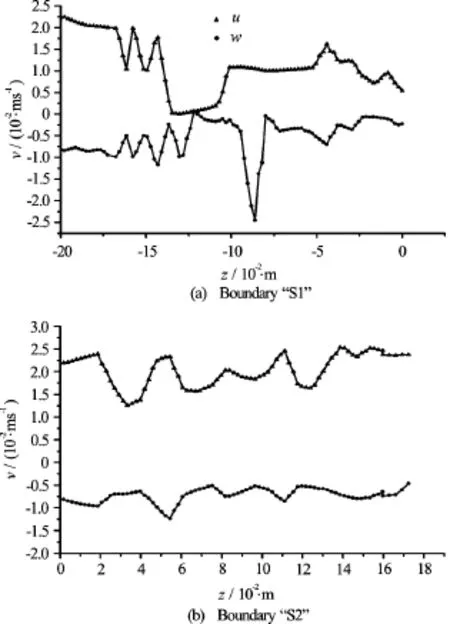
Fig.6 The boundary velocity for the first floating bed
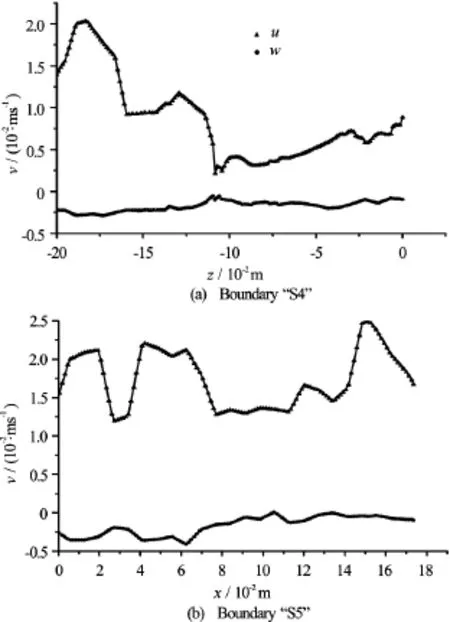
Fig.7 The boundary velocity for the second floating bed
In the front of the first floating bed (x <0.10 m), the flow velocity in this section is almost invariant and distributes uniformly, and the average velocity is approximately equal to the flow velocity in the channel. Near the boundary S1(x=0.10 m), the water flow is blocked by the root system region. The upper layer water flow tends to mix into the bottom layer, and the bottom layer average velocity begins to increase in this region. Within the first floating bed section (0.10 m <x<0.03m), the upper layer flow velocity decreases quickly within a short distance due to the drag resistance of the root system. The main stream of the water flow is narrowly compressed by the floating bed, and the flow velocity of the bottom layer increases significantly. In the section between the two floating beds(0.30 m <x<0.60 m), an eddy is generated within the gap. Although the velocity is low in this region, the flow convection helps the pollutant exchange between the upper and bottom layers. Near the boundary S4(x=0.60 m), the upper layer flow velocity is low, and the velocity component inxdirection is lower than that inz direction, which decreases significantly the water flowing into the second root system region. The rear section of the second floating bed (0.90 m <x<1.00 m)is the region influencing the wake flow. Under the pressure gradient between the upper and bottom layers, a small part of the bottom layer water flow mixes into the upper layer, and the flow velocity of the bottom layer decreases quickly.

Fig.8 The velocity distributions on the outlet boundary of both floating beds
For describing the velocity distribution on the boundary of the root system region, the velocity components (uandw ) on the boundaries S1 through S6 are extracted with a sampling space of 0.0025 m. The velocity distribution curves of the inlet boundaries are shown in Fig.6 and Fig.7.
To verify the accuracy of the mathematical models, the velocity distributions on the outlet boundaries (S3 and S6) obtained by experiments and simulations are compared. The comparison velocity curves for both floating beds are shown in Fig.8.
Figure 8 shows that the velocity curves on the outlet boundary (S3 and S6) obtained by experiments and simulations are in good agreement. It means that the mathematical model used in this work enjoys a good accuracy, and the simulation velocity field of each root system region is reliable.
3.2 The flow velocity distribution in root system region
For studying the influence of the velocity distribution on the PRR of the root system region, the longitudinal section of the root system region is divided into 9 subregions, named as A1/B1 through A9/B9. The flow velocity distributions and the subregions of both floating beds are shown in Fig.9.

Fig.9 The flow velocity distributions and the subregions in the root system region
Figure 9 shows that the flow velocity and direction distributions are quite different in both root system regions. The average velocity in the first root system region is higher than that in the second one.
In the root system region of the first floating bed, the horizontal velocity gradient is greater than that in the vertical direction. In the upper and middle subregions (A1 to A6), the water flows into the root system from subregions A1 and A4, and flows out from A3 and A6. In the bottom subregions (A7 to A9), the water flows into the root system region from the bottom left of A7 and flows out from the top right of A9. Meanwhile, the velocity decreases quickly along the flow direction under the drag resistance of the plant root.
In the root system region of the second floating bed, the vertical velocity gradient is greater than that in the horizontal direction. The water flows into the root system region from its left bottom subregions (B7 and B8), and flows out from its left side subregions (B3, B6 and B9).
3.3 The coupling analysis of PRR
The hydraulic retention time and the water flux density of each subregion are directly related with the PRR of the floating bed. Based on the degradation governing equations and the flow velocity field in the root system region, the PRR value in each subregion can be calculated. Figure 10 shows the PRR distribution in the root system regions under the condition of v =0.025 m/s,L =0.45 mand P =68.33%.
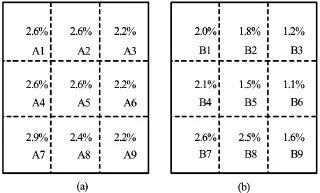
Fig.10 The PRR distributions in root system regions
Figure 10 shows that the PRR values of each subregion are different due to the different velocity distributions in the root system region. The first floating bed has a higher purification efficiency (PRR= 21.5%)than the second one (PRR=16.4%). Furthermore, the subregions near the inlet boundary have higher PRR values than those on the outlet side. It means that more pollutant is absorbed on the inlet boundary side.
4. Discussions
In natural rivers, the pollution removal rate of the floating bed is influenced by various factors. For different flow velocities in the channel, different center distances and different root system porosities, the totalpollution removal rates (TPRR) of both floating beds vary in the following manner.
4.1 The influence of center distance and flow velocity on TPRR
In practice, the position arrangement of the floating beds is not only related with the view of scenery, but also influences the pollution removal efficiency remarkably. Nowadays, it is common to improve the purification efficiency by increasing the coverage rate of the floating bed. Although reducing the center distance might increase the coverage rate, the purification efficiency of the floating beds is difficult to improve under various flow velocity conditions. For studying the influence of the arrangement of the floating beds on the TPRR, different center distances between the floating beds are considered here. Figure 11 shows the TPRR values for three different center distance and flow velocity conditions.
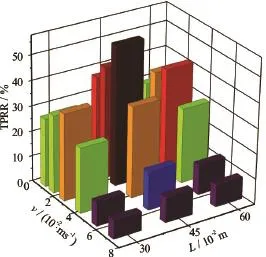
Fig.11 The TPRR for different center distances and flow velocities (P=79.17%)
Figure 11 shows that the TPRR values are significantly different under different center distance and flow velocity conditions. At the same flow velocity level, the TPRR value for the center distance of 0.45 m is higher than those for the center distances of 0.30 m and 0.60 m. For a short center distance(L< 0.30 m), the water flow blocks by the first root system and then mainly flows in the bottom layer under the floating beds. The force convection between the gap water and the bottom flow is weak, and the pressure difference between the gap and the second root system region is small. It makes the water flowing through the second root system region decrease, and the TPRR decreases with the decrease of the water flow quantity observably. When the center distance is large enough (L >0.60 m), more water flows through the second root system region than under a short distance condition, which can enhance the absorbed pollutant quantity of every floating bed to some extent. But the decreased coverage rate limits the TPRR’s increase to a high level. So, too short or too long distance between the floating beds are disadvantagious to promoting the purification efficiency, the distance should be within a reasonable range.
Furthermore, under the same center distance condition, a low flow velocity can lead to a significantly higher TPRR value than under the high flow velocity condition. When the channel flow velocity is low (v <0.04 m/s), the water flowing through the root system region decreases slowly, but the HRT in the root system region increases significantly, which allows enough reaction time to absorb the pollutant in the water by the plant root. When the flow velocity is high (v >0.04 m/s), the HRT decreases with the increase of the flow in the root system region. The pollutant is hard to be absorbed within a short HRT, and then, the TPRR decreases sharply in a higher flow velocity situation.
4.2 The influence of root system porosity and flow velocity to TPRR
Nowadays, various plants are used in the floating beds for different pollutant species and in view of scenery requirements. The root system porosity is largely decided by the shape of the plant root and the planting density. Although increasing the planting density can increase the reaction interface area between the water and the plant root, the water flow quantity will decrease significantly with the decrease of the root system porosity[17,18]. For studying the influence of the root system porosity on the TPRR, three kinds of root system samples with different porosities are studied here, respectively. The TPRR values for different porosities and flow velocities are shown in Fig.12.
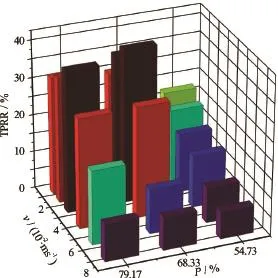
Fig.12 The TPRR for different root system porosities and flow velocities (L=0.30 m)
Figure 12 shows that the root systems with a high porosity (P=68.33%, 79.17%) have a larger TPRR value than a low porosity root system(P=54.73%). Due to the drag resistance effect, the velocity gradient and the pressure gradient along the flow direction in a low porosity root system (P=54.73%) are larger than in a high porosity root system region(P=79.17%). Although a low porosity root system has a larger reaction interface area than a high porosity root system, a lower flow velocity and lower flow flux density in each subregion decrease the TPRR significantly. Meanwhile, the water can flow into the high porosity root system easier than into the low porosity region, but the low reaction interface and the short reaction time are also limit the improvement of the pollutant removal efficiency.
Furthermore, the flow velocity influences the TPRR remarkably. In the high porosity root system situation (P=79.17%), the TPRR can keep at a high level until the flow velocity increases to 0.055 m/s. But in the same flow velocity situation, the TPRR under a low porosity root system condition(P= 54.73%)decreases sharply. Hence, for improving the purification efficiency of the floating beds, the planting density of the floating bed should be adjusted to a reasonable range by considering the flow velocity condition.
5. Conclusions
This paper discusses the influence of the flow field on the purification efficiency in the root system region of an ecological floating bed under various hydrodynamic conditions, and the results are summarized as follows:
(1) By the PIV technology and the boundary velocity directly extraction method, the velocity distribution of the root system region can be well determined, and the simulation results are in agreement with the experimental results.
(2) Based on the coupling method of the pollution degradation rate and the inner velocity field of the root system region, the TPRR of the floating beds can be evaluated accurately.
(3) The position arrangement of the floating beds influences the TPRR significantly. It is hard to promote the TPRR effectively with a too short or too long distance between the floating beds, and the distance should be limited in a reasonable range for a high purification efficiency.
(4) The root systems with a high porosity (P= 68.33%, 79.17%) lead to a higher TPRR value than the low porosity root system (P=54.73%)within a certain flow velocity range.
(5) Under the same center distance condition, the low flow velocity condition leads to a significantly higher TPRR value than under the high flow velocity condition. In addition, the high porosity root system can bring about less fluctuation of the TPRR than the low porosity situation within a wide flow velocity range.
These results show that the water flow velocity distribution in the root system region influences the pollution removal efficiency of the floating bed greatly. To improve the purification efficiency of the floating beds, the center distance between the floating beds and the density of the root system should be adjusted to a reasonable range by considering the river flow velocity.
[1] Tanner C. C., Headley T. R. Components of floating emergent macrophyte treatment wetlands influencing removal of stormwater pollutants [J]. Ecological Engineering, 2011, 37(3): 474-486.
[2] Zhou Xiao-hong, Wang Guo-xiang. Nutrient concentration variations during oenanthe javanica growth and decay in the ecological floating bed system [J]. Journal of Environmental Sciences, 2010, 22(11): 1710-1717.
[3] Stewart F. M., Mulholland T., Cunningham A. B. et al. Floating islands as an alternative to constructed wetlands for treatment of excess nutrients from agricultural and municipal wastes-results of laboratory-scale tests [J]. Land Contamination and Reclamation, 2008, 16(1): 25-30.
[4] Xian Q. M., Hu L. X., Chen H. C. et al. Removal of nutrients and veterinary antibiotics from swine wastewater by a constructed macrophyte floating bed system [J]. Journal of Environmental Management, 2010, 91(12): 2657-2661.
[5] Wang C., Miao L., Hou J. et al. The effect of flow velocity on the distribution and composition of extracellular polymeric substances in biofilms and the detachment mechanism of biofilms [J]. Water Science and Technology, 2014, 69(4): 235-242.
[6] Rao L., Qian J., Ao Y. H. Influence of artificial ecological floating beds on river hydraulic characteristics [J]. Journal of Hydrodynamics, 2014, 26(3): 474-481.
[7] Wang P. F., Wang C., Zhu D. Z. et al. Hydraulic resistance of submerged vegetation related to effective height [J]. Journal of Hydrodynamics, 2010, 22(2): 265-273.
[8] Li X. N., Song H. L., Li W. et al. An integrated ecological floating-bed employing plant, freshwater clam and biofilm carrier for purification of eutrophic water [J]. Ecological Engineering, 2010, 36(4): 382-390.
[9] Hu G. J., Zhou M., Hou H. B. et al. An ecological floating-bed made from dredged lake sludge for purification of eutrophic water [J]. Ecological Engineering, 2010, 36(10): 1448-1458.
[10] Wei X., Li B. A., Zhao S. et al. COD and nitrogen removal in facilitated transfer membrane-aerated biofilm reactor (FT-MABR) [J]. Journal of Membrane Science, 2012, 389: 257-264
[11] Zhou X., Wand G. Nutrient concentration variations during Oenanthe javanica growth and decay in the ecological floating bed system [J]. Journal of Environmental Sciences, 2010, 22(11): 1710-1717.
[12] Huai W. X., Zhao L., Li D. et al. Experimental analysis ofvertical profiles of stream-wise velocities in flows through vegetation with PIV [J]. Journal of Experiments in Fluid Mechanics, 2009, 23(1): 26-30(in Chinese).
[13] Xu Z. H., Ma G. W., Li S. C. A graph theoretic pipe network method for water flow simulation in a porous medium: GPNM [J]. International Journal of Heat and Fluid Flow, 2014, 45(2): 81-97.
[14] Alves B., Barletta A., Hirata S. et al. Effects of viscous dissipation on the convective instability of viscoelastic mixed convection flows in porous media [J]. International Journal of Heat and Mass Transfer, 2014, 70(3): 586-598.
[15] Wu S. Q., Tong Z. S., Zhou H. et al. Simulation methods for accumulation patterns floating debris in hydropower stations [J]. Advance in Science and Technology of Water Resources, 2010, 30(2): 24-28.
[16] Tian W. J. The direct biological strengthen purification mechanism and experimental study on weak pollution river [D]. Doctoral Thesis, Nanjing, China: Hohai University, 2005(in Chinese).
[17] Sun L., Liu Y., Jin H. Nitrogen removal from polluted river by enhanced floating bed grown canna [J]. Ecological Engineering, 2009, 35(1): 135-140.
[18] Huang L., Zhuo J., Guo W. et al. Tracing organic matter removal in polluted coastal wasters via floating bed phytoremediation [J]. Marine pollution Bulletin, 2013, 71(1-2): 74-82.
(Received June 15, 2016, Revised August 5, 2016)
* Project supported by the National Science Funds for Creative Research Groups of China (Grant No. 51421006), the Program for Changjiang Scholars and Innovative Research Team in University (Grant No. IRT13061), the National Science Fund For Distinguished Young Scholars (Grant No. 51225901), the National Science Fund Key Projects (Grant No. 41430751), the Qing Lan Project of Jiangsu Province, the Fundamental Research Funds for the Central Universities (Grant Nos. 2014B03814, 2015B25314) and the PAPD.
Biography:Lei RAO (1975-), Male, Ph. D., Professor
Pei-fang WANG,
E-mail: pfwang2005@hhu.edu.cn
猜你喜欢
杂志排行

水动力学研究与进展 B辑的其它文章
- Energy saving by using asymmetric aftbodies for merchant ships-design methodology, numerical simulation and validation*
- Development of Cartesian grid method for simulation of violent ship-wave interactions*
- Numerical study on the effects of progressive gravity waves on turbulence*
- Experimental tomographic methods for analysing flow dynamics of gas-oilwater flows in horizontal pipeline*
- Bending modes and transition criteria for a flexible fiber in viscous flows*
- Modelling hydrodynamic processes in tidal stream energy extraction*