The coupling between hydrodynamic and purification efficiencies of ecological porous spur-dike in field drainage ditch *
2018-07-06LeiRao饶磊PeifangWang王沛芳QingsongDai戴青松ChaoWang王超
Lei Rao (饶磊), Pei-fang Wang (王沛芳), Qing-song Dai (戴青松), Chao Wang (王超)
1. College of Mechanics and Materials, Hohai University, Nanjing 211100, China
2. Key Laboratory of Integrated Regulation and Resource Development on Shallow Lakes, Ministry of Education,Hohai University, Nanjing 210098, China
3. College of Environment, Hohai University, Nanjing 210098, China
This work was supported by the National Science Funds for Creative Research Groups of China:Ecological effects of water, sand and contaminants in rivers on water resources of high development (Grant No. 51421006). Our group engages researches closely related with the complex background conditions of“high development of water resources”, especially with the core problem of “transfer processes of water,sand and contaminants, interactive mechanisms and ecological effects”. The researches include the major impacts of the intensive development of water resources on hydrological and sedimentation changes in the middle and lower reaches of the Yangtze River,and the establishment of a hydrological simulation model, applicable to the Yangtze River Basin, as well as the migration laws of pollutants and colloids in the bed subsurface flow, the influential mechanism of the subsurface flow and their own settlement, deposition,adsorption and release behaviors. The mechanism of the flow variation in the migration of organic matter,phosphorus and heavy metals in the “sediment-wateraquatic organism” system is revealed and the biological response and the ecological effects are elucidated.The correlation between the aquatic organism community structure and the variations of water, sediment and pollutants is analyzed, along with the toxic effects of organic pollutants on the plankton and their physiological responses under the influence of water and sediment. The mechanism of the riverine microbe growth and the degradation characteristics and the mechanism of the river hydrodynamic succession process of the microbial community are also studied.
This paper is mainly related to the research work of “the mechanism of flow variation in the migration of organic matter, phosphorus and heavy metals in the“sediment-water-aquatic organism” system”.
Introduction
The field drainage ditch system is a complex water network between farmlands and rivers, which is also the major migratory pathway of various pollutants from farmlands to downstream rivers. The field drainage ditch usually has a small cross-sectional area and a long path length in a widespread distribution and with a low flow velocity. Thus, it is the best region to block and remove the escaping pollutant from the farmland[1]. Exposed in the nature environment for a long time, the field drainage ditch is easy to be destroyed under harsh service conditions. So, most of field drainage ditches are built by cement for its structure stability and durability[2]. Compared with the nature ditch, the cemented slope and bed of this kind of artificial ditch are smooth and waterproof. It not only decreases the specific surface area and biological capacity on its surface, but also brings about a high flow velocity and a short hydraulic retention time(HRT) in the ditch[3]. These negative factors weaken the self-purification capacity of the artificial ditch greatly. So, it is a research target for a long time to enhance the purification capacity of the cemented field drainage ditch system[4-5].
In recent years, the manmade porous material is gradually used as the road pavement brick to replace the traditional solid waterproof brick in building a sponge city[6-7]. The porous brick has a complexed 3-D porous framework structure, with most holes opened and connected to each other. The porous brick has a great specific surface area with excellent adsorption capacity, which is beneficial to improve the microorganism movement. Meanwhile, the surrounding water can flow into the brick, which increases the effective contact interface area between the polluted water and the biological film greatly. Practice indicates that the purification capacity of the ecological porous brick is much larger than that of the traditional solid brick[8]. Recently, the pollution water purifying technology is being developed by using the ecological porous material, especially the pollution removal technology in the artificial field drainage ditch[9-10].
The amount of the microorganism attached on the material surface is an important factor for the pollution removal rate (PRR) of the ecological porous brick, which is largely decided by the effective porosity rate and the specific surface area of the porous brick. Meanwhile, the inner flow field of the porous brick and the exchanging water quantity between the porous brick and the surrounding water are closely related with the PRR too[11]. Therefore, a complex coupling process is involved, including the macro flow field in the surrounding water, the micro flow field in the ecological porous brick and the degradation of the biological film. It is well known that the exchanging water quantity and the HRT are the two major parameters to decide the PRR of the porous material. A larger anount of exchanging water can make more pollutant passing through the porous brick region, which is good for the pollutant adsorption. However, the HRT decreases with the increase of the exchanging water amount at the same time. Too short HRT is disadvantageous to the biochemical reaction process. So far, there are many experimental and simulation studies of the flow field in the porous material, but the coupling studies of the hydrodynamic condition and the purification efficiency in the ecological porous materials are still few[12].
In this paper, a great number of ecological porous spur-dikes are arranged in an experiment channel to simulate the real field drainage ditch. Based on a series of hydrodynamics and degradation experiments,the Ammonia-Nitrogen (NH3-N) degradation evaluation model is coupled with the hydrodynamic model to calculate the PRR of the ecological porous spurdike. The variations of the total pollutant removal rate(TPRR) in the channel are discussed for different porosities ( =P15.73%, 21.84% and 26.25%), gap distances between spur-dikes ( =D0.06 m, 0.09 m and 0.12 m) and inlet flow velocities (=v0.005 m/s,0.020 m/s, 0.030 m/s, 0.040 m/s and 0.050 m/s).
1. Experimentation design
1.1 Experimental equipment
A rectangular section circulation water channel is used to simulate the real field drainage ditch. It is fixed on a steel frame base with a dip angle of 1°along the length direction. The water flow in the channel is driven by a circulating water pump, and the flow rate in the channel can be controlled by the inverter motor driver and the accessory valve system.To eliminate the inlet velocity fluctuation, the water is pumped into an inlet reservoir first and then flows into the water channel through an inlet weir. At the outlet side of the channel, a moveable outlet weir gate is used to control the water level of the channel (of the height of 0.115 m). Twenty ecological porous spurdikes are arranged along the both side of the channel alternatively in the middle region with the gap distance of “D”. The middle section of the channel is selected as the computation domain. The sketch of the experimental channel and the dimension of the computation domain are shown in Fig. 1.
1.2 Experimental materials
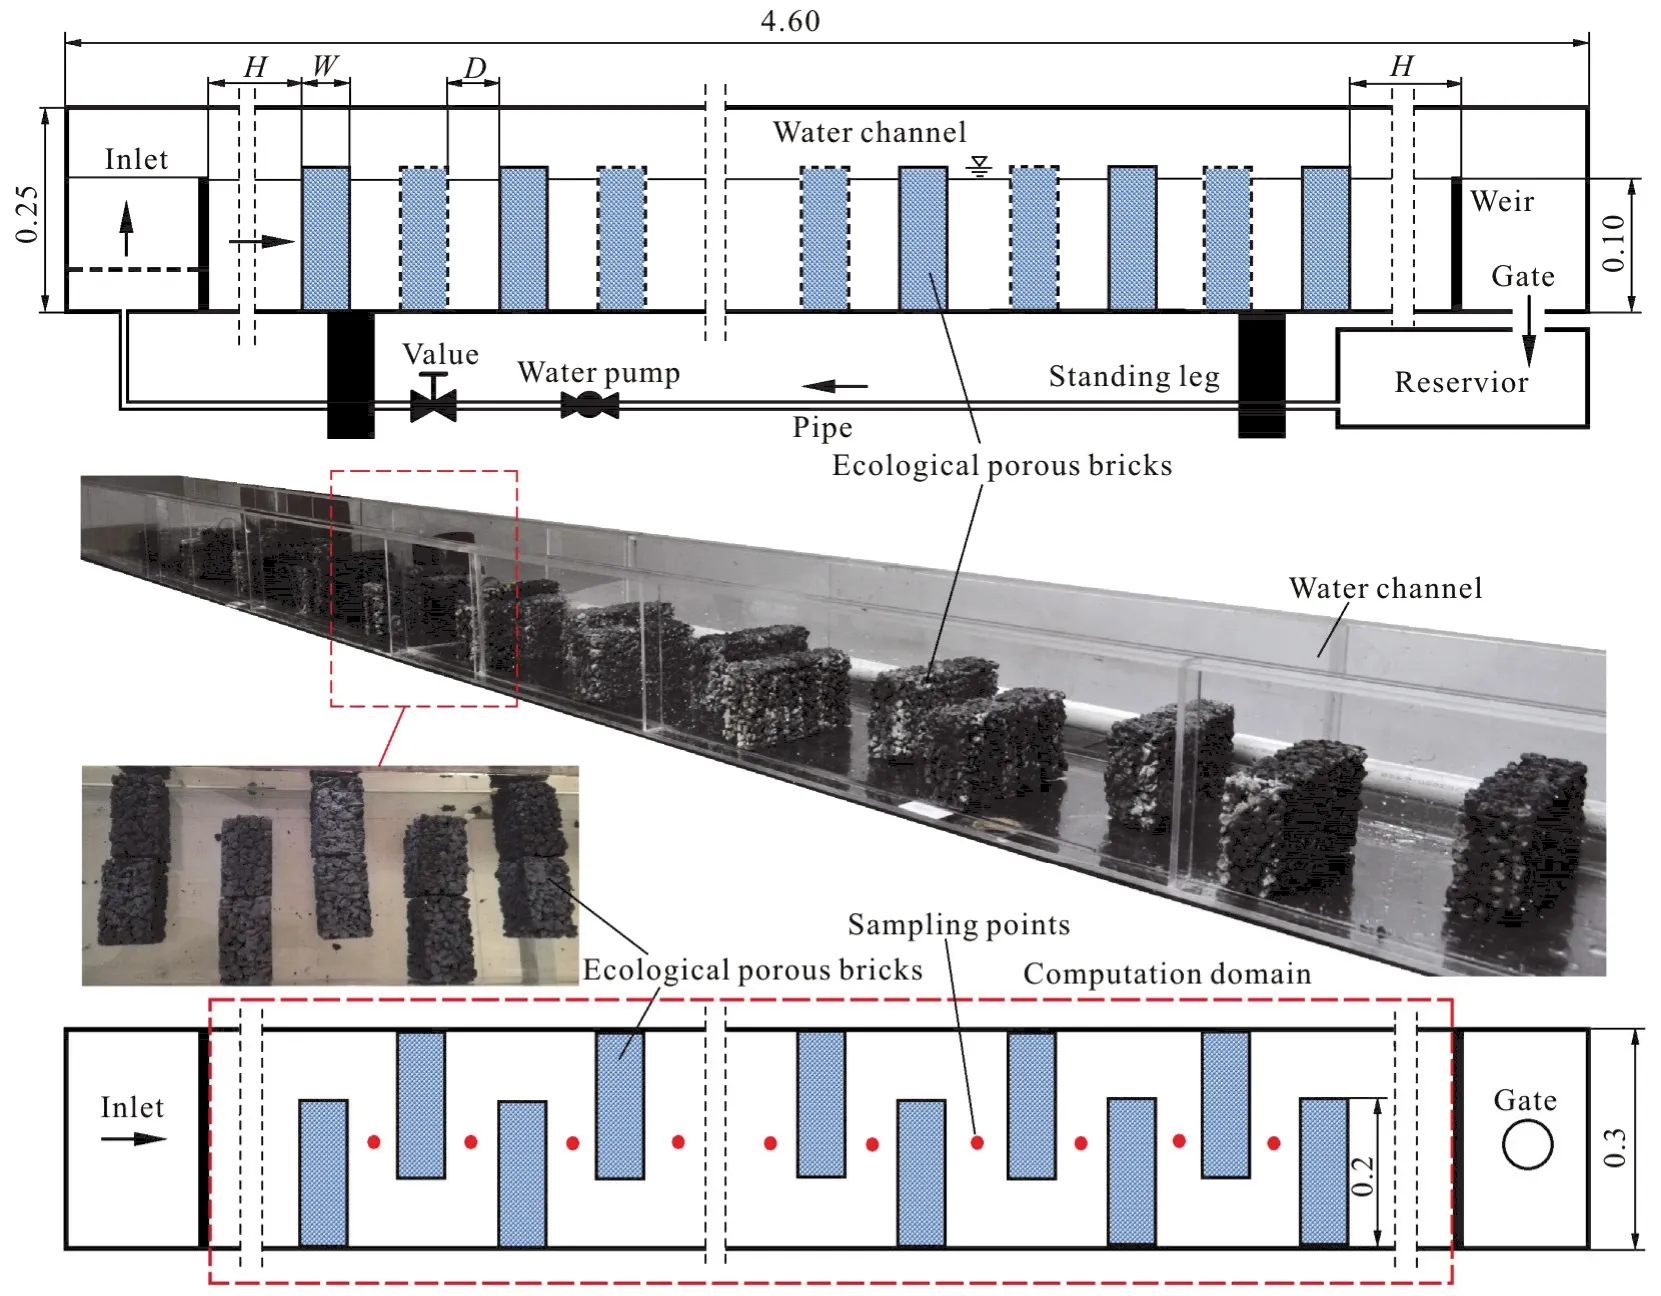
Fig. 1 The sketches of experimental channel and computational domain (m)
The dimension of each spur-dike is 0.20 m×0.06 m×0.12 m, which is a combination of two pieces of porous brick. The porous bricks are made of gravel,cement and some kinds of additional material.Different size of gravel can achieve various porosities and specific surface areas of porous bricks. All porous bricks are dealkalized in pure water for 20 d firstly,and then immersed in nitrobacterium and nutrient solution at 10 L/min circular flow rate and under 25°C℃-30°C ambient temperature condition. The nitrobacterium biological film covers on the internal and external surfaces of porous bricks after 20 d. To study the influence of porosity on the inner flow field and the PRR of the ecological spur-dike, three styles of porous brick with different porosities ( =P15.75%,21.84% and 26.25%) are used in the experiment (Fig.2).
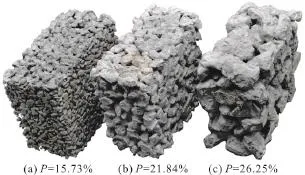
Fig. 2 The ecological porous bricks with different porosities
1.3 Physical experiments
To study the influence of the pollutant degradation efficiency of the ecological porous spur-dike under different hydrodynamics conditions, a series of experiments are performed with different inlet flow velocities (v= 0.005 m/s, 0.020 m/s, 0.030 m/s, 0.040 m/s and 0.050 m/s), gap distances ( =D0.06 m, 0.09 m and 0.12 m) and brick porosities ( =P15.75%, 21.84%and 26.25%). For describing the flow velocity distributions in the experimental channel accurately,the flow velocities at 21 sampling points are measured by Acoustic Doppler Velocimeter (ADV), and the water level of each sampling point is also recorded. To deal with the fluctuation during the flow velocity and water level measurement, a statistical average method is used in these cases.
2. Numerical models
In this study, each spur-dike is assumed to be a continuous porous medium with possible flows in the region. In addition, to simplify the calculation, the porosity of the porous brick keeps unchanged in the calculation process, and the separation and the regrowth of the biological film on the brick surface are neglected here.
2.1 Flow field governing equations
The continuity equation is as follows[13]

wherexu,yuandzurepresent the superficial velocity components inx,yandzdirections,which can be represented as

where the subscriptirepresents the components inx,yandzdirections of a respected variable,iuandivare the superficial velocity and physical velocity components inx,yandzdirections,γis the porosity of the media, which is equal to the porosity of the spur-dike within the spur-dike region,and 1 in other regions.
For describing the water flow in the porous spurdike, an additional source item is required in the Navier-Stokes equations to describe the drag resistance of the porosities of the spur-dike to the water flow. The momentum equations are as follows[14-15]:
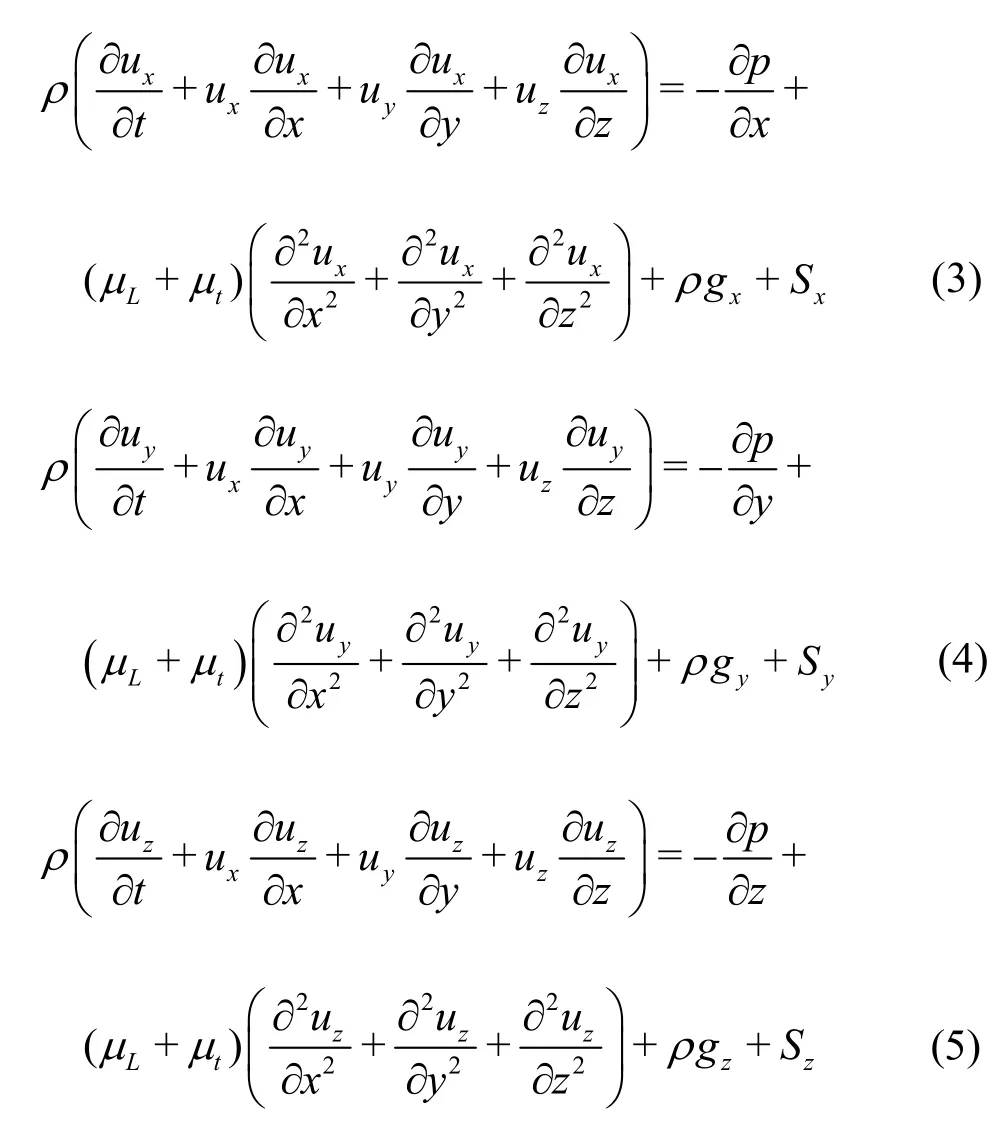
whereρis the density of the water,tis the time,pis the time-averaged pressure,gx,gyandgzare the acceleration of the gravity component,μLis the molecular viscosity coefficient, andμtis the turbulence eddy viscous coefficient of the water.Sx,SyandSzare the additional source item compo-
nents of the drag resistance of the porous spur-dike,described by the momentum variation due to the viscosity and the inertia of the fluid in the continuous porous media[16-17].
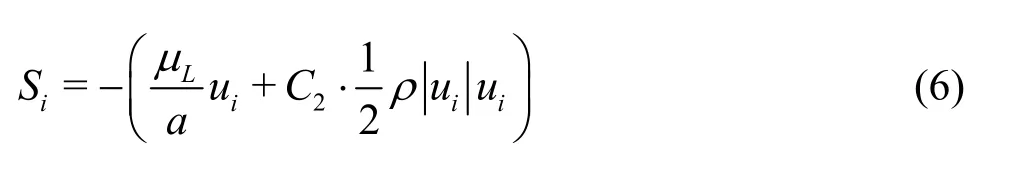
whereiSare the additional source item components inx,yandzdirections (xS,ySandzS),ais the viscosity drag coefficient in the porous spurdike, and2Cis the inertia drag coefficient. Based on the Darcy’s law, these two parameters can be determined by experiments.
The porous spur-dikes can produce a turbulent flow in the channel. Here, the -kεequations are used[18-19]:
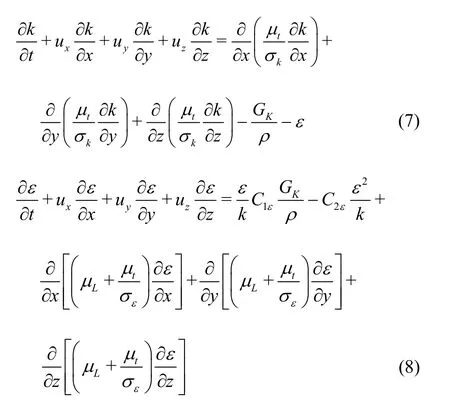
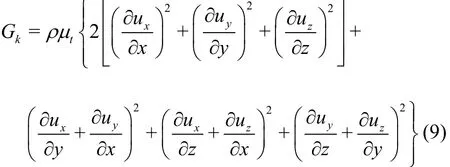
wherekis the turbulence kinetic energy,εis the dissipation rate of the turbulence kinetic energy.kσ,are the Prandtl numbers corresponding tokandε, respectively.1Cε,2Cεare empirical constants,Gkis the turbulent kinetic energy produced by the gradient of the average velocity, described as follows:
Based on thekandε, the turbulence eddy viscous coefficient of the watertμ can be expressed as follows
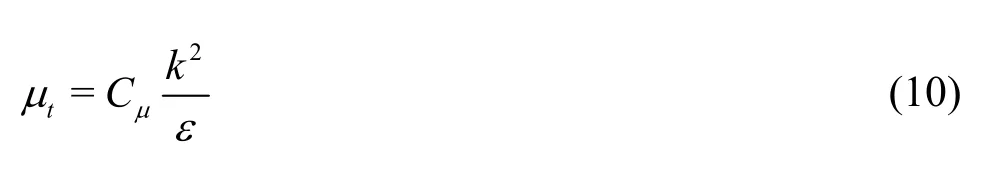
whereCμis an empirical constant.
To determine the water level distribution in the channel, the volume of fluid (VOF) model is used to simulate the motion of the interface between the air and the water. The continuous equation of the volume fraction of the water phase or the air phase can be written as follows
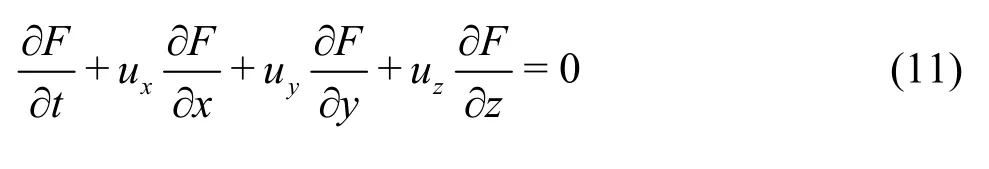
whereFis the volume function for the water phase and the air phase. Based on theFfunction, the free surface of the water flow can be constructed and traced.
2.2 Degradation governing equations
The content of Ammonia-Nitrogen (NH3-N) is an important water quality indicator, which is often used to evaluate the water pollutant state and its selfcleaning capacity. The nitrobacterium of the biological film can absorb and degrade NH3-N in the water effectively. To evaluate the purification efficiency of the ecological porous spur-dike, the NH3-N degradation rate equations of the porous filler are as follows[20]:

where the subscriptjis the serial number of the subregions in a piece of spur-dike,jηis the NH3-N degradation rate of each subregion,1jC-is the initial NH3-N concentration of the inflow water,jCis the final NH3-N concentration of the outflow water,Kis the total degradation coefficient,asis the total interface area between the water and the porous spur-dike per unit area,Mis the total area of a piece of spur-dike,Ais the sectional area of the channel,usis the average flow velocity in the channel, PRR is the pollutant removal rate of a piece of spur-dike,nis the number of subregions in a piece of spur-dike,Qjis the water flow rate of each subregion in the spur-dike, the subscriptbis the serial number of the spur-dike in the channel,Nis the total number of spur-dikes in the channel, PRRbis the pollutant removal rate of the piece of spur-dike with label “b”,TPRR is the total pollutant removal rate of all spur-dikes in the channel,Ncycleis the water cycle numbers in an experiment period,Qinis the inlet flow rate of the channel,Tis the experimental period,Vchannelis the volume of the channel.
2.3 Boundary conditions
The average inlet flow velocity is set as the inlet boundary condition, measured by the ADV. The values ofkandεof the inlet flowcan be calculated using the following empirical equations[13]
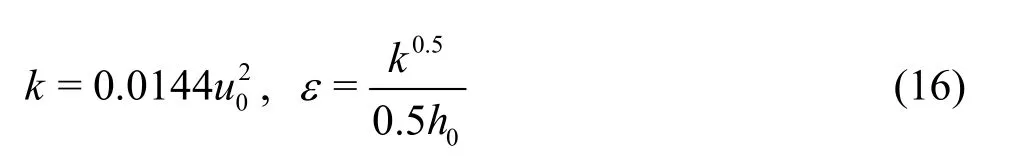
where0his the hydraulic head of the inlet side. In addition, the outlet of the water channel is taken as the outflow boundary, and an atmosphere pressure is set on the interface between the water and the air.Furthermore, the two side walls and the bottom of the water channel are taken as no-slip wall boundaries in the calculation.
3. Results of simulation and experimentand analyses
3.1 The flow velocity distribution
Under the influence of the ecological porous spur-dikes, the flow pattern in the channel is complex,especially in the spur-dikes region. The flow velocity distribution in the channel at the inlet velocity of 0.03 m/s is shown in Fig. 3.
Figure 3 shows that the water flows around the spur-dikes and an “S” shaped pattern appears. The flow direction changes quickly due to the staggered arrangement of spur-dikes. Meanwhile, because the flow through the area is blocked by the spur-dikes, the flow velocity increases sharply in this region. For clearlydescribing the characteristics ofthe flow pattern in the region of spur-dikes, the velocity and water level distributions along the channel obtained by measuring and simulating are shown in Fig. 4,respectively.
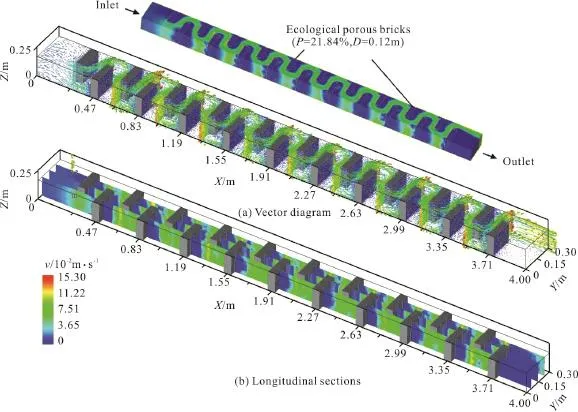
Fig. 3 The flow field in the channel
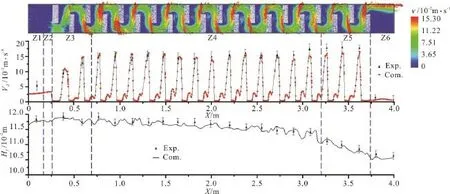
Fig. 4 The flow velocity and water level distributions in channel
In Fig. 4, the channel is separated into six regions from the inlet to the outlet, marked as “Z1” through“Z6”. The “Z1” is the starting section of the water flow. The flow field in this section is smooth and uniform, and the water level is approximately stabilized. In the “Z2” region, the flow direction changes sharply due to the blocking by the first spurdike. The water flow is compressed into a narrow region between the spur-dike and the channel wall.The local flow velocity is, therefore, increased quickly in this region. The “Z3” is the front section of the spur-dike region. The water flows around the spur-dikes and the velocity increases significantly.Meanwhile, the water level arises due to the quickly increased flow resistance in this region. The “Z4” is the section of the stabilized flow pattern in the middle of the channel, and the water level keeps steady there too. The main stream of the water flow passes through the winding path quickly around the spur-dikes.Meanwhile, a small part of water passes through the porous spur-dikes and then mixes with the main stream repeatedly. The “Z5” is the wake flow influenced region of the spur-dikes. The flow velocity increases slightly in this region due to the decreased water level. The “Z6” is the flow structure recovering region. The water level decreases slightly due to the influence of the tail-weir. The flow pressure releases quickly when the water flows out from the end piece of spur-dike. Then, the flow velocity decreases sharply and its distribution tends to be uniform gradually.
The degradation efficiency of the biological film is greatly influenced by the micro flow field inside the spur-dike, and it is also influenced by the macro flow field of the surrounding water. To see the relationship between the macro and micro flow fields clearly, the local flow field and the relative pressure field between two spur-dikes are showed in Fig. 5.
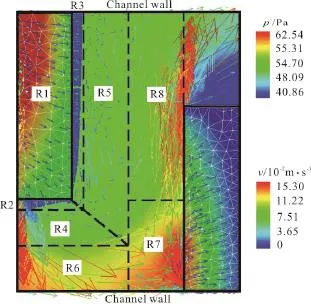
Fig. 5 The flow velocity and the relative pressure distribution between two adjoining spur-dikes
Based on the characteristics of the flow velocity and the relative pressure distribution between two adjoining spur-dikes, eight regions are identified in Fig. 5, marked as “R1” through “R8”. The “R1” is the spur-dike region. In this region, the water flows into the spur-dike body and the velocity decreases quickly due to the drag effect of the porous medium.Meanwhile, the pressure in the upper left area is higher than in other areas significantly. Therefore, the flow rate in the upper left area is the highest in this spur-dike. The “R2” and “R3” are two slim regions beside the spur-dike boundary, and the purified water flows into these regions from two boundaries after passing through the spur-dike. Here, they are named as the lateral outflow region and the forward outflow region, respectively. In the two regions, although the flow direction is the same, the velocity distribution is highly non-uniform. The “R4” and “R5” are the lateral and forward mixing flow regions between the outflow regions (“R2” and “R3”) and the main flow regions(“R6”, “R7” and “R8”) . In the two regions, the pressure gradient is small, but the velocity distribution is strongly non-uniform. The purified water from the outflow regions and the non-purified water from the main flow regions mix here. There are several eddies generated in these regions, which can enhance the pollutant convection diffusion in the water. The “R6”is the main inflow region. Most water flows into the gap of the spur-dikes through this region. The velocity is much higher than that in the “R4” region. The “R7”is the high pressure permeating region. Due to the blocking by the next spur-dike, the flow direction changes sharply, and the pressure near the spur-dike surface is higher than those in other areas. The larger pressure gradient between the outside and the inside of the spur-dike surface can make more water permeating into the porous spur-dike. The “R8” is the tangential outflow region. In this region, the major flow direction is parallel to the spur-dike surface.Meanwhile, the pressure gradient between this region and the spur-dike body makes a small part of water permeating into the porous spur-dike. Furthermore,the larger velocity difference can enhance the mass convection between “R5” and “R8”, “R4” and “R6”regions, as is good to improve the mixing and dilution effect of the residual pollutant in the water.
3.2 The coupling analysis of flow field and PRR in spur-dike
For studying the relationship between the velocity distribution and the local PRR, the micro fluid field inside the porous spur-dike is obtained by the discrete element method. The spur-dike body is divided into 3 layers and 24 subregions, which are named as “A1/B1/C1” through “A8/B8/C8”, respectively. The flow velocity distributions and the subregion locations are shown in Fig. 6.
The water flows into the spur-dike from the layer“A” first, and the velocity distribution in this layer is quite non-uniform. Figure 6 shows that the velocity in the bordering subregions (“A1”, “A2”, “A5” and “A6”)near the channel wall is significantly higher than that in the center subregions (“A3”, “A4”, “A7” and “A8”).And then, the water goes on passing through the layer“B”. With the dragging effect of porosity, the velocity in the layer “B” decreases quickly and its distribution trends to be uniform. Finally, the water passes through the layer “C” and flows out from the back surface of the spur-dike. Based on the degradation governing equations and the flow field in the spur-dike, the PRR values in each subregion within a single cycle period are calculated, respectively. In this study, a 28 h circulation degradation experiment is executed and the water cycle numbers are considered into the TPRR value of each spur-dike. Figure 7 shows the statistics of the PRR distribution in one piece of spur-dike within 28 hours under the condition ofv=0.03m/s ,D= 0.09 m andP= 21.84%.
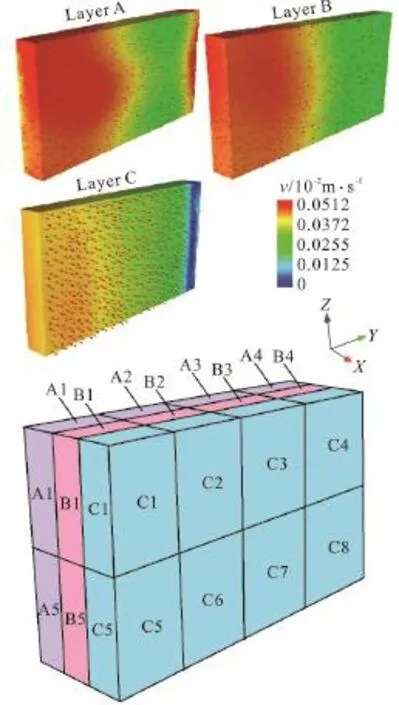
Fig. 6 The flow velocity distribution and the subregions in a spur-dike
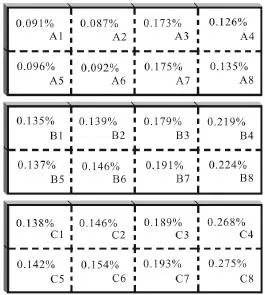
Fig. 7 The PRR distributions of each subregion
The HRT and the water flow rate in each subregion are two important influencing factors directly related with the PRR of each subregion. Figure 7 shows that the contribution rate in the PRR of each subregion is quite different. The PRR of the layers A,B and C are 0.975%, 1.370% and 1.505%, respectively, and the PRR of this piece of spur-dike reaches 3.85% within 28 h. It means that more pollutant is absorbed on the middle layer and behind the layer of spur-dike. In this experiment, the water circulates in the channel many times within an experimental period.The water cycle numbers are considered in the calculation of the TPRR in an experimental period.Increasing cycle numbers can lead to a higher purification efficiency.
4. Discussions
In practice, the pollution purifying capacity of the field drainage ditch is influenced by various factors. The influences of tthe porosity of the spurdike and the gap distance between spur-dikes on the TPRR are discussed, respectively, under different hydrodynamic conditions.
4.1 The influence of porosity and flow veoci TPRR
In a contrast with the traditional impermeable material, the abundant inner pores of the ecological porous material are the major pollutant removing place. The porosity of the porous spur-dike is an important parameter, which not only influences the special surface area and the biological capacity, but also influences the exchanging water quantity and the inner flow field significantly. For studying the influence of the porosity on the TPRR under different hydrodynamic conditions, three kinds of spur-dike with different porosities are considered in the experiment and the simulation. The TPRR-time variation curves for different porosities are shown in Fig. 8, and the TPRR values under conditions of three different porosities and various inlet flow velocities are shown in Fig. 9, respectively.
Figure 8 shows that for the spur-dike with a porosity of 21.84% , a significantly larger TPRR value is obtained than under the conditions of the porosities of 15.73%, 26.25%. Based on the previous macro and micro flow field analysis, it is shown that, with a high porosity spur-dike, smaller drag resistance is achieved than with a low porosity under the same hydrodynamic condition. Hence the exchanging water quantity and the biological capacity of a higher porosity spur-dike (P=26.25%)are larger than those withP=21.84%,P= 15.73%. However, too high porosity also brings about shorter HRT as compared with that under the low porosity conditions, which are not good for improving the purifying capacity of the porous spur-dike. However, although with a lo w porosity spur-dike, a longer HRT can be obtained as compared with one of a high porosity, the exchanging water quantity and the reaction area decrease greatly under the same hydrodynamic conditions. It also limits the purifying efficiency improvement. So, the porosity of the spur-dike should be limited in a reasonable range to achieve a higher TPRR.
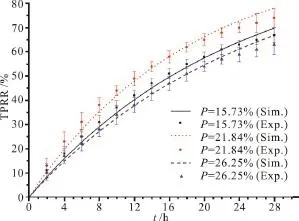
Fig. 8 The TPRR-time variation curves under different porosities ( D =0.09m, v =0.030m/s )
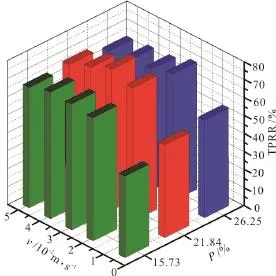
Fig. 9 The TPRR for different porosities and inlet flow velocities (D =0.09m)
Moreover, the flowing water condition is more beneficial to improve the purifying capacity of the ecological porous spur-dike than under a hydrostatic condition. The inner flow field and the exchanging water quantity of each spur-dike are influenced by the macro flow field of the channel. Figure 9 shows that the TPRR variations under three porosity conditions are different with the increase of the flow velocity. For a low porosity spur-dike (P=15.73%), the highest TPRR is achieved at a high flow velocity (v=0.040 m/s). However, the highest TPRR values ofP=21.84%,P=26.25%are achieved atv=0.030 m/s,v=0.020 m/s , respectively. Meanwhile,the TPRR will be limited within a lower level under a slow velocity condition (v=0.010 m/s)in the three cases of porosities. It indicates that the flow velocity condition of the field drainage ditch should be considered seriously, and the porosity of the spur-dike should be chosen within a reasonable range under the real flow velocity condition for achieving a high TPRR.
4.2 The influence of the gap distance and flow velocity on TPRR
As an important construction technological parameter, the gap distance between spur-dikes not only influences the discharge capacity of the field drainage ditch, but also influences the pollutant purification capacity of the spur-dikes significantly. It is hard to achieve a high TPRR under conditions of too short or too large gap distances. For studying the influence of the gap distance on the TPRR, three gap distances are considered here under the condition of the same delivery volume of porous brick. The TPRR-time variation curves for different gap distances are shown in Fig. 10, and the TPRR values under conditions of three different gap distances and various flow velocities are shown in Fig. 11, respectively.
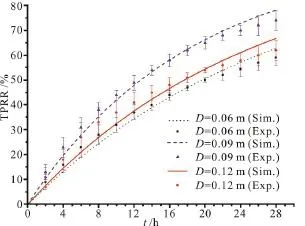
Fig. 10 The TPRR-time curves for different gap distances ( P =21.84%, v =0.030m/s )
Figure 10 shows that the TPRR value forD=0.09 m is significantly higher than those forD=0.06 m,D= 0.12 m. Under the condition of short gap distance (D=0.06 m), the flow velocity decreases in the region of spur-dikes due to a high flow resistance. Although with a slow flow velocity, the HRT can be prolonged in the spur-dike, the low exchanging water quantity also greatly limits the TPRR improvemente. Moreover, a large gap distance(D=0.12 m)can bring about a lower flow resistance than a short gap distance can do. Most water flows around the spur-dikes with a high velocity. It is also hard for the TPRR to reach a satisfactory level due to the low exchanging water quantity and the short HRT in the spur-dike. Hence, the gap distance should be controlled within a reasonable range to reach a balance between the exchanging water quantity and the HRT.
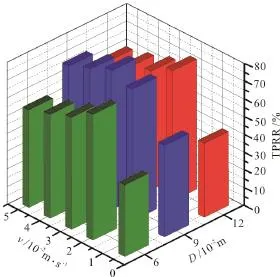
Fig. 11 The TPRR for different gap distances and inlet flow velocities (P = 21.84%)
Furthermore, Fig. 11 shows that the TPRR takes various values with different inlet flow velocities under the same condition of the gap distance. Due to the low exchanging water quantity under the condition of low inlet flow velocity (v=0.010 m/s), the TPRR values are limited at a low level (TPRR<50%)under the condition of the three gap distances. While the inlet flow velocity increases to 0.02 Nm/s, the TPRR for the three gap distances increases sharply and reaches more satisfactory values (TPRR>70%).With the inlet flow velocity increasing from 0.03 m/s to 0.05 m/s, the TPRR under the condition of the three gap distances decreases from 70.62% to 54.74%(D=0.06 m), from 78.18% to 68.43% (D=0.09 m)and from 66.77% to 60.11% (D=0.12 m), respectively. Hence, the gap distance should be chosen carefully based on the actual flow velocity condition of the ditch. A reasonable gap distance of the spurdike can bring about a satisfactory purifying efficiency with the same delivery quantity of ecological porous materials.
5. Conclusions
Based on the coupling analysis of the flow field and the PRR of the ecological porous spur-dike under various hydrodynamic conditions, some results are obtained, as summarized as follows:
(1) The ecological porous spur-dike can effectively improve the pollutant removal capacity of the cemented field drainage ditch. Based on the coupling method and the discrete analysis of the inner flow field and the PRR of the ecological porous spur-dike,the TPRR in the field drainage ditch can be evaluated accurately.
(2) The porosity of the porous spur-dike is an important parameter, which not only influences the special surface area and the biological capacity, but also influences the quantity of the exchanging water and the inner flow field significantly. In practice, the porosity of the spur-dike should be limited in a reasonable range to achieve a high TPRR.
(3) The gap distance between spur-dikes can influence the discharge capacity and the TPRR of the field drainage ditch greatly. Too short or too large gap distances are not good to achieve a balance between the exchanging water quantity and the HRT in the spur-dike. It should be controlled within a reasonable range to improve the TPRR.
(4) The porosity and the gap distance of the spur-dike should be chosen carefully based on the actual flow velocity condition of the field drainage ditch. Reasonable parameter matching of the porosity and the gap distance by the flow velocity of the ditch can bring about a satisfactory purifying efficiency with a amall delivery quantity of ecological porous materials.
[1] Zhang Z., Robin B., Jay B. et al. Nutrient dynamics within drainage ditches under recent, medium, and long-term drainage in the Black soil zone of southeastern Saskatchewan [J].Geoderma, 2017, 289(11): 66-71.
[2] Tao Y., Wang S., Xu D. et al. Field and numerical experiment of an improved subsurface drainage system in Huaibei plain [J].Agricultural Water Management, 2017,194(9): 24-32.
[3] Farzana A., John S. G., Nieber J. L. Field infiltration measurements in grassed roadside drainage ditches:Spatial and temporal variability [J].Journal of Hydrology,2015, 530(10): 604-611.
[4] Zhang S., Liu F., Xiao R. et al. Effects of vegetation on ammonium removal and nitrous oxide emissions from pilot-scale drainage ditches [J].Aquatic Botany, 2016,130(1): 37-44.
[5] Mathieu N. K., Zhu B., Fidele S. et al. Long-term impact of primary domestic sewage on metal/loid accumulation in drainage ditch sediments, plants and water: Implications for phytoremediation and restoration [J]. Science of the Total Environment, 2017, 581-582(1): 773-781.
[6] Shao W., Zhang H., Liu J. et al. Data integration and its application in the sponge city construction of China [C].12th International Conference on Hydroinformatics,Incheon, Korea, 2016, 779-786.
[7] Wang Y., Sun M., Song B. Public perceptions of and willingness to pay for sponge city initiativesin China [J].Resources, Conservation and Recycling, 2017, 122(2):11-20.
[8] Yuan X., Tang Y., Li Y. et al. Environmental and economic impacts assessment of concrete pavement brick and permeable brick production process-A case study in China[J].Journal of Cleaner Production, 2017,171(10):198-208.
[9] Zhang S., Li M., Cheng J. et al. Response and environmental assessment of two Chinese conventional carps to water quality regulation in recirculating aquaculture [J].Aquacultural Engineering, 2016, 74(9): 180-185.
[10] Chen S., Chu Z. Purification efficiency of nitrogen and phosphorus in Ottelia acuminata on four kinds of simulated sewage [J].Ecological Engineering, 2016, 93(5):159-165.
[11] Long Y., Bing Y., Zhang Z. et al. Influence of plantation on microbial community in porous concrete treating polluted surface water [J].International Biodeterioration and Biodegradation, 2017, 117(11): 8-13.
[12] Rao L., Qian J., Ao Y. H. Influence of artificial ecological floating beds on river hydraulic characteristics [J].Journal of Hydrodynamics, 2014, 26(3): 474-481.
[13] Si Salah S. A., Filali E. G., Djellouli S. Numerical investigation of Reynolds number and scaling effects in microchannels flows [J].Journal of Hydrodynamics, 2017,29(4): 647-658.
[14] Xu Z. H., Ma G. W., Li S. C. A graph theoretic pipe network method for water flow simulation in a porous medium: GPNM [J].International Journal of Heat and Fluid Flow, 2014, 45(2): 81-97.
[15] Alves B., Barletta A., Hirata S. et al. Effects of viscous dissipation on the convective instability of viscoelastic mixed convection flows in porous media [J].International Journal of Heat and Mass Transfer, 2014, 70(3): 586-598.
[16] Zhan J. M., Hu W. Q., Cai W. H. et al. Numerical simulation of flow through circular array of cylinders using porous media approach with non-constant local intertial resistance coefficient [J].Journal of Hydrodynamics, 2017,29(1): 168-171.
[17] Ku X., Lin J., Annaland M. V. S. et al. Numerical simulation of the accumulation of heavy particles in a circular bounded vortex flow [J].International Journal of Multiphase Flow, 2016, 87(8): 80-89.
[18] Aghaie M., Gheisari F., Zolfaghari A. Investigation of flapper valve malfunction in Tehran research reactor with porous media model [J].Progress in Nuclear Energy,2018, 105(5): 221-235.
[19] Tang M., Lu S., Zhan H. et al. The effect of a microscale fracture on dynamic capillary pressure of two phase flow in porous media [J].Advances in Water Resources, 2018,113(5): 272-284.
[20] Tian W. J. The direct biological strengthen purification mechanism and experimental study on weak pollution river [D]. Doctoral Thesis, Nanjing, China: Hohai University, 2005(in Chinese).
猜你喜欢
杂志排行

水动力学研究与进展 B辑的其它文章
- Numerical simulation of wave-current interaction using the SPH method *
- Simulation of violent free surface flow by AMR method *
- Experimental research on kinematics of breaking waves *
- Fundamental problems in hydrodynamics of ellipsoidal forms *
- Case study on wave-current interaction and its effects on ship navigation *
- Numerical simulation of cementing displacement interface stability of extended reach wells *