The Collaborative Cross mouse genetic reference population designed for dissecting complex traits
2016-09-13HanifaAbuToamihAtamniMahmoudEgbariaYaserSalaymehAysarNashifandFuadIraqi
Hanifa Abu Toamih Atamni, Mahmoud Egbaria, Yaser Salaymeh, Aysar Nashif and Fuad A. Iraqi
(1.Department of Clinical Microbiology and Immunology, Sackler Faculty of Medicine, Tel Aviv University, Ramat Aviv, Tel Aviv,Israel;2.Department of Prosthodontics, Dental School at Hadassah, Hebrew University, Jerusalem, Israel)
专题研究
The Collaborative Cross mouse genetic reference population designed for dissecting complex traits
Hanifa Abu Toamih Atamni1, Mahmoud Egbaria1, Yaser Salaymeh1, Aysar Nashif2and Fuad A. Iraqi1
(1.Department of Clinical Microbiology and Immunology, Sackler Faculty of Medicine, Tel Aviv University, Ramat Aviv, Tel Aviv,Israel;2.Department of Prosthodontics, Dental School at Hadassah, Hebrew University, Jerusalem, Israel)
Complex traits are multifactorial traits controlled by polygenic host factors. These trait-related phenotypic characteristics and performance including body weight, blood chemistry, immune cell profiles, as well host susceptibility to infectious and chronic diseases. In recent years, tremendous efforts were invested aiming to map the host genetic factors attribute to these traits and subsequently clone the gene/s underlying these loci. In parallel to human studies, a number of mouse models and approaches were developed aimed to enhance the mapping process and the gene cloning. These include of using resources such as F2, backcross, advanced intercross lines, outbred populations, consomic, congenic and recombinant inbred lines (RIL). The constraints of these approaches were the limited resolution mapping of genomic regions of the quantitative trait loci (QTL) associated with the trait of interests, and the limited genetic diversity observed in the parental founders. To overcome these limitations, a new genetically highly diverse recombinant inbred lines of mouse population was established, namely the Collaborative Cross (CC), created from full reciprocal mating of 8 divergent strains of mice: A/J, C57BL/6J, 129S1/SvImJ, NOD/LtJ, NZO/HiLtJ, CAST/Ei, PWK/PhJ, and WSB/EiJ. By intercrossing these eight founders to generate the different CC lines, the genetic makeup of the newly developed resource is completely different from the eight parental lines, and will show heterosis, which subsequently will response differently comparing with their original founders. Finally, our results suggest that it is not essential to defining the phenotypic response of the eight parental lines, prior of assessing the CC lines, because it is believed that genetic interaction of the new genetic makeup of the new lines will reveal new phenotypic response, which completely different from the parental lines.In this report, we present to the community the power of the CC for dissecting variety of complex traits including host susceptibility to infectious and chronic diseases as well body performance traits. Based on our results from a variety of studies, we recommend to the community, that the best strategy of using this population is to aim of phenotyping about 50 and more of CC lines, with limited number of biological replicates (3-4 mice per line), and subsequently using the publicly available high dense genotype information of the CC lines as well the sequence database of the eight founders, it will be possible performing QTL mapping to a unprecedented precision genomic regions less than 1 MB, subsequently lead to identify potential strong candidate genes. These achievements are believed cannot be obtained with any other currently available mouse resource populations.
Background
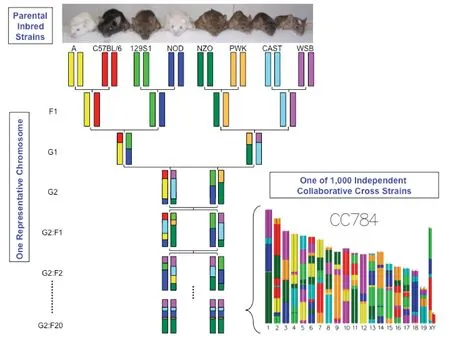
Fig.1 Single CC line (CC784) funnel breeding scheme by eight founder strains. Each CC line originates from an independently breeding funnel of the eight CC founders so that every recombination site in the CC population is, uniquely generated. In this example, a CC line is produced from the breeding line with laboratory code. [Threadgill and Churchill 2012]
Controlled and standardized investigations of the genetics of susceptibility towards complex disease with complex etiologies, including infectious and chronic diseases are almost impossible to be performed in humans due to multiple limitations. Major limitations are due to difficulty of controlling environmental challenges, and since susceptibility itself is a “complex trait”, meaning that, it is controlled by the cumulative effect and interactions of numerous genetic loci and environmental factors. In crosses between genetically defined strains of mice, chromosomal regions responsible for the genetic variance of complex traits can be mapped as quantitative trait loci (QTL) in experimental populations available for precise study under defined conditions (Iraqi et al. 2000a and 2000b). Importantly, comparative mapping shows that the majority of murine genes have known homologues in the human genome emphasizing the relevance of QTL analysis and gene identification in the mouse model for understanding complex disease in humans. Once QTL or the corresponding genes have been identified in the mouse, genetic analysis can then be extended successfully to humans. It is well know that the usage of mouse models is tightly established in research of human medicine (Klopocki et al. 2010; Rankinen et al. 2006; Wicker et al. 2005). In recent years, evidence of genetic loci controlling a wide variety of complex traits has accumulated through QTL mapping studies in mice and other species; yet for the most part, albeit with some important exceptions, the genes underlying these mapped loci remain unknown. This resulted in the realization that a new model-population dedicated to genetic analysis of complex traits was needed to understand complex human diseases. After much discussion in the genetics community the Collaborative Cross (CC) was designed to provide a new mouse resource for high resolution analysis of complex traits, with particular emphasis on traits relevant to human health in its broadest aspects (Threadgill et al. 2002; Churchill et al. 2004). This unique reference genetic resource will eventually comprise a set of approximately 350 recombinant inbred lines (RIL) created from full reciprocal matings of 8 divergent strains of mice:A/J, C57BL/6J, 129S1/SvImJ, NOD/LtJ, NZO/HiLtJ, CAST/Ei, PWK/PhJ, and WSB/EiJ. Controlled randomization was performed during the breeding process to break up large linkage disequilibrium blocks and to recombine the natural genetic variation present in these inbred strains with the aim to create a unique and inexhaustible resource of RI strains exhibiting a large phenotypic and genetic diversity (Roberts et al. 2007). Figure 1 shows the development of an individual CC line and the ultimate mosaic genotype structure after a series of inbreeding generations.

Fig.2 Reconstructions of the genomes of representative CC lines IL-18 and IL-507 from the hidden Markov model (HMM) implemented by HAPPY program. The X-axis shows the 19 autosomes, the Y-axis shows 8 parental founder strains of the CC lines. The black horizontal bands represent genetically fixed loci, contributed only by one founder, while gray bands represent loci with residual heterozygosis [Durrant et al.2011].
Based on simulation studies, the 100 RIL being developed at our lab should allow mapping a QTL explaining a total of 5% of the RIL phenotypic variation (equivalent to 2.5% of F2 variation) to an average mean location error of 3.5 cM (Valdar et al. 2006). Initially, all CC mice were genotyped with mouse diversity array (MDA) that consist 620,000 SNP markers (Yang et al. 2009). We filtered out all SNPs with heterozygous or missing genotypes in the 8 CC founders, or that were not in common between the arrays, leaving 170,935 SNPs. The SNPs were mapped onto build 37 of the mouse genome. The HAPPY HMM (Mott et al. 2000) computed a descent probability distribution for each of the 170,935 SNPs intervals, which we reduced to 8533 intervals by averaging the matrices in groups ofn=20 consecutive SNPs. This reduction reduced further the effects of genotyping error and made analysis faster. Mean heterozygosity was computed across each window of 20 SNPs. Figure 2 shows the genomic reconstruction of a CC line after genotyping with the MDA and using HAPPY software (Mott et al. 2005). Recently, all mice were regenotyped at an advanced generations with new 7500 custom design SNP array, mouse universal genotype array (MUGA), which provided the genome architecture of the CC lines (Iraqi et al., 2011). Finally, after 5 advanced generations, all CC lines were genotyped with MegaMUGA, and the genotypes of the three SNP arrays were merged to prepare a single genotype file, which was used in QTL mapping (Levy et al. 2015).
Three founders of the CC (CAST/EiJ, PWK/PhJ, and WSB/EiJ) are wild-derived, representing the subspeciesM.mcastaneus,M.mmusculusandM.m.domesticusrespectively, and which contribute a large number of sequence variants not segregating among classical strains descended fromM.m.domesticus(most classical strains differ from the reference C57BL/6J at about 4 million SNPs, whereas PWK and CAST each differ at about 17 million SNPs, and WSB at 6 million (Keane et al. 2011).
Consequently quantitative trait locus (QTL) mapping using the CC succeeded to uncover novel QTLs involving contrasts between the wild-derived strains, as shown in a pilot experiment in which we fine-mapped QTLs associated with survival after infection byAspergillusfumigatus, we mapped eight QTLs, five of which involved contrasts with wild-derived strains and which would not have been present in a cross between classical laboratory inbred strains (LIS) (Fig.3). These studies confirm that by phenotyping a relatively modest number of CC lines (around 70 lines), with sufficient replication, it is possible to map QTLs to a resolution of about 1Mb (Valdar et al. 2006).

Fig.3 Estimated effects on survival time after Aspergillus fumigatus infection, for the eight CC founder strains for each of seven QTLs identified in a screen of 66 CC lines. Effects are shown as deviations relative to WSB/EiJ, which is arbitrarily assigned the trait effect of 0. The X-axis of each plot shows the founder strains. The Y-axis shows the estimated effect on survival for the haplotype of the corresponding CC founder. QTLs A, B, C, G and to some extent D all involve a contrast between a wild-derived strain (CAST, PWK or WSB) and the other founders. [Durrant et al.2011].
In a recent study, we have shown that the genetic background of the CC mice is the main determinant of gut microbiome diversity (Kovacs et al. 2011). These results are another strong proof that the genetic makeup of the CC is unique and can lead to understand their effect on host response and performance.
Further, by incorporating variation data from the genome sequences of the CC founders - available from the Sanger Mouse Genomes Project (Keane et al. 2011) - and restricting attention to variants whose differences across the founders are consistent with the pattern of action of the QTL (Yalcin et al. 2005), the list of candidate genes under QTLs can be significantly refined. These studies confirm that by phenotyping a relatively modest number of CC lines (around 70 lines), with sufficient replication, it is possible to map QTLs to a resolution of about 1 Mb (Durrant et al. 2011; Vered et al. 2014; Levy et al. 2015; Aylor et al. 2011; Philip et al. 2011; Kelada et al. 2011; Xiong et al. 2014; Ram et al. 2014; Gralinski et al. 2015; Rogala et al. 2014; Phillippi et al. 2014; Ferris et al. 2013; Thaisz et al. 2012; Bottomly et al. 2012; Mathes et al. 2011; Gelinas et al. 2011; Zombeck et al. 2011).
Mouse Genetic Resource populations (GRPs) are popular for the study of complex traits and biological systems in both medical and life sciences applications because genotyping is only required once (what has been described as the “genotype once, phenotype many times” paradigm), replicate individuals can be produced with the same genotype at will allowing for optimal case/control and gene-by-environment designs (Broman 2005).
Herein we demonstrate our various studies using the CC mouse population for dissecting the genetic architecture underlying the phenotypic variation observed among certain, populations, defined as complex trait in either basic biological/physiological differences or host response towards infectious or chronic diseases. Infectious disease studies in our lab scanned independently the CC population response towards various known pathogens, such asAspergillusfumigatus(Durrant et al. 2011),Klebsiellapneumoniae(Vered et al. 2014), co-infection withPorphyromonasgingivalisandFusobacteriumnucleatum(Shusterman et al. 2013),Pseudomonasaeruginosa(Lorè et al. 2015), and host response towards microbial toxins (LPS/LPA) for study ofsepsis. As well, complex chronic diseases, cancer and behavioral diseases with complex etiologies were studies at our lab using the power of the CC population. Including study of high-fat diet induced type 2 diabetes (T2D) and metabolic syndrome (Atamni et al. 2016), development of colon cancer (Dorman et al. 2016),and autism. Additionally, we are scanning the CC population for genetic factors underlying basic phenotypic variation in normal state without disease in the background, this includes influencing immune response cell lineages in peripheral blood, body composition traits using dual-energy X-ray absorptiometry (DEXA). Understanding the host susceptibility to all of these complex traits is important since all affecting all systems under the same genetic background.
Published Results Using Collaborative Cross population
1 Infectious diseases
1.1Map host susceptibility toAspergillusfumigatusinfection
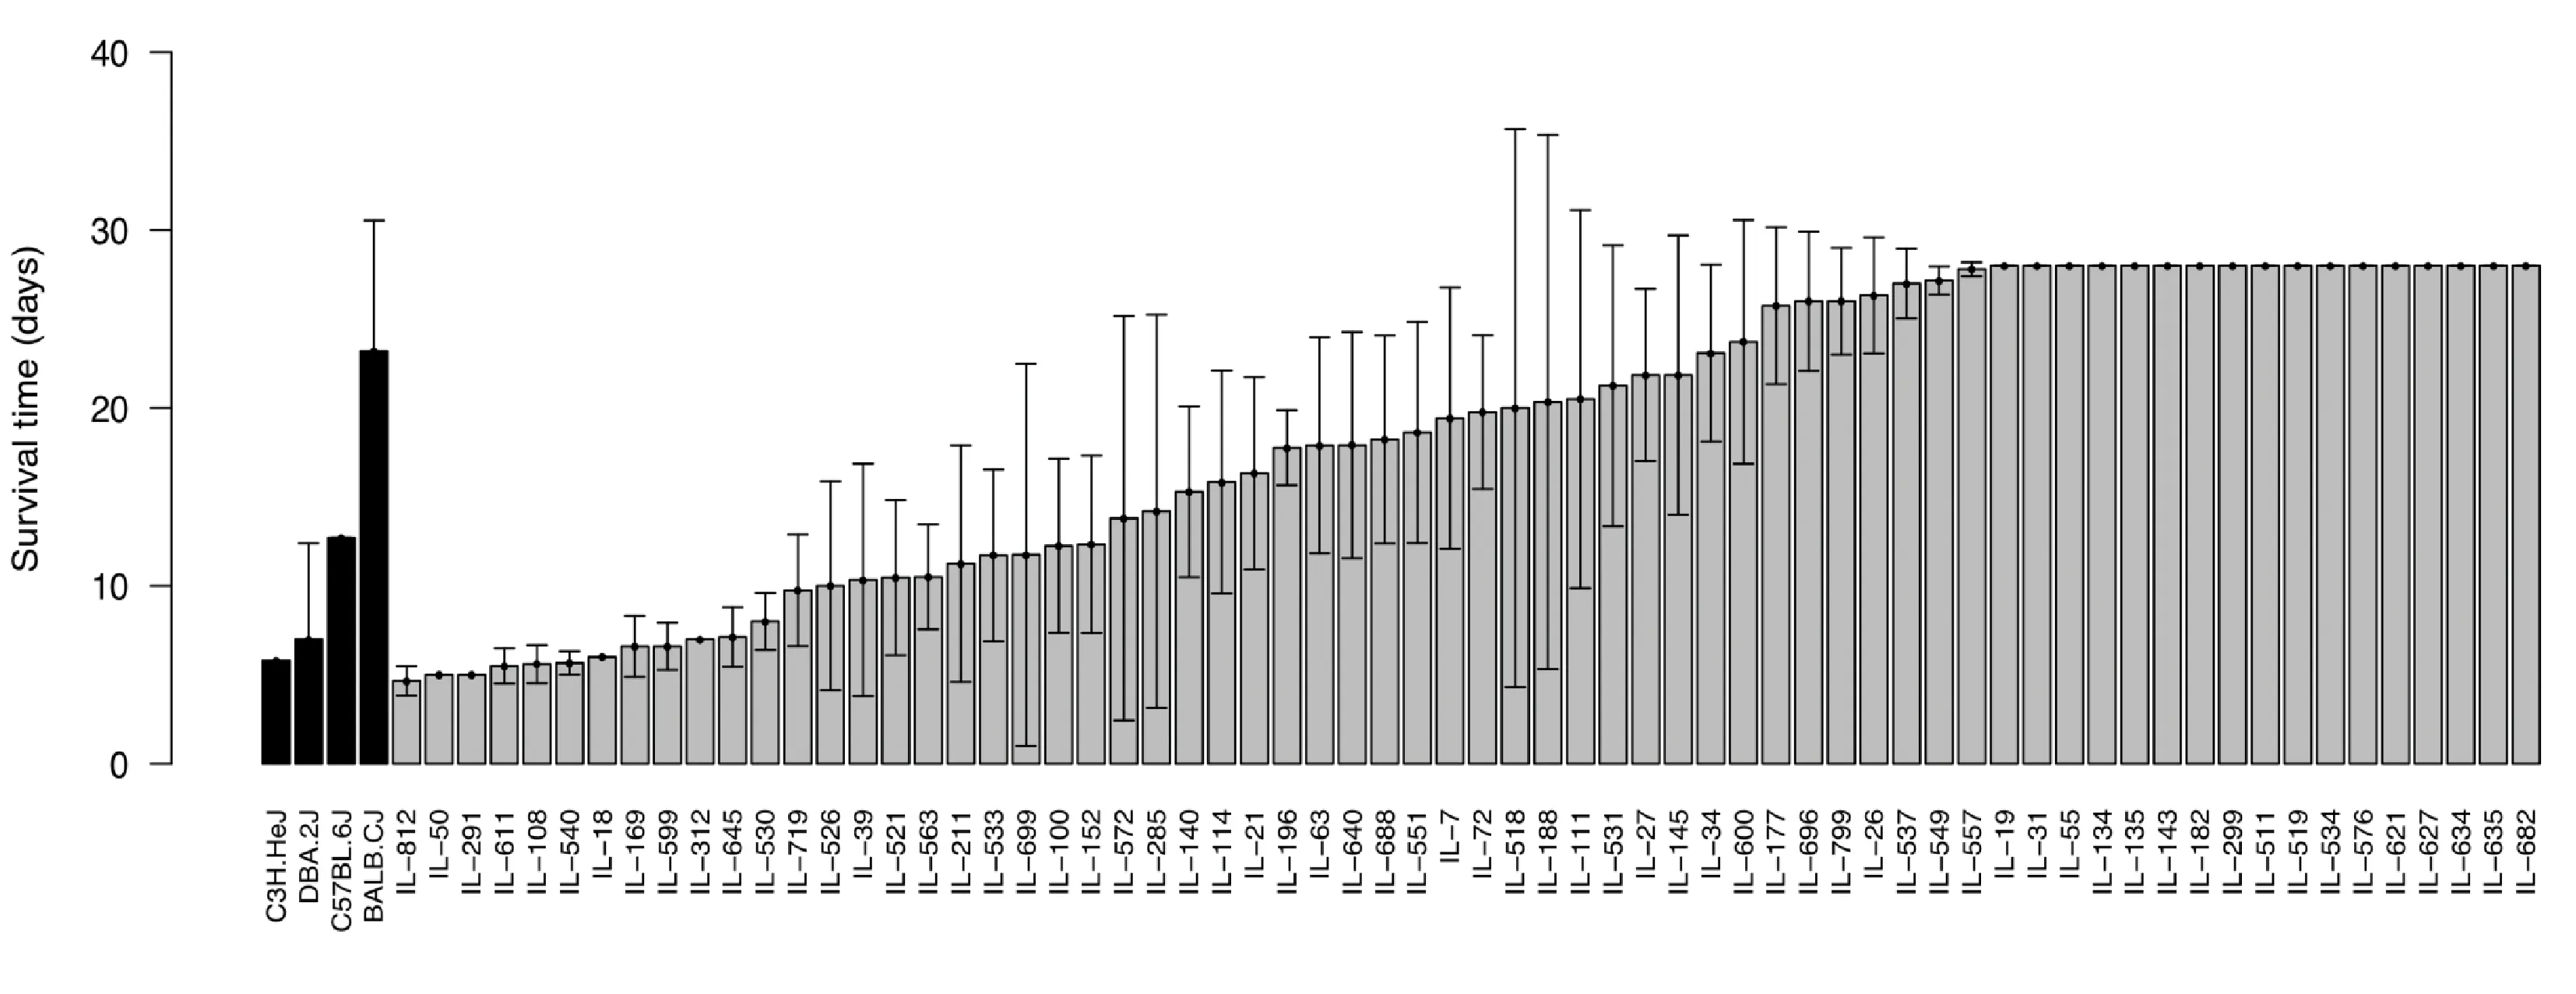
Fig.4 Mean survival time (days) of different CC lines in response to Aspergillus fumigatus infection. The X-axis represents the different CC lines while Y-axis represents the mean survival days (±SEM). Full details of the analysis are presented in Durrant et al.2011.
Invasive disseminated aspergillosis is a serious disease in humans, inflicting severe damage to the kidneys, liver, spleen, brain, heart and other organs (Latgé 1999, Soubani and Chandrasekar 2002). The risk of acquiring invasive pulmonary aspergillosis is also higher in individuals with defective immune systems, such as those suffering from neutropenia. Users of corticosteroids or other immunosuppressive therapies, such as those used to prevent rejection following organ transplantation, and late-stage human immunodeficiency virus infection are also at higher risk. Towards mapping of host succeptability toAspergillusfumigatus(AF), in previous study we phenotyped 371 mice from 66 CC lines for susceptibility toAspergillusfumigatusinfection. The survival time after infection ranged from 4 to 28 days and varied significantly between CC lines (P<0.05). Figure 4 shows the mean survival profile of the CC lines after infection with AF. Broad sense heritability was 0.18. QTL mapping based on survival analysis and ancestral haplotype reconstruction of the CC genomes identified genome-wide significant QTLs on chromosomes 2, 3, 8, 10 (two QTL), 15 and 18. QTL mapping resolution varied between 2 and 11.6 Mb. Use of variation data from the genomes of the CC founder strains refine these QTLs further and suggest several candidate genes (Durrant et al. 2011). To our knowledge this was the first report mapping susceptibility loci for invasive aspergillosis in immune-competent mice.
1.2Map host susceptibility toKlebsiellapneumoniaeinfection.
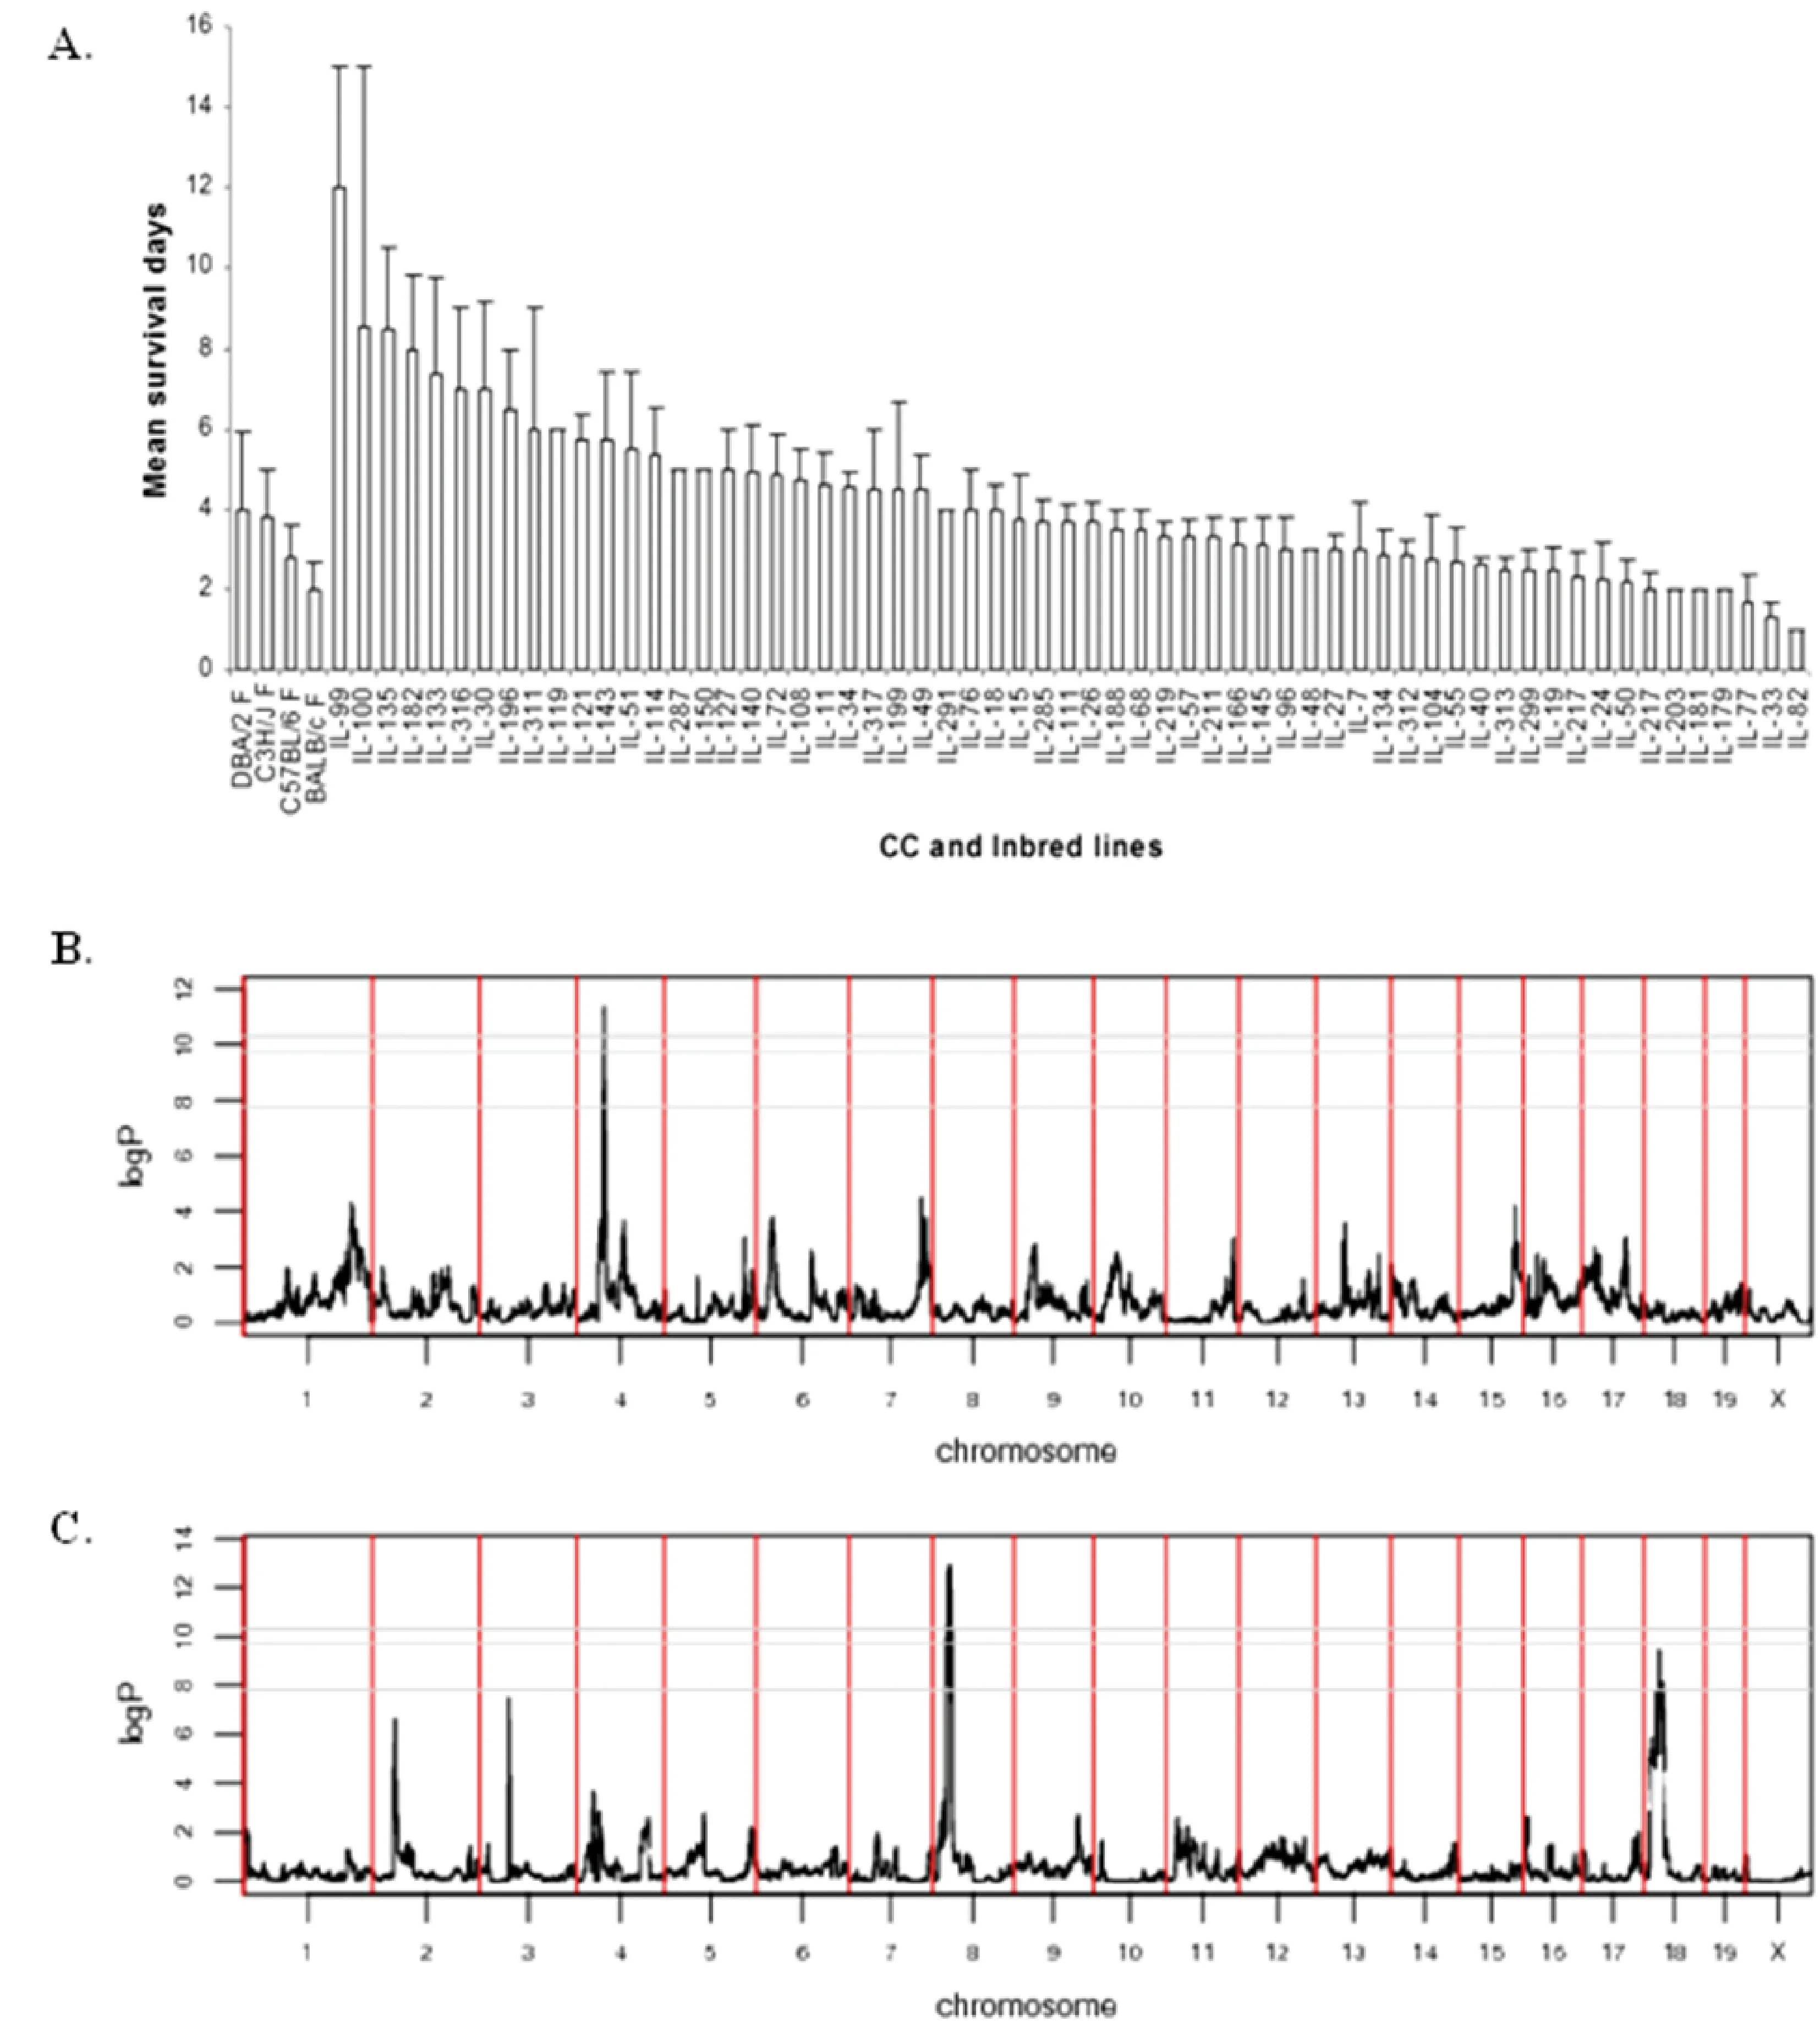
Fig.5 Genetic dissection of host response to Klebsiella pneumonia infection. Fig. 5 A. shows phenotypic profile of mean survival time (days) of the different CC lines and four inbred strains after infection with Klebsiella pneumonia. X-axis represents the CC lines, Y-axis represents the mean survival time in days (±SEM). Fig. 5 B and C present the QTL mapping results using the phenotypic and genotypic data of the CC lines.In total results revealed three significant QTLs associated with survival time after infection with Kp, on days QTL on chromosome 4 named Kprl1 (Fig. 5 B) and on day 8 two QTLs named Kprl2 and Kprl3 on chromosomes 8 and 18, respectively (C). The X-axis shows the 19 chromosomes, Y-axis logP of the linkage analysis. [Vered et al.2014]
Klebsiellapneumoniae(Kp), is one of the major pulmonary pathogens causing severe pneumonia and sepsis mainly in immunocompromised patients. Using the Collaborative Cross population as a high genetically diverse reference and intraperitoneal injection of Kp as infectious challenge, enabled us dissecting the genetic architecture contributing to Kp host susceptibility at different time points during the challenge. For this purpose, 328 mice generated from 73 CC lines were challenged with K-2, strain of Kp, at concentration of 104CFU/ml (Colony forming units per ml) injected intraperitoneally (IP). Mice response towards the infection was monitored daily following the challenge for 15 days, at terms of body weight and survival. InVeredetal. 2014 we have published our findings, while body weight variation between the CC lines were not significant during the infection period, significant variation (P<0.05) was observed in mean survival time between the different CC lines (Fig.5A). Survival time following theKpinfection varied among the C lines to result in survival between 2 to 15 days post infection, importantly we noticed that mice that survived more than 7 days could survive the complete challenge period, which might be critical time point for the disease. The wide variation observed in response to infection proves that host response to infection is highly heritable, controlled by genes. Indeed broad sense heritability (H2) confirm this, where H2was 0.45. Next step aimed to map the genetic regions underlying the significant variances of the mean survival time at different time points between days 1 to 2. Using only 48 CC lines of the unique mouse model of CC population enables successful mapping of at least three QTLs associated with host susceptibility toKlebsiellapneumonia(Fig.5B). Linkage analysis has confirmed the mapping of three significant QTLs, namedKlebsiellapneumoniaresistantlocus 1, 2, and 3 (Kprl1,Kprl2 andKprl3), located onchromosomes4, 8,and18, respectively. The mapped QTLs were specific to certain time points during the infection, suggesting different “players” (genes) changing during response progress (Chr. 4 - day 2 and Chr. 8 and 18 for day 8).
The mentioned QTLs demonstrate the power of the CC population to enable fine mapping with high resolution suggesting narrow genomic intervals (less than 0.6 Mb), whereas the wild derived strains were the main contributors for the genetic variance for the hosts susceptibility. Gene browse results of the significant QTLs for candidate genes, confirmed their relevance towards the complex trait of susceptibility towardsKlebsielapneumonia. Candidate genes located within the QTLs intervals included known protein coding genes that are involved in cell adhesion and cytoskeleton structure, which plays major role phagocytosis and for eliminating bacterial infection (Kprl1 QTL; candidate genesIkbkap-Inhibitorof kappa light polypeptide gene enhancer in B-cells, kinase complex-associated protein,Actl7aandActl7b-actin-like7a and 7b, while forKprl1 QTL;Ctnnal1- catenin alpha-like 1 gene).
This was the first report of mapping multiple host susceptibility loci for Kp in immune-competent mice, which demonstrate significantly the complexity of host response to Kp infection despite the fixed environmental conditions. QTL analysis suggests multiple Kp-specific regions on the genome, that differ from the QTL in response toAspergillusfumigatus, involving genes with different roles during infection and host response. All these results and success of fine mapping with unique resolution have confirmed the valuable use of the three wild derived strains, as founders of the CC population.
1.3Map host susceptibility to oral mixed infection (P.gingivalisandF.nucleatum)
Periodontal infection (periodontitis) is the most common chronic inflammatory disease in humans, which results in destruction of tooth-supporting tissues and eventually leading to tooth loss. This process is characterized by destruction of the periodontal ligament, formation of periodontal pockets, and alveolar bone resorption (Williams. 1990). The disease is initiated by periodontal pathogenic bacteria, which accumulate as subgingival biofilm and stimulate an inflammatory response in the host gingiva (Wilson. 1995). An excessive or sustained response leads to chronic inflammation, which is a potent amplification system for recruiting humoral and cellular components of the immune system. Recently, several lines of evidence suggest that there is a significant genetic component associated with the susceptibility to chronic periodontitis (Baker et al. 2000 and 2002). We use the oral mixed infection system (of the two anaerobic gram negative bacteriaPorphyromonasgingivalisandFusobacteriumnucleatum) as was previously described by Polak (Polak et al. 2009). The phenotype is measured as the residual alveolar bone volume, in mm3, after infection using the micro-CT scan, which provides an accurate measurement of the attachment loss around the animal teeth (Wilensky et al. 2005). As a step towards identifying and subsequently cloning these genetic factors, we have assessed a total of 272 mice (103 females and 169 males) generated from randomly selected 23 CC lines used as genetic reference (genotype) and infection withPorphyromonasgingivalisandFusobacteriumnucleatumas environmental challenge for bone loss evaluation (phenotype). The study cohort consisted of two experimental groups; 1) Control - treated with phosphate buffered-saline (PBS) without bacteria (CBV=control bone volume) and 2) Challenge - infected with oral mixed infection (P. gingivalis and F. nucleatum), each CC line representative in both groups. The bone loss phenotype in response to infection was calculated by differences between the bone volumes among these two groups for each CC line. The study findings as published inShustermanetal. 2013, reveals highly significant variation (p<0.05) in bone loss phenotype among the CC lines in response to infectious challenge (Fig.6). The CC lines were clustered by sub-groups based on their response to the infection in terms of bone volume, susceptible, resistant and intermediate. 25% of the scanned CC lines were considered “Infectious Susceptible” since they showed bone loss in response to the challenge (IL26 / IL57 / IL72 / IL182 / IL196 and IL711), the rest 75% of the scanned CC lines were either resistant or moderately susceptible with no significant difference in bone volume. Estimated broad sense heritability (H2) was 0.4 for both CBV and RBV, while 0.2 for LBV.
These finding strongly affirms existence of strong genetic background underlying development of periodontitis and confirms the usefulness of the CC lines for QTL mapping for susceptibility to periodontal infection. Therefore, the study was extended to the assessment of ~100 CC lines for periodontitis using this protocol, and recently we mapped QTL associated with host susceptibility to periodontitis (unpublished data).

Fig.6 Collaborative Cross (CC) lines alveolar bone volume changes in response to oral mixed infection. A dark Gary column presents control bone volume (CBV) and a light Gray column presents residual bone volume (RBV). Labeled with asterisk (*) are 6 CC lines of total 23 CC lines (Il26, IL57, IL72, IL182, IL196, and IL711) showing a significant bone loss (P<0.05) and considered to be susceptible to the infection. X-axis represents the CC lines, Y-axis represents the alveolar bone volume mm3 (Shusterman et al. 2013).
1.4Map host susceptibility toPseudomonasaeruginosa.
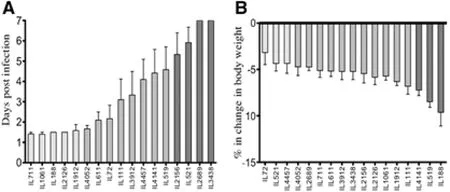
Fig.7 CC lines response to P. aeruginosa airway infection. Fig. 7A shows the mean survival time (MST) in days (±SEM). Fig. 7B show the percentage changes in body weight (CBW1) following the infection. X-axis represents the CC lines, Y-axis represents the mean survival time in days (±SEM) in Fig. “A” and % change in body weight in Fig. “B”.
Pseudomonasaeruginosa(P.aeruginosa) is listed among the WHO (World Health Organization) leading resistant pathogens with greatest public health concern, to be one of major bacterial infections (10-15% of cases) in hospitals and healthcare systems worldwide. Severe infection withP.aeruginosais typical among intensive care unit patients (ICU) with high risk for development of ventilator-associated pneumonia (VAP) and Sepsis (Gellatly and Hancock 2013). Wide variations are observed in host response, mainly individuals at risk and Cystic Fibrosis patients towardsP.aeruginosainfection. So far many efforts were invested in dissectingP.aeruginosagenotypic features that might be underlying the variations in host response leading to differential disease phenomenon’s and pathogenesis (Bianconi et al.2011; Cigana et al. 2009; Bragonzi et al. 2009; Nguyen and Singh 2006). Yet, recent study approaches are focused instead on dissecting the host genetic background that might be playing crucial role controlling the variations in response severity (Weiler and Drumm 2013). To address this approach, various studies in murine models assessed multiple mice strains infected byP.aeruginosaand repeatedly the results confirmed significant variation in infection response between the inbred strains (Bragonzi 2010, De Simone et al. 2014). As step forwards fine mapping of these regions in the genome using the CC mouse population,Lore’etal. 2015 assessed total of 92 mice (50 males, 42 females) generated from 17 CC lines and challenged byP.aeruginosainfection (intratracheal injection), following the infection withP.aeruginosa, host response was determined for 7 days in terms of survival time (days) and body weight (gram) changes. As reported byLore’etal. 2015, the CC lines varied significantly in their survival time (Fig.7A) ranging between lethal response (survival 1.5 days) to complete resistance (100% survival). As well, the CC lines varied in their body weight changes following the challenge, where few CC lines showed significant decrease in body weight and others showed recovery of BW after day 5. Summarizing the mean survival time (MST) and percentage change in body weight of day 1 (CBW1) (Fig.7B). Hereby, using few lines of the CC population we demonstrate the role of strong genetic components controlling the host response despite fixed and strictly controlled environmental conditions. Certainly estimated broad sense heritability calculations shown to be high for both traits of the response post infection, survival time with H2=0.54 and body weight loss with H2=0.28. Due to these promising findings, number of CC lines were extended, and recently we mapped QTL associated with host susceptibility toP.aeruginosainfection (unpublished data).
1.5Map host susceptibility to sepsis (unpublished).
Sepsis is a severe health complication, usually triggered by immune response of the body against infectious disease (Levy et al. 2003). Usually, sepsis is treated with antibiotic therapies together with aggressive operative intervention and supportive treatments for the body systems in intensive care unit (ICU). Despite continues advances in antibiotic therapies and medical support, high morbidity and mortality of sepsis are reported (Friedman et al.1998). Sepsis pathogenesis is studied from multiple directions, one is based on dissecting the microbial factors contributing to the disease and another is host factors contributing to the sepsis development and progress. Focusing on host response, so far studies show that septic response of the host is triggered mainly by microbial toxins, primarily Lipopolysccharide components (LPS) in gram negative bacteria and lipoteichoic acid (LTA) in gram positive bacteria (van der Poll and Opal 2008; Mattsson et al. 1993). Due to variations in sepsis incidence and severity among populations, it is evident that strong genetic factors might be controlling the development of sepsis in response to interaction with microbial toxins during infectious disease. Dissecting the genetic architecture underlying the sepsis development and severity is necessary for prevention and development of personalized implementations to combat sepsis deterioration. Hence, ongoing study in our lab using the CC lines population as different host genetic references and LPS/LTA separately injections as environmental challenge for host exposure to microbial toxins. Hitherto, 296 mice generated from 16 CC lines were given an i.p. injection of LPS (dissolved in PBS), thereafter host response was monitored for 72 hours in terms of survival time (hours), body temperature (oC) and weight (gram) changes. Preliminary data analysis showed (Fig.8A) a significant variation in survival time, where some CC lines exhibited increased LPS susceptibility and died after an average of 30 hours in contrast with the LPS-resistant CC lines that survived the 72 hours challenge. More importantly, two way ANOVA of sex effect cross CC lines revealed a significant sex effect (P<0.05), in which for most of the scanned CC lines, males were more prone to septic shock than females of the same CC line (Fig.8B). At the level of thermal response, main response during the first 30 hours following the LPS injection was characterized by hypothermia for most of the CC lines, afterwards the CC lines varied in their response towards either hyperthermia or hypothermia (Fig.8C). Similar variations were observed in body weight changes after the challenge (Fig.8D).
Our preliminary data analysis confirms the significance of variation in host response to the toxic microbial component LPS in terms of survival time and also parameters of body temperature and weight changes, suggesting the involvement of multiple body systems to be controlled by strong genetic components. Meanwhile, further CC line are being assessed with LPS challenge to enrich the phenotypic data reference and enable fine mapping of the genomic regions responding to LPS. As well, similar experiment is ongoing with LTA stimulation.

Fig.8 CC lines septic response towards the microbial toxic component lipopolysccharide (LPS). Fig. 8A shows CC lines mean (±SEM) survival time (Hr) profile during the 72 hours after the infection. Fig. 8B shows the data split by sex in each CC line due to significant sex effect, X-axis represents the CC lines, Y-axis represents the mean survival time in hours (±SEM), in in Fig. B- white column for females, blue column for males.Fig. 8C and D presents multiple patterns of temperature (C) and body weight (D) changes during the 72 hours post infection. Changes in temperature and body weight were calculated as percentage of initial value. X-axis represents time after LPS injection (Hr), Y-axis represents percentage of the initial body temperature (Fig. C) / weight (Fig. D).
2 CC lines for study of Colorectal cancer
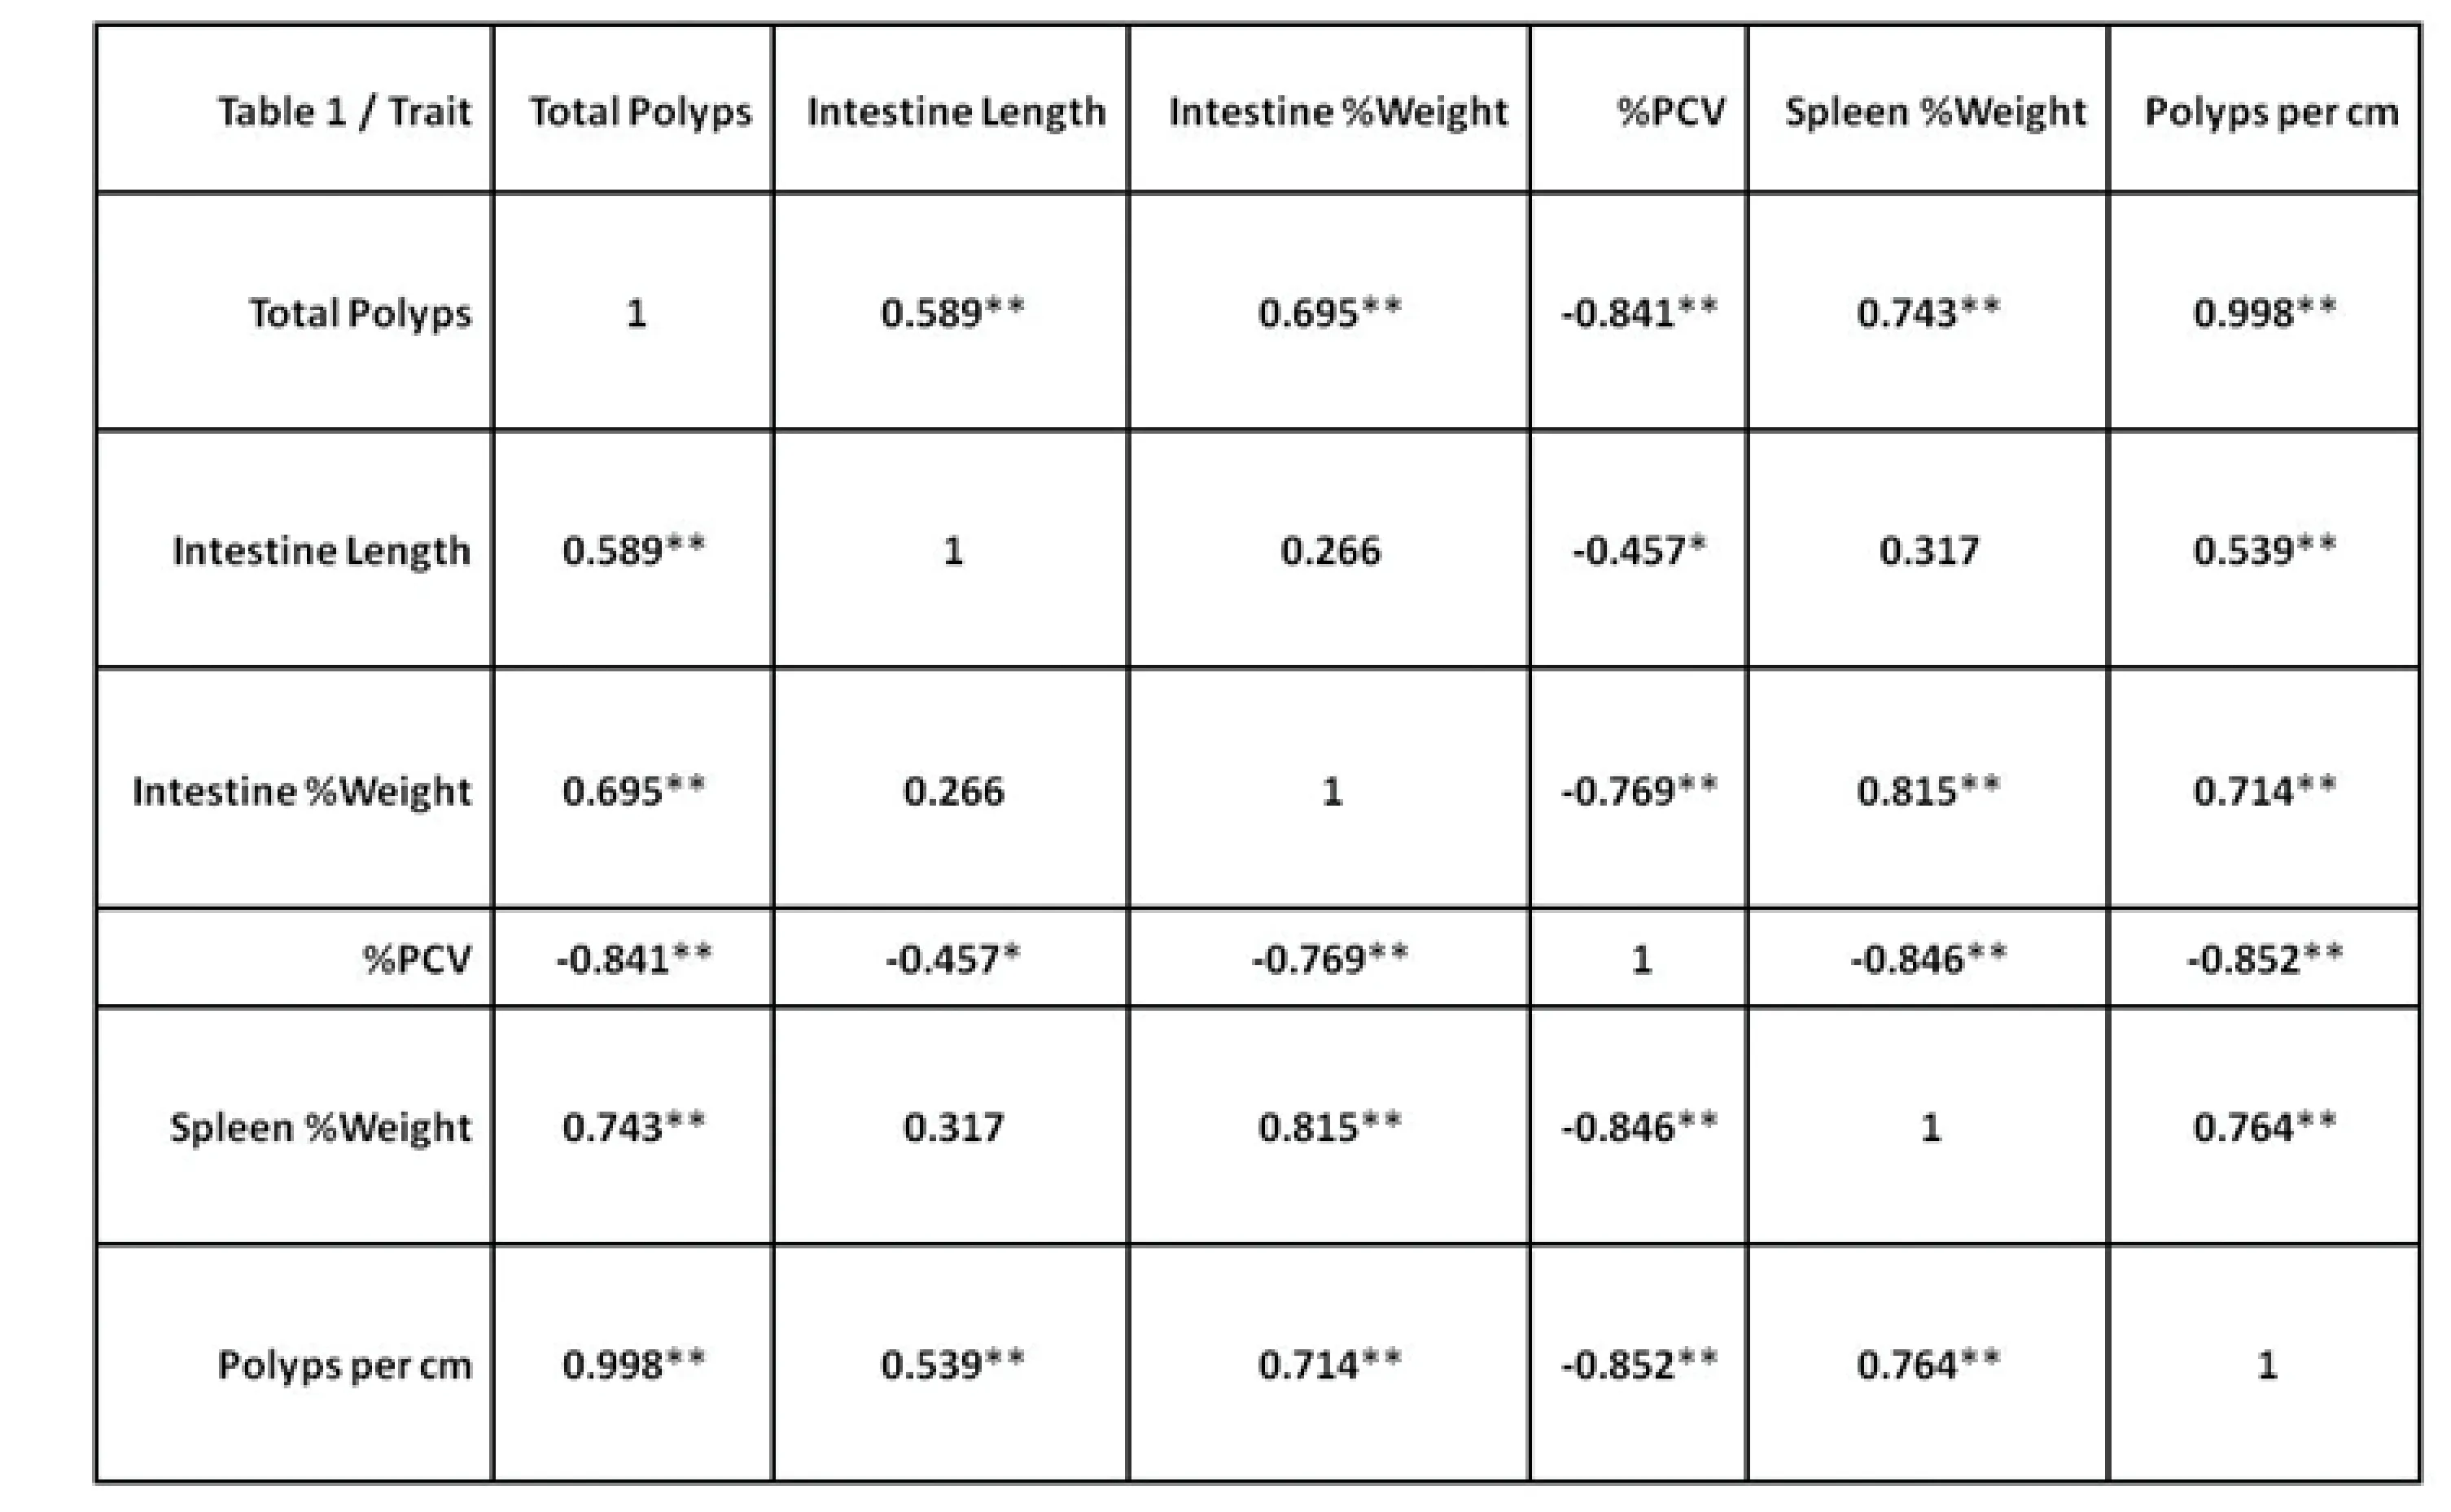
One form of the inherited colorectal cancer isfamilialadenomatouspolyposis(FAP) syndrome, a rare dominant genetic disease, which is characterized by multiple intestinal polyps (Moser et al. 1993, Rubinfeld et al. 1993; Sheng et al. 2010; Silverman et al. 2003; Suraweera et al. 2006). It is caused by a functional mutation in theadenomatouspolyposiscoli(Apc) gene. In order to investigate the syndrome in vivo,ApcMin+/-mouse was developed, imitating the polyp phenomenon in humans (Joslyn et al.1991; Kinzler et al. 1991; Dietrich et al. 1993; Harada et al. 1999; Hirohashi and Kanai 2003). In previous studies, Min+/-mouse was used for identifying the genes (modifiers) affecting the function ofApcgene. Currently, a number of chromosomal regions associated with modifiers ofApcgene were mapped (MOM 1-10), but failed to identify the actual genes in these loci that affect the function ofApcgene, due to the low resolution mapping of these regions (Lawrence et al. 2007; Cormier et al. 2000; Morin et al. 1997; Moser et al. 1992; Oikarineny et al. 2009; Silverman et al. 2002) The CC mice are a powerful tool for high resolution mapping of loci associated with complex traits, and can lead to suggest strong candidate genes underlying these loci. As proof of concept about the use of CC mouse population for mapping modifiers ofApc, we have generated a (CC-C57BL/6linescarryingtheApcMin/+mutation) F1 mouse population, by crossing male mice of C57Bl/6J carryingApcMin+/-with females of advanced inbreeding generations of CC lines. The study cohort consisted of 27 F1 CC-C57BL/6 lines carrying theApcMin/+mutation. The litters from these mating were tested by polymerase chain reaction (PCR) in order to distinguish the litter carryingApcmutant genes from the wild type. F1 heterozygous mouse carriers for the mutatedApcgene were housed and kept for a five-month period on a 12-hour light/dark cycle. During this period, body weight (gram) was monitored bi-weekly. At the terminal time point, mice were sacrificed, packed cell volume was measured (anemia indicator) and spleen and intestine were removed.The spleen weight was measured (inflammation indicator) and Intestines were divided into small intestine and colon for further characterization of length, weight and polyp count. The number and sizes of polyps in the small intestine and colon were recorded after fixation in 10% neutral buffered formalin (NBF) overnight, and stained with methylene blue. Findings of the study were recently published atDormanetal. 2016, revealing a significantly wide variation of all the phenotypic parameters including total number of polyps (Fig.9) among theCC-C57BL/6linescarryingtheApcMin/+mutation, despite the constant environmental conditions for the overall population. Hence, these significant variations are suggested to be attributed by the variation of the CC lines genetic backgrounds. And indeed, a heritability calculation certifies this statement with high H2value of 0.64 for the total number of polyps. Additionally, Durman et al. 2016 assessed secondary effects of the disease, such as body weight changes, anemia and splenomegaly (enlarged spleen). Estimated Pearson correlations (Table 1) reports significant negative correlation between the number of polyps and packed cell volume (r=-0.84,P<0.01), i.e. the more polyps (colon cancer) the lower packed cell volume (anemia), and positive significant correlation between number of polyps and Spleen %weight (r=0.74,P<0.01), i.e. the more polyps (colon cancer) the larger spleen (Splenomegaly). As for body weight changes, it is apparent that although when compared to control CC lines most of theCC-C57BL/6linescarryingtheApcMin/+mutationgain less weight during the five months period, and yet there is a significant variation in patterns of body weight gain between the CC lines. At the time of writing this report, linkage analysis was performed and modifier forApcgenes and their ability to induce colorectal cancer were mapped (unpublished data).

Fig.9 Average number of polyps (±SEM) in the 27 F1 CC-C57BL/6-Min lines (n=1-16 mice/line).X-axis represents CC lines and the C57BL/6 strain which is Apc Min/+ mutation carrier (first black column from the left), Y-axis represents number of polyps. [Dorman et al. 2016]
3 CC lines for Type 2 Diabetes study
The prevalence of type 2 diabetes (T2D), in the past decades, has increased into epidemic proportions, and in year 2000 was 150 million and it is expected to double by the year 2025. Several lines of evidence provide support for the role of genetic variation in the pathogenesis of T2D and insulin resistance. In this context, diabetes can be considered as a complex disease, where the challenge is the Western diet and CC lines as genetic reference. Recent publication of our study byAtamnietal. 2016, introduces the powerful utility of CC lines population for understanding the genetic bases of high fat (42% fat) diet-induced T2D (HFD induced T2D). Study cohort consisted of 683 mice generated from 21 CC lines; mice were divided into two experimental groups: 1) Control - maintained on Chow standard rodents’ diet and 2) Challenge group - maintained on HFD, each CC line was representative in both groups. The dietary challenge started at age of 8 weeks old lasting for 12 weeks, in which body weight (gram) and size (length, waist circumference) were assessed bi-weekly. At the terminal time point, an intraperitoneal glucose tolerance test (IPGTT) was performed to evaluate the diabetogenic status of the mice in response to the dietary challenge, compared between CC lines within each group (genetic effect) and also between groups (diet effect). Published findings atAtamnietal. 2016 presents an extensive variations of all the measured phenotypes between the CC lines, importantly body diabetogenic and weight response to HFD challenge significantly influenced by the host genetic background with strong sex effect in each CC line, indicating that males and females from the same CC line experience the disease differently. CC lines showed multiple patterns for glucose clearance (Fig.10), in which different outcomes are observed including resistibility, susceptibility and moderate intermediate response. Some CC lines were highly susceptible towards consumption of HFD showing impaired glucose tolerance when compared to mice from control group of the same CC line. Similar finding at the level of body weight changes, showing multiple patters, some towards continues gain, some towards moderate gain and some even showed high body weight resistance keeping their body weight balanced despite HFD consumption (Fig.10).

Fig.10 Kinetics of glucose clearance for 17 CC lines (split by sex) as assessed during the 180 minutes intraperitoneal glucose tolerance test (IPGTT) after 12 weeks on Chow diet (CH, 18 % fat) and on high fat diet (HFD, 42 % fat). The dark central line shows average glucose levels (mg/dL) across lines. Chart A, Males-Chow; B, Males-HFD; C, Females-Chow; D, females-HFD.[Atamni et al. 2016]
The bottom line of this comprehensive study is that “one size does not fit all” in context of diets, genetic background of host plays critical role in body response towards HFD or standard diet. Therefore, discovering the candidate genes involved in susceptibility or resistibility will bring us closer towards personalized diets for prevention and treatment of obesity and T2D development.
Quantitative trait loci (QTL) that determine susceptibility to HFD challenge, as expressed in body weight and total area under curve of overall intraperitoneal glucose tolerance test (IPGTT) phenotypes were identified recently to be published soon. Furthermore, precise QTL mapping for individual time points during the IPGTT and body weight accumulation was performed and QTL mapped (unpublished data).
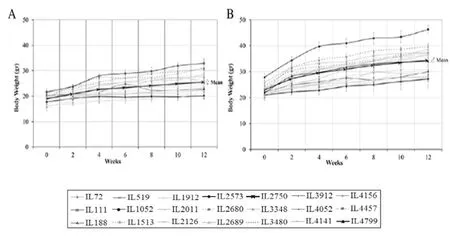
Fig.11 Kinetics of body weight (g) means (±SEM) of females (A) and males (B) of 21 CC lines during 12 weeks on high fat dietary challenge (HFD, 42 % fat).[ Atamni et al. 2016]
4 CC lines for fundamental Body traits
4.1Dissecting genetic background of body composition (unpublished)
In this study, we aim to determine the genetic factors underlying the body composition using the CC population and the power of the DEXA scan technique. The following phenotypes were recorded by the DEXA scan; 1) bone tissue features; bone area (cm2), bone mineral content (BMC), bone mineral density (BMD), 2) Soft tissues; fat (gram), lean (gram), percentage fat (%fat). Using the phenotypic data and genotypic data of the CC lines will enable genome-wide scan analysis for identifying quantitative trait loci associated with these traits. Additionally,body length (BL=distance in cm between nose and anus), waist circumference, body weight (BW), the body mass index (BMI=BW/BL2) were measured for each mouse, which will also be used as a phenotype for determining the variation between the different CC lines. On average 4-10 individuals of 18 to 20-week old mice of both sexes from each randomly used 15 CC lines, which were maintained on standard rodent diet, were analysed. Figure 12.A to D show the profiles of the different tested traits of different CC lines using DEXA scan. The statistical analysis of the phenotypic results have shown significant (P<0.05) variations between the different CC lines. Sex effect was also observed with the different tested traits.

Fig.12 Phenotypic profiles of the body composition complex traits assessed by DEXA scan of different CC lines. X-axis represent the CC lines, Y-axis represent phenotypic trait value; “A” represents body tissue weight in gram, “B” represents percentage Fat (%), “C” represents bone mineral content in gram, “D” represents bone mineral density in gram/cm2.
4.2Genetic background of Immune response (unpublished)

Fig.13 Percentage of T, B and macrophage immune cells in 15 naïve CC mouse lines. The X-axis represents the CC lines, Y-axis represents the percentage, including standard errors of the three tested immune cells in CC lines at age of 8-9 week old mice. The percentage of T, B and macrophage immune cells in peripheral blood was assessed by FACS analysis.
Mapping quantitative trait loci (QTLs) effecting the immune response cells lineages in the peripheral blood and subsequently identifying the genes underlying these QTL can lead to better understanding of the host response to these different infectious diseases. For this purpose, we initiated a study aimed of mapping the genes, which control the production of various subsets of cells that are participating in the host defense. Here, we present the immune profiles data on 15 CC mouse lines by quantification of the amount of peripheral blood T, B, and macrophages cells of mature mice (3-5 mice per line of 10 weeks old). The immunophenotyping was performed using flow cytometry analysis using fluorescence activated cell staining (FACS) technology. Blood samples were collected from the orbital venous plexus of mice. Blood samples from individual mice were incubated with specific antibodies including anti CD3e (T cells), anti CD19 (B cells), and anti CD11b (macrophages). (Fig.13). Our study revealed marked differences in the relative proportions of different cells in the different CC mouse lines. The relative proportions varied between 13.5-43% for B lymphocytes and between 6.5-36% for T lymphocytes. As for macrophages their proportion value range was 10.6-39% in the different CC lines. Our results are compatible with the results, which already published for different commercially available inbred mouse strains. Thus, these results form the basis for extending the study of more CC lines, and recently using phenotypic data from 63 lines, we were able to map QTL associated with the immune profile cells (unpublished data).
4.3Map QTL for trabecular bone microarchitecture

Fig.14 QTL haplotype mapping of trabecular bone traits using the CC lines. On the left side; phenotypic profile of the trabecular bone features BV/TV, Tb.N, Tb.Th and Conn.D. X-axis represents CC lines and Y-axis represents the phenotypic trait value. On the right side; QTL mapping results revealing 6 significant QTLs using the phenotypic and genotypic data of the CC lines at HAPPY software. [Levy et al.2015]
Microarchitecture of trabecular bone structure is considered as complex trait controlled by multiple genetic factors. Therefore, microstructure of trabecular bone is known to differ among populations resulting in phenotypic variations towards development of osteoporosis and bone fractures (mechanic strength). Trabecular bone microstructure variations can lead to fracture risk variations between individual despite their similar bone mineral density (BMD), indicating that additional bone features, such as trabecular bone microstructure determines the bone strength (Chappard et al. 2011). In attempts to characterize the genetic background underlying these features, Levy et al. 2015, scanned the femoral distal metaphysic of 160 mice generated from 31 CC lines for trabecular traits measured by microtomographic (CT) analysis. The measured trabecular traits comprised of trabecular bone volume fraction (BV/TV), number (Tb.N), thickness (Tb.Th), and connectivity density (Conn.D). And indeed, using relatively small number of CC lines, Levy et al. 2015 succeeded in mapping six quantitative trait loci, where 4 loci on chromosomes 2 and 7 for BV/TV and Tb.Th (2 loci for each trait), two additional loci on chromosomes 8 and 14 for Tb.N and Conn.D, respectively (Fig.14) (1% false discovery rate). Genome browse of the mapped QTLs suggest newly genes with relevance to skeletal biology to be further validated. Heritability values of these traits confirmed their high genetic component ranging from 0.6 to 0.7. In this study,Levyetal. 2015 demonstrates for the first time significant genetic linkage between multiple genetic loci and trabecular microstructural features, suggesting new candidate genes to be further validated for their contribution in microstructure trabecular bone traits.
Conclusions
The Collaborative Cross (CC) is a next-generation mouse genetic reference population designed by the mouse genetics community for high resolution mapping of genetic factors of relevance to human health, such as susceptibility to infectious and chronic diseases, and response to medical interventions. However, it is a very flexible resource with very wide potential application to complex traits of interest for human medicine and livestock agriculture.
The CC will eventually consist of a set of about 350 recombinant inbred lines are currently available for study. These lines were generated by reciprocal crosses between 8 founder lines, including among them 5 relatively unrelated classical laboratory strains, and 3 lines derived from recent wild accessions (twoMussubspecies, and oneMusdomesticus). The CC resource contains extremely wide genetic diversity relative to existing mouse genetic resources, and has already demonstrated unprecedented power for high resolution QTL mapping. Genotypes and all generated phenotypes will be stored centrally and made publicly available making the CC a “Genotype once, phenotype once” resource. Phenotypic distribution of CC lines is also consistent with the presence of very large variation among them in quantitative traits as well.
The estimated heritability (H2) effects of the different assessed phenotypic traits recorded on CC mice (Tab.2), have confirmed that the genetic factors are the major player underlying this phenotypic variations.The published and unpublished results highlighted the usefulness of this mouse GRPs to identify complex genetic traits, which may lead to
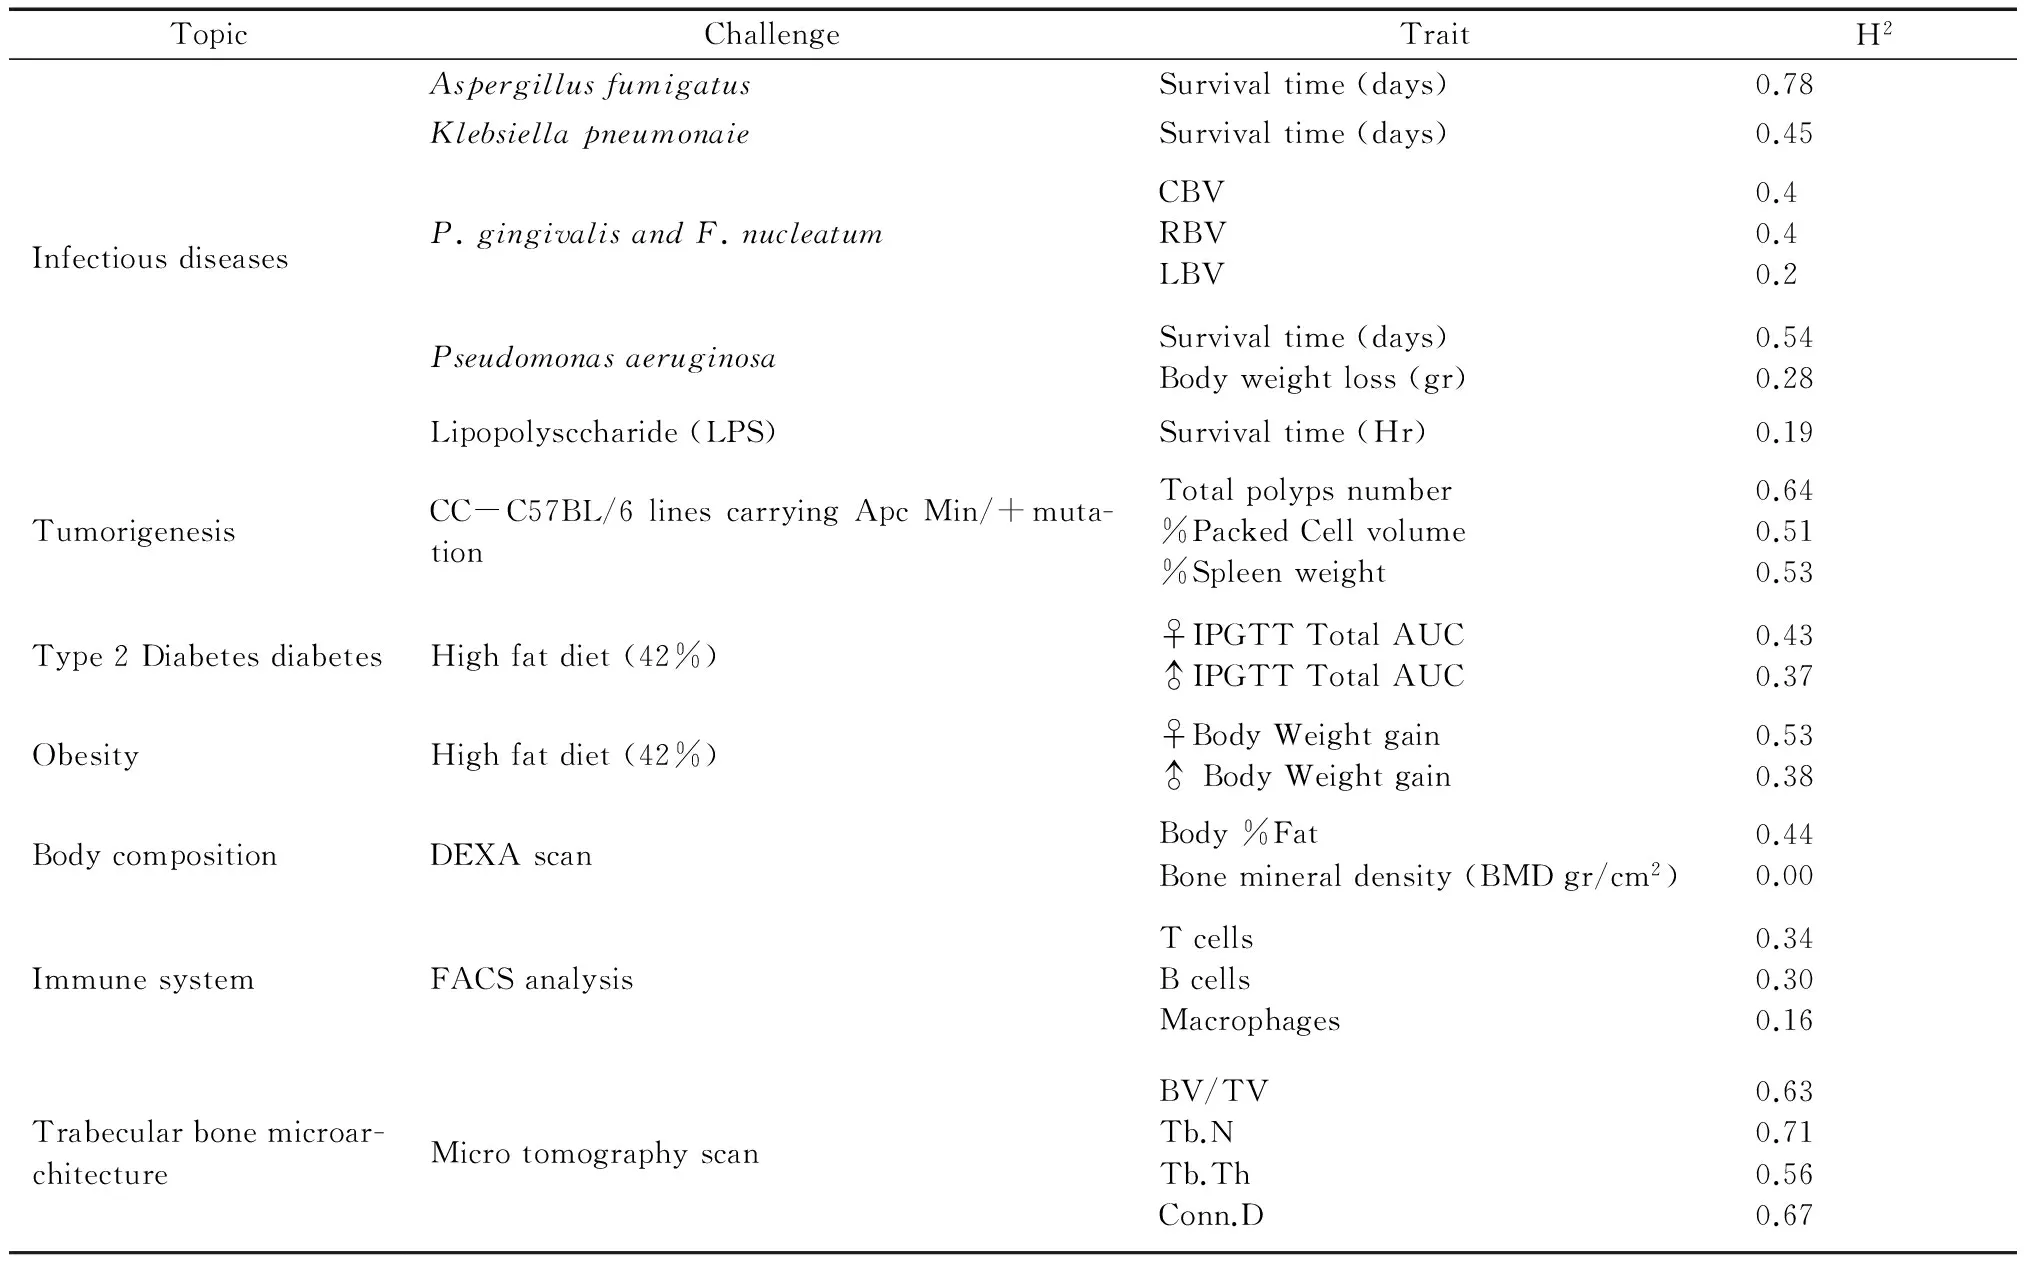
Tab.2 Estimated heritability of variety of phenotypic traits assessed in the CC mice
IPGTT=intraperitoneal glucose tolerance test; AUC=area under curve.
Trabecular bone volume fraction (BV/TV), number (Tb.N), thickness (Tb.Th), and connectivity density (Conn.D)
translation to human diseases. A number of previous studies have shown the knowledge gained in the mouse experimental systems can be applied to humans. This research will continue to make major discoveries in biomedical research and, thus, contribute to a better understanding and treatment of human and livestock diseases.
[1]Atamni HJ, Mott R, Soller M,etal. High-fat-diet induced development of increased fasting glucose levels and impaired response to intraperitoneal glucose challenge in the collaborative cross mouse genetic reference population [J]. BMC Genet,2016, 17:10.
[2]Aylor DL, Valdar W, Foulds-Mathes W,etal. Genetic analysis of complex traits in the emerging Collaborative Cross[J]. Genome Res,2011, 21: 1213-1222.
[3]Baker PJ,Roopenian DC. Genetic susceptibility to chronic periodontal disease [J]. Microbes Infect,2002, 4: 1157-1167.
[4]Baker PJ, Dixon M, Roopenian DC. Genetic control of susceptibility toPorphyromonasgingivalis-inducedalveolar bone loss in mice [J]. Infection Immunity,2000, 68: 5864-5868.
[5]Bianconi I, Milani A, Cigana C,etal.Positive signature-tagged mutagenesis inPseudomonasAeruginosa: Tracking patho-adaptive mutations promoting airways chronic infection [J]. PLoS Pathogens,2011, 7 (2): e1001270.
[6]Bottomly D, Ferris MT, Aicher LD,etal. Expression quantitative trait Loci for extreme host response to influenza A in pre-collaborative cross mice [J]. G3(Bethesda),2012, 2(2): 213-221.
[7]Bragonzi A, Paroni M, Nonis A,etal.Pseudomonasaeruginosamicroevolution during cystic fibrosis lung infection establishes clones with adapted virulence [J]. Am J Respir Crit Care Med,2009, 180(2): 138-145.
[8]Bragonzi A. Murine models of acute and chronic lung infection with cystic fibrosis pathogens [J]. Int J Med Microbiol, 2010, 300(8): 584-593.
[9]Broman KW. The genomes of recombinant inbred lines [J]. Genetics 2005, 169(2): 1133-1146.
[10]Chappard D, Baslé MF, Legrand E,etal. New laboratory tools in the assessment of bone quality [J]. Osteoporos Int,2011, 22(8): 2225-2240.
[11]Churchill G, Airey D, Allayee H,etal. The Collaborative Cross, a community resource for the genetic analysis of complex traits [J]. Nature Genetics,2004, 36: 1133-1137.
[12]Cigana C, Curcurù L, Leone MR,etal.Pseudomonasaeruginosaexploits lipid A and muropeptides modification as a strategy to lower innate immunity during cystic fibrosis lung infection [J]. PLoS One, 2009, 4(12): e8439.
[13]Cormier RT, Bilger AJ, Lillich RB,etal. The Mom1AKR intestinal tumor resistance region consists of Pla2g2a and a locus distal to D4Mit64 [J]. Oncogene,2000, 19: 3182-3192.
[14]De Simone M, Spagnuolo L, Lorè NI,etal. Host Genetic background influences the response to the opportunisticPseudomonasaeruginosainfection altering cell-mediated immunity and bacterial replication [J]. PLoS One, 2014, 9(9): e106873.
[15]Dietrich WF, Lander ES, Smith JS,etal. Genetic identification of Mom-1, a major modifier locus affecting Min-induced intestinal neoplasia in the mouse [J]. Cell 1993, 75: 631-639.
[16]Dorman A, Baer D, Tomlinson I,etal. Genetic analysis of intestinal polyp development in Collaborative Cross mice carrying the Apc (Min/+) mutation [J]. BMC Genet. 2016, 19; 17:46.
[17]Durrant C, Tayem H, Yalcin B,etal. Collaborative Cross mice and their power to map host susceptibility to Aspergillus fumigatus infection [J]. Genome Res,2011, 21:1239-1248.
[18]Ferris MT, Aylor DL, Bottomly D,etal.Modeling host genetic regulation of influenza pathogenesis in the collaborative cross [J]. PLoS Pathog,2013, 9(2): e1003196.
[19]Friedman G, Silva E, Vincent JL. Has the mortality of septic shock changed with time [J]. Crit Care Med, 1998, 26 (12): 2078-86.
[20]Gelinas R, Chesler EJ, Vasconcelos D,etal. A genetic approach to the prediction of drug side effects: bleomycin induces concordant phenotypes in mice of the collaborative cross [J]. Pharmgenomics Pers Med,2011, 4: 35-45.
[21]Gellatly SL, Hancock RE.Pseudomonasaeruginosa: new insights into pathogenesis and host defences [J]. Pathog Dis,2013, 67(3):159-173.
[22]Gralinski LE, Ferris MT, Aylor DL,etal. Genome wide identification of SARS-CoV susceptibility loci using the Collaborative Cross [J]. PLoS Genet,2015, 11(10): e1005504.
[23]Harada N, Tamai Y, Ishikawa T,etal. Intestinal polyposis in mice with a dominant stable mutation of the beta-catenin gene [J]. EMBO J,1999, 18: 5931-5942.
[24]Hirohashi S,Kanai Y. Cell adhesion system and human cancer morphogenesis [J]. Cancer Sci, 2003, 94: 575-581.
[25]Iraqi F. Fine mapping of quantitative trait loci using advanced intercross lines of mice and positional cloning of the corresponding genes [J]. J Exp Lung Res, 2000a, 26: 641-649.
[26]Iraqi F, Clapcot S, Kuman P,etal. Fine mapping of trypanosomiasis resistance QTLs in mice using advanced intercross lines [J]. Mammalian Genome,2000b,11: 645-648.
[27]Iraqi FA, Mahajne M, Salaymah A,etal. The genome architecture of the Collaborative Cross mouse genetic reference population [J]. Genetics 2011, 190 (2): 389-402.
[28]Joslyn G, Carlson M, Thliveris A,etal. Identification of deletion mutations and three new genes at the familial polyposis [J]. Cell 1991, 66: 601-613.
[29]Keane TM, Goodstadt L, Danecek P,etal. Mouse genomic variation and its effect on phenotypes and gene regulation [J]. Nature 2011, 14 (477): 289-294.
[30]Kelada SN, Aylor DL, Peck BC,etal. Genetic analysis of hematological parameters in incipient lines of the collaborative cross [J]. G3(Bethesda), 2012, 2(2):157-165.
[31]Kinzler KW, Nilbert MC, Su LK,etal. Identification of FAP locus genes from chromosome 5q21 [J]. Science,1991, 253: 661-665.
[32]Klopocki E, Hennig BP, Dathe K,etal. Deletion and point mutations of PTHLH cause brachydactyly type E [J]. Am J Hum Genet. 2010, 86(3):434-439.
[33]Kovacs A, Ben-Jacob N, Tayem H,etal. Genotype is a stronger determinant than sex of the mouse gut microbiota [J]. Microb Ecol,2011, 61(2):423-428.
[34]Latgé JP.Aspergillusfumigatusand aspergillosis [J]. Clin Microbiol Rev,1999, 12(2): 310-350.
[35]Lawrence KN, Shedlovsky A, Biehl BS,etal. Identification of Mom7, a novel modifier of APCmin/+ on mouse chromosome 18 [J]. Genetics 2007, 176: 1237-1244.
[36]Levy MM, Fink MP, Marshall JC,etal. 2001 CCM/ESICM/ACCP/ATS/SIS International Sepsis Definitions Conference [J]. Crit Care Med,2003, 31 (4): 1250-1256.
[37]Levy R, Mott RF, Iraqi FA,etal. Collaborative cross mice in a genetic association study reveal new candidate genes for bone microarchitecture [J]. BMC Genomics 2015, 16(1): 1013.
[38]Lorè NI, Iraqi FA, Bragonzi A. Host genetic diversity influences the severity ofPseudomonasaeruginosapneumonia in the Collaborative Cross mice [J]. BMC Genet,2015, 16: 106.
[39]Mattsson E, Verhage L, Rollof J,etal.Peptidoglycan and teichoic acid fromStaphylococcusEpidermidisstimulate human monocytes to release tumour necrosis factor-alpha, interleukin-1 beta and interleukin-6 [J]. FEMS Immunol Med Microbiol, 1993, 7(3): 281-287.
[40]Mathes WF, Aylor DL, Miller DR,etal. Architecture of energy balance traits in emerging lines of the Collaborative Cross [J]. Am J Physiol Endocrinol Metab,2011, 300(6): E1124-1134.
[41]Morin PJ, Sparks AB, Korinek V,etal. Activation of β-catenin-Tcf signaling in colon cancer by mutations in β-catenin or APC [J]. Science,1997, 275: 1787-1790.
[42]Moser AR, Dove WF, Roth KA,etal. The Min (multiple intestinal neoplasia) mutation: its effect on gut epithelial cell differentiation and interaction with a modifier system [J]. J Cell Biol, 1992, 716: 1517-1526.
[43]Moser AR, Mattes EM, Dove WF,etal. ApcMin, a mutation in the murine Apc gene, predisposes to mammary carcinomas and focal alveolar hyperplasias [J]. Proc Natl Acad Sci U S A,1993, 90: 8977-8981.
[44]Mott R, Talbot CJ, Turri MG,etal. A method for fine mapping quantitative trait loci in outbred animal stocks [J]. Proc Natl Acad Sci U S A, 2000, 23(7): 12649-12654.
[45]Nguyen D, Singh PK. Evolving stealth: Genetic adaptation ofPseudomonasaeruginosaduring cystic fibrosis infections [J]. Proc Natl Acad Sci U S A,2006, 103 (22): 8305-8306.
[46]Oikarineny SI, Cleveland AG, Cork KM,etal. Genetic mapping of Mom5, a novel modifier of ApcMin-induced intestinal tumorigenesis [J]. Carcinogenesis,2009, 30: 1591-1596.
[47]Philip VM, Sokoloff G, Ackert-Bicknell CL,etal. Genetic analysis in the Collaborative Cross breeding population [J]. Genome Res,2011, 21: 1223-38.
[48]Phillippi J, Xie Y, Miller DR, Bell TA, Zhang Z.etal. Using the emerging Collaborative Cross to probe the immune system. Genes Immun,2014,15(1):38-46.
[49]Polak D, Wilensky A, Shapira L,etal. Mouse model of experimental periodontitis induced byPorphyromonasgingivalis/Fusobacteriumnucleatuminfection: bone loss and host response [J]. J Clin Periodontol,2009, 36(5): 406-410.
[50]Ram R, Mehta M, Balmer L,etal. Rapid identification of major-effect genes using the collaborative cross [J]. Genetics,2014, 198(1): 75-86.
[51]Rankinen T, Zuberi A, Chagnon YC,etal. The human obesity gene map: the 2005 update [J]. Obesity (Silver Spring),2006, 14(4):529-644.
[52]Roberts A, Villena FP, Wang W,etal. The polymorphism architecture of mouse genetic resources elucidated using genome-wide resequencing data [J]. Mammalian Genome,2007, 18(6): 473-481.
[53]Rogala AR, Morgan AP, Christensen AM,etal. The Collaborative Cross as a resource for modeling human disease: CC011/Unc, a new mouse model for spontaneous colitis [J]. Mamm Genome. 2014, 25(3-4): 95-108.
[54]Rubinfeld B, Souza B,Albert I. Association of the APC gene product with betacatenin [J]. Science,1993, 262: 1731-1734.
[55]Sheng JQ, Cui WJ, Fu L,etal. APC gene mutation in Chinese familial adenomatous polyposis patients [J]. World J Gastroenterol, 2010, 16: 1522-1526.
[56]Shusterman A, Salymah Y, Nashef A,etal. Genotype is an important determinant factor of host susceptibility to periodontitis in the Collaborative Cross and inbred mouse populations [J]. BMC Genetics,2013, 14: 68-79.
[57]Silverman KA, Koratkar RA, Siracusa LD.etal. Identification of the modifier of Min 2 (Mom2) locus, a new mutation that influences Apc-induced intestinal neoplasia [J]. Genome Res, 2002, 12: 88-97.
[58]Silverman KA, Koratkar RA, Siracusa LD,etal. Exclusion of Madh2, Madh4, and Madh7 as candidates for the modifier of Min 2 (Mom2) locus [J]. Mamm. Genome Res, 2003, 14: 119-129.
[59]Soubani AO, Chandrasekar PH. The clinical spectrum of pulmonary aspergillosis. Chest,2002, 121(6):1988-1999.
[60]Suraweera N, Haines J, McCart A,etal. Genetic determinants modulate susceptibility to pregnancy-associated tumourigenesis in a recombinant line of Min mice [J]. Human Mol Genetics,2006, 15: 3429-3435.
[61]Thaisz J, Tsaih SW, Feng M,etal. Genetic analysis of albuminuria in collaborative cross and multiple mouse intercross populations [J]. Am J Physiol Renal Physiol,2012, 303(7): F972-981.
[62]Threadgill DW, Hunt KW, Williams RW. Genetic dissection of complex and quantitative traits: from fantasy to reality via a community effort [J]. Mamm Genome 2002, 16:344-355.
[63]Valdar W, Flint J, Mott R. Simulating the collaborative cross: power of quantitative trait loci detection and mapping resolution in large sets of recombinant inbred strains of mice [J]. Genetics, 2006, 172(3):1783-1797.
[64]Van der Poll T, Opal SM. Host-pathogen interactions in sepsis [J]. Lancet Infect Dis, 2008, 8(1): 32-43.
[65]Vered K, Durrant C, Mott R,etal. Susceptibility toKlebsiellapneumonaieinfection in collaborative cross mice is a complex trait controlled by at least three loci acting at different time points [J]. BMC Genomics,2014, 15: 865.
[66]Weiler CA, Drumm ML. Genetic influences on cystic fibrosis lung disease severity [J]. Front Pharmacol, 2013, 4: 40.
[67]Wicker LS, Clark J, Fraser HI,etal. Type 1 diabetes genes and pathways shared by humans and NOD mice [J]. J Autoimmun,2005, 25(Suppl): 29-33.
[68]Wilensky A, Gabet Y, Yumoto H,etal. Three-dimensional quantification of alveolar bone loss inPorphyromonasgingivalis-infectedmice using micro-computed tomography [J]. J Periodontol,2005, 76(8): 1282-1286.
[69]Williams RC. Periodontal disease [J]. N Engl J Med,1990, 322(6): 373-382.
[70]Wilson M. Biological activities of lipopolysaccharides from oral bacteria and their relevance to the pathogenesis of chronic periodontitis [J]. Sci Prog,1995, 78 (Pt 1): 19-34.
[71]Xiong H, Morrison J, Ferris MT,etal. Genomic profiling of collaborative cross founder mice infected with respiratory viruses reveals novel transcripts and infection-related strain-specific gene and isoform expression [J]. G3(Bethesda),2014, 4(8):1429-1444.
[72]Yalcin B, Flint J, Mott R. Using progenitor strain information to identify quantitative trait nucleotides in outbred mice [J]. Genetics,2005, 171: 673-681.
[73]Yang H, Ding Y, Hutchins LN,etal. A customized and versatile high-density genotyping array for the mouse [J]. Nature Methods,2009, 6(9):663-666.
[74]Zombeck JA, Deyoung EK, Brzezinska WJ,etal. Selective breeding for increased home cage physical activity in collaborative cross and Hsd:ICR mice [J]. Behav Genet,2011, 41(4): 571-582.
R-33【文献标识码】 A
1671-7856(2016) 08-0001-19
10.3969.j.issn.1671-7856.2016.08.001
2016-07-05
