Revisiting the Second EOFMode of Interannual Variation in Summer Rainfallover East China
2016-08-12ZhongdaLINQinSUandRiyuLU
Zhongda LIN,Qin SU,and Riyu LU
1State Key Laboratory ofNumericalModeling for Atmospheric Sciencesand Geophysical Fluid Dynamics, Institute ofAtmospheric Physics,Chinese Academy ofSciences,Beijing 100029
2DepartmentofAtmospheric Sciences,Yunnan University,Kunming 650091
Revisiting the Second EOFMode of Interannual Variation in Summer Rainfallover East China
Zhongda LIN∗1,Qin SU2,and Riyu LU1
1State Key Laboratory ofNumericalModeling for Atmospheric Sciencesand Geophysical Fluid Dynamics, Institute ofAtmospheric Physics,Chinese Academy ofSciences,Beijing 100029
2DepartmentofAtmospheric Sciences,Yunnan University,Kunming 650091
The second EOF(EOF2)mode of interannual variation in summer rainfall over East China is characterized by inverse rainfall changesbetween South China(SC)and the Yellow River–Huaihe Rivervalleys(YH).However,understanding of the EOF2mode is still lim ited.In this study,the authors identify that the EOF2mode physically depicts the latitudinalvariation of the climatologicalsummer-mean rainy beltalong the Yangtze Rivervalley(YRRB),based on a160-station rainfalldataset in China for the period 1951–2011.The latitudinal variation of the YRRB ismostly attributed to two different rainfall patterns:one reflects the seesaw(SS)rainfall changes between the YH and SC(SS pattern),and the other features rainfall anomalies concentrated in SC only(SC pattern).Corresponding to a southward shift of the YRRB,the SS pattern,w ith above-normal rainfall in SC and below-normal rainfall in the YH,is related to a cyclonic anomaly centered over the SC–East China Sea region,w ith a northerly anomaly blow ing from the YH to SC;while the SC pattern,w ith above-normal rainfall in SC,is related to an anticyclonic anomaly over thewestern North Pacific(WNP),corresponding to an enhanced southwest monsoon over SC.The cyclonic anomaly,related to the SS pattern,is induced by a near-barotropic eastward propagating wave train along the Asian upper-tropospheric westerly jet,originating from themid–high latitudes of the North Atlantic. The anticyclonic anomaly,for the SC pattern,is related to suppressed rainfall in theWNP.
YangtzeRiver rainy belt,EastChinasummer rainfall,seesaw pattern,South Chinapattern,western North Pacific subtropicalhigh,extratropicalwave train
1. Introduction
Summer rainfall in East China exhibits a strong year-toyear variability due to its typicalmonsoon climate,which leads to frequent flood and drought.Understanding the yearto-year variations of summer rainfall,therefore,is essential andmany works have been devoted to this topic(Lau etal., 2000;Wang etal.,2001;Huang etal.,2003;Lu,2004;Ding and Chan,2005;Shen etal.,2011;Su etal.,2014).
EOFanalysis is themostcommon approach to investigate variations in summer rainfall in EastChina.Mostsuch studieshave been summarized in the recentworks of Ye and Lu (2012)and Huang etal.(2012).Their resultsshowed that the fi rstEOF(EOF1)mode of summer rainfall featuresameridional tripole pattern in EastChina,w ith increased rainfall located in themiddle–lower reaches of the Yangtze River valley and decreased rainfall to the both north and south(He and Li,1992;Zhu and Chen,1992;Shen and Lau,1995; Zou and Ni,1998;Weng etal.,1999;You etal.,2003;Zhou and Yu,2005;Chen et al.,2006;Huang et al.,2006,2007, 2012;Ye and Lu,2012).This EOF1mode isassociated w ith the“Pacific–Japan(PJ)”teleconnection proposed by Nitta (1987)or the“EastAsia–Pacific(EAP)”teleconnection,proposed by Huang and Sun(1992),and a Rossby wave train over the m idlatitudes of continental Eurasia(Huang et al., 2007).
The second EOF(EOF2)mode is characterized by rainfall anomalies w ith opposite sign in South China(SC)and the Yellow River–Huaihe River valleys(YH)(Zhu and Chen, 1992;Shen and Lau,1995;Weng et al.,1999;You et al., 2003;Zhou and Yu,2005;Chen et al.,2006;Huang etal., 2007,2012;Ye and Lu,2012).The corresponding principal component(PC2)shows a decadal shiftaround the early 1990s,consistentw ith significantly enhanced rainfall in SC after1992(Wu etal.,2010).
Some previous studies investigated circulation anomalies associated w ith the EOF2 mode(e.g.,Zhou and Yu,2005; Han and Zhang,2009).The negative phase of the EOF2 mode,w ith increased rainfall in the YH and decreased rain-fallin SC,isrelated toanorthwestwardextensionof thewestern North Pacific subtropical high(WNPSH)and an eastward shift of the upper jet stream(Zhou and Yu,2005). On the contrary,the positive phase of the EOF2 mode is associated w ith a southwestward extension of the WNPSH (Han and Zhang,2009).Consequently,thesubtropicalsouthwestmoisture transportin thewestof theWNPSH converges w ithm idlatitudemoisture transport over the YH in the negative phase(Zhou and Yu,2005)and over SC in the positive phase(Han and Zhang,2009).Indeed,these studies concentrated on the decadal change of the EOF2mode around the early 1990s;sim ilarcirculation anomaliesassociatedw ith the decadalchangeofsummer rainfall in SC after1992 havealso been identified(Wu etal.,2010).
In addition to the significant decadal change around the early 1990s,the EOFmodew ith opposite rainfall changebetween the YH and SC hasalso been identified from interannualvariationsof summer rainfall in EastChina(Yeand Lu, 2012).Ye and Lu(2012)revealed that thismode accounts for 10.9%of the total variance of interannual variations of summer rainfall in EastChina during 1955–2002 and,as the EOF2mode,isdistinguishable from the EOF1mode.Unfortunately,their results did notshow any associated circulation change,so the physicalprocesses involved are stillnotclear.
The objective of the present study is to investigate the EOF2 mode of summer rainfall in East China on interannualtimescalesand to discuss thepossibleunderlyingmechanisms.The text isorganized as follows:Section 2 introduces the data used in the study.In section 3,the fi rst two dominantmodesof interannualsummer rainfall in EastChina are obtained based on EOF analysis.In section 4,based on the variation of summer rainfall in the YH and SC,the authors identify twomain patterns in the EOF2mode:one featuresa seesaw(SS)rainfall changebetween the YH and SC,and the other w ith rainfall anomalies concentrated in SC only.The possiblemechanisms responsible for the SS and SC pattern are investigated in section 5.Finally,conclusionsand discussion are provided in section 6.
2. Data
In this study,the 160-station observed monthly rainfall data inmainland China during 1951–2011,provided by the National Climate Center of the China Meteorological Adm inistration,are used to obtain the fi rst two EOF leading modes in East China.A lso used are global precipitation data derived by theGlobal Precipitation Climatology Project (GPCP)(Huffman et al.,1997;Adler et al.,2003)during 1979–2010,and precipitablewater for the entire atmosphere from the National Centers for Environmental Prediction–National Center for Atmospheric Research(NCEP–NCAR) reanalysis data(Kalnay etal.,1996)during 1951–2011.The resolution is 2.5°×2.5°for both the GPCP data and the NCEP–NCAR reanalysis data.In addition,monthly NationalOceanic and Atmospheric Adm inistration ERSST(extended reconstructed sea surface temperature)data(Smith et al.,2008)are also used.
The monthly atmospheric data are from the NCEP–NCAR reanalysisdatasets(Kalnay etal.,1996)during 1951–2011,w ith a horizontal resolution of 2.5°×2.5°at17 pressure levels.A lso used are the6-h specific hum idity,zonaland meridionalw ind at theeightpressure levels from 1000 hPa to 300 hPa,and surface pressure data from the NCEP–NCAR reanalysisdatasets(Kalnay etal.,1996)for the period 1951–2011.The6-h dataareapplied to calculatemoisture transport and its divergence.Sim ilar to Chen and Huang(2007),the columnmoisture flux QQQ is integrated vertically from 300 hPa to the surface,

and itsdivergence D iscalculated as

where q is specific hum idity,p is pressure,and VVV is the horizontalw ind vector including zonal(u)and meridional(v) w ind components.The constant g is gravitational acceleration and thevariable Psisatmospheric pressureatthesurface. The variables QQQ and D are fi rst calculated at 6-h temporal resolution,and then their seasonalmeansare derived.When D>0,moisture flux diverges,acting as a sink ofmoisture; when D<0,itconverges,acting asa source ofmoisture and favors rainfall.
In this study,summer is defined as June–July–August (JJA).To obtain interannualanomalies,a9-yrGuassian fi lter is employed to remove long-term trends and decadal variationsof summer rainfalland circulation anomalies.
3. The EOF2 mode of interannual summer rainfall in East China
Figure 1a shows the climatology of summer-mean rainfall in East China east of 105°E and south of 45°N,which includes 108 stations as depicted by black dots.There are twomain rainy beltsw ith summer-mean rainfallexceeding 5 mm d−1:the rainy belt along the Yangtze River(YRRB), and along the southeast coast of China.A long these two belts,summer rainfall also exhibits strong interannual variation,w ith themaximum of standard deviation being larger than 2mm d−1during 1951–2011(Fig.1b).
We perform the EOF analysis on interannual summer rainfall in East China and present the fi rst two EOFmodes in Figs.1c and d.The spatial pattern of rainfall anomalies of the EOF1mode features increased rainfall in the Yangtze Rivervalley and decreased rainfallover the southeastcoastof China(Fig.1c).Itphysically depictsa rainfalloscillation between the YRRB and the rainy beltalong the southeastcoast of China.Thismode explains 17%of the total variance.A sim ilarspatialpatternwasalso obtained in the EOF1modeof the interannual componentof summer rainfall in East China during 1955–2002 by Ye and Lu(2012).Note that the rainfallanomalies in North China areweak and positive,whichare different from those revealed by Huang etal.(2012)using total rainfalldata.This difference is probably due to the effect of opposite decadal variations of summer rainfall between North China and the Yangtze River valley around the late1970s(Huang etal.,1999;Huang etal.,2012).

Fig.1.(a)Climatology and(b)interannualstandard deviation ofsummer rainfall for1951–2011 in East China.The fi lled circlesdepict108 stationseastof 105°E and south of 45°N.The(c)fi rstand(d)second EOFmodes of interannual summer rainfall in EastChina.(e)The normalized PCs corresponding to the fi rst(line)and second(bars)modes.Spatial patterns in(c,d)are shown as regressed anomalies against the corresponding normalized PCs.Shading indicates rainfallexceeding 5 and 2mm d−1in(a) and(b),respectively,and depicts significant rainfall anomalies at the 95%confidence level in(c,d). The contour interval is1,0.5,0.3 and 0.3mm d−1in(a–d),respectively.The two regions depicted by the rectangles in(d)are the YH(north region),which includes25 stations(open circles),and SC(south region),which includes30 stations(fi lled circles).
The EOF2 mode features inverse rainfall changes between South China(SC)and the Yellow River–Huaihe River valleys(YH)(Fig.1d).Thismode accounts for 12%of the total interannual variance of summer rainfall in East China, which is distinguishable from the EOF1 mode(17%)and from the third EOFmode(8%)in terms of the criterion of North et al.(1982).Moreover,themaximum of interannual variance of summer rainfallexplained by the EOF2mode is more than 50%in SC(Fig.2a),and thatof total variance is more than 40%(Fig.2b).As for the YH summer rainfall, thismodeexplains themaximum ofmore than 30%of its interannual variance(Fig.2a)and 20%of total variance(Fig. 2b).The area-averaged explicable fractions of interannual variance are larger than 20%and 10%in SC and the YH,respectively,and those of total variance larger than 17%and 8%.
To reveal the physicalmeaning of the EOF2 mode,19 positive-phase cases,corresponding to the associated principal component(PC2)being larger than 0.5,and 20 negativephase cases,w ith the corresponding PC2 being smaller than−0.5,are chosen(Table 1).Based on the 39 cases,interannual rainfall anomalies(Figs.3a and d)and total rainfall (Figs.3b and e)in summerare then composited.Rainfall increasesin SCand decreasesin theYH in thepositivephaseof the EOF2mode(Fig.3a).Accordingly,the YRRB is located to the south of the Yangtze River(Fig.3b).In the negative phase,rainfall decreases in SC and increases in the YH(Fig. 3d),and the YRRBmovesnorthward to north of the Yangtze River(Fig.3e).Meanwhile,the rainy beltalong thesoutheast of China remains in both the positive(Fig.3b)and negative (Fig.3e)phases.The result indicates that the EOF2 mode depicts ameridional shiftof the summer YRRB.Figures 3c and f show total summer rainfall(shading)and their interannualanomalies(contours)in two cases of the positive and negative phasesof the EOF2mode,respectively.The YRRB shifted southward in 1999 in the positive phase(Fig.3c)and northward in 2003 in the negative phase(Fig.3f),consistent w ith the composite results.It is also noted that the interannual rainfall anomalies in the YH are weaker than those in SC in the composite results(Figs.3aand d),which is due to theeffectofmore thanone third of casesw ith rainfallanomalies being concentratedmainly in SC only,in addition to the casesw ith inverse rainfallvariation between the YH and SC, related to the EOF2mode,identified in thenextsection.
To further reveal the relationship between themeridional shiftof the YRRB and rainfall variations in the YH and SC, two regions(32°–38°N,107°–120°E)and(22°–30°N,107°–120°E),as depicted by the two boxes in Fig.1d,are chosen to represent the YH and SC regions,respectively.The YH box includes25 stationsand the SC box includes30 stations.

Table 1.Years w ith a strong EOF2 mode of interannual summer rainfall in East China.The yearsw ith the PC2 value being larger (smaller)than 0.5(−0.5)are chosen for the positive(negative) phase.
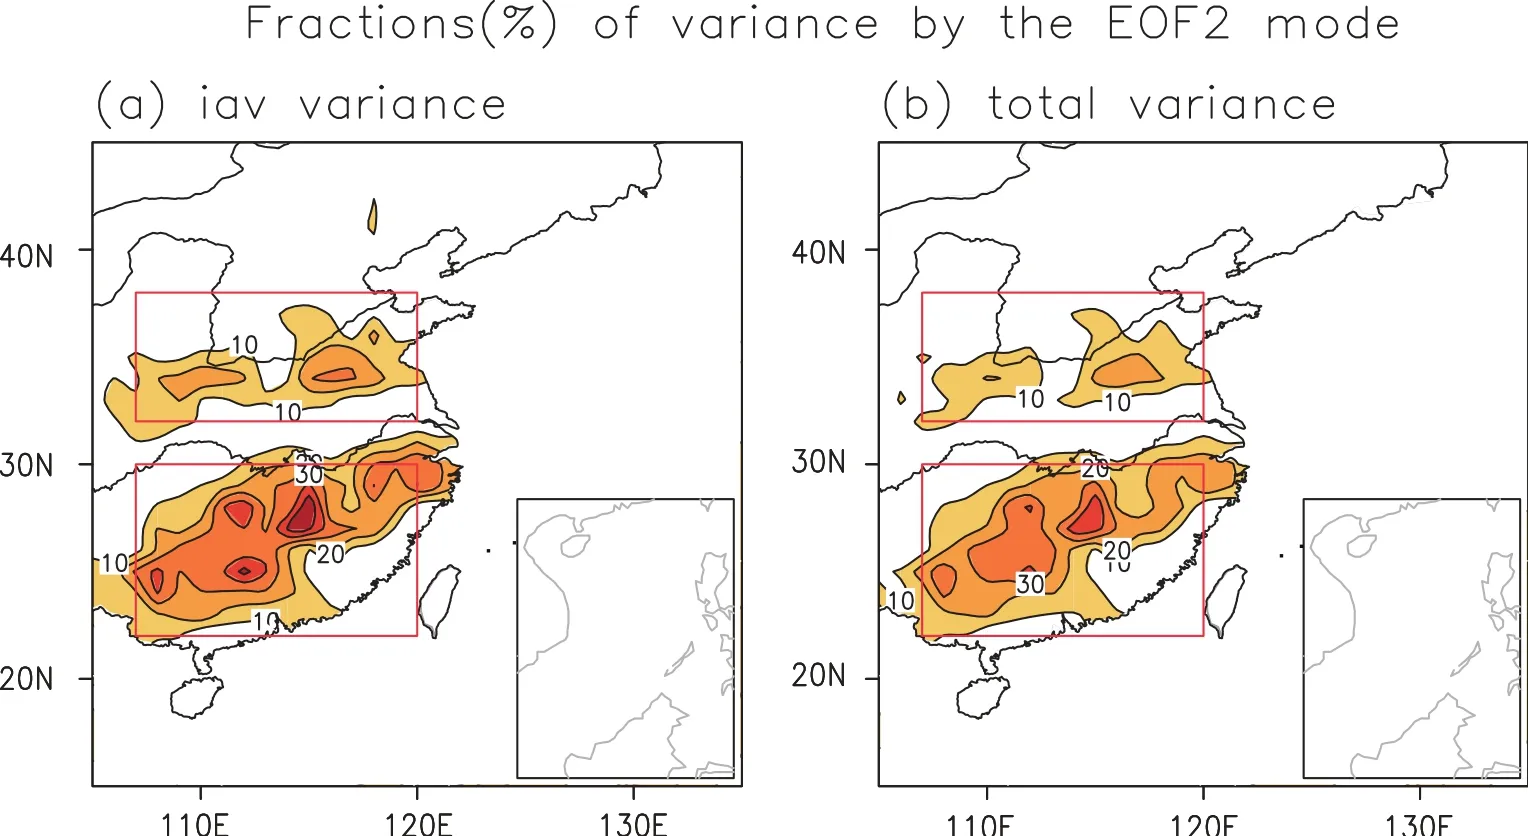
Fig.2.Fractions(%)of(a)interannualand(b)totalvariance of summer rainfallexplained by the EOF2mode.

Fig.3.Composite resultsof(a,d)interannualsummer rainfallanomaliesand(b,e)total rainfall in East China,and(c,f)case results of total summer rainfall(shading)and interannual anomalies(contours), in the(a–c)positive and(d–f)negative phasesof the EOF2mode.Shading indicates statistical significance at the 95%confidence level in(a,d)and depicts rainfallexceeding 5mm d−1in(b,c,e,f)(scale barat the bottom).The contour interval is0.5mm d−1in(a,d)and 1mm d−1in(b,c,e,f).

Fig.4.Normalized time seriesof the rainfall indicesof SC(SCRI)and the YH (YHRI).The SCRIis defined as interannual summer rainfall anomalies of the 30-stationmean in SC and the YHRIof the25-stationmean in the YH,asshown in Fig.1d.
Accordingly,the YH rainfall index(YHRI)is defined as the 25-stationmean rainfalland the SC rainfall index(SCRI)as the30-stationmean rainfall.Figure4 shows timeseriesof the two rainfall indices.The correlation coefficients of the PC2 w ith the SCRIand YHRIare 0.93 and−0.57,respectively, both significantat the 99%confidence level.In addition,the YHRI is also significantly correlated with the SCRI,w ith a correlation coefficient of−0.41,suggesting the interannual variation of the SC summer rainfall is,at least partially,related to that of the YH summer rainfall.A southward shift of the YRRB is related to asignificant rainfall increase in SC and decrease in the YH.
4. Identification of the SSand SC patterns related to the EOF2m ode
The EOF2mode,as identified in the lastsection,which depicts ameridional shift of the YRRB,is associated with the rainfallvariations in both the YH and SC.In thissection, the EOF2-mode cases are further classified into nine differentgroupsbased on the combined distribution of thenormalized SCRIand YHRI(Fig.5).A red dot depicts a strong, positive EOF2-mode year,w ith the PC2 value being larger than 0.5,and a blue dot represents a strong,negative EOF2-mode year,w ith the PC2 valuebeing less than−0.5.The 39 strong EOF2-mode years are locatedmainly in four phases: Phase 1,w ith strong,positive rainfall anomalies in SC and strong,negative rainfallanomalies in the YH;Phase4,which is the inverseof Phase1;Phase 2,w ith strong,positive rainfallanomaliesin SCand normal rainfallin theYH;and Phase 3,which isopposite to Phase2.
The phase distribution of the strong EOF2-mode years is summarized indetailin Table2.Therearesixand seven years in Phases1 and 4,and eightyearsinboth Phases2 and 3.The summed number of years in these four phases is 29,which accounts for approximately three quarters of the total 39 strong EOF2-mode years.Note that the differencesbetween Phases1and 2and between Phases3and 4arewhetherornot rainfall anomalies in the YH are strong.The Student’s t-test is used to obtain the statistical significance for the follow ing composite results.

Fig.5.Phasedistribution of thestrong EOF2-modeyearsbased on the normalized YHRI and SCRI.A positive(negative) EOF2-modeyearw ith the PC2 valuebeing larger(smaller)than 0.5(−0.5),is depicted by red(blue)dots.
Figure6 shows thecomposite interannual rainfallanomalies in the four phases.Phase 1 features an SS-like pattern, w ith increased rainfallin SC and decreased rainfallin the YH (Fig.6a).The amountsof rainfallanomalies in these two regionsarenearly equivalent.An opposite pattern is identified in Phase 4,w ith reduced rainfall in SC and enhanced rainfall in the YH(Fig.6b).Composite differences of rainfall anomalies between these two phases show significant,positive anomalies in SC and significant,negative anomalies in the YH(Fig.6c),resembling the EOF2mode(Fig.1d).To distinguish from the EOF2 mode,this pattern is,hereafter, referred to as the SS pattern.Phases 1 and 4 then depict the positiveand negative phasesof the SSpattern,respectively.

Fig.6.Composite interannual summer rainfallanomalies in East China based on(a,b,d,e)four categories of the EOF2-mode cases in Table 2 and(c,f)their difference.The spatial pattern of rainfall anomalies is referred to as the(a–c)SSpattern and(d–f)SC pattern.Phases1 and 4(2 and 3)represent the positive and negative phases of the SS(SC)pattern,respectively.Shading represents statistically significantanomaliesat the95%confidence level in(c,f),and the contour interval is0.5mm d−1in(a, b,d,e)and 1mm d−1in(c,f).

Table 2.Phase distribution of the strong EOF2-mode years based on the YHRIand SCRI.The yearsunderlined are in the negative phase of the EOF2modeand theother yearsare in the positive phase.
In Phase2 rainfall isalso increased in SC(Fig.6d),similar to that in Phase 1(Fig.6a).However,there are no strong rainfallanomalies in the YH in Phase2,in contrastw ith those in Phase1.In Phase3 rainfall is reduced in SC(Fig.6e),opposite to thatin Phase2(Fig.6d).Theirdifferenceshowssignificant,positive rainfall anomalies concentrated in SC and no significantanomalies in the YH(Fig.6f).This pattern is named the SC pattern,in which Phases2 and 3 represent its positiveand negativephases,respectively.
In the above analysis the EOF2-mode cases are then mainly classified into two patterns:the SS pattern and the SC pattern.The SS pattern reflects the fact that interannual variationsof rainfall in SC are closely related to those in the YH,while the SC pattern represents rainfall varying locally over SC.The two cases in 1999 and 2003,as shown in Figs. 3c and f,distributed in Phases1 and 4(Table2)respectively, are the SS-pattern casesw ith relatively equivalentamountsof interannual rainfallanomalies in both the YH and SC.On the otherhand,the combination of the SS-and SC-pattern cases, leadsto stronger interannual rainfallanomaliesin SC than the YH in the composite results,asshown in Figs.3aand d.
But do both the SS and SC patterns lead to ameridional shiftof the YRRB,thesameas thatin the composite resultsin Fig.3?Figure7 shows the latitudinalvariation of the YRRB averaged between 107°E and 120°E for the SS and SC patterns,separately.The mean location of the YRRB moves from 29°N in the positive phase of the SS pattern to 33°N in the negative phase(Fig.7a),and in the SC pattern from 29°N to 31°N(Fig.7b).The SSand SC patternsboth induce ameridional shift of the YRRB,though the YRRB moves more northward in the negative phase of the SS pattern,due to thecontributionofboth thedecreased rainfallin SCand increased rainfall in theYH,compared to theSC pattern related to decreased rainfall in SC only.
5. Underlyingmechanisms
5.1. Local anomalies associated with the SSand SC patterns

Fig.7.Latitudinal variation of total summer rainfall(units: mm d−1)averaged zonally between 107°E and 120°E foreach case(dotted line)and theirmean(solid line)of the(a)SS and (b)SC pattern.Red lines represent the positive phase and blue lines the negative phase.The vertical solid lines indicate the latitude of themaximum of compositemean total rainfall,the location of the summer rainy belt in EastChina,in the positive (red)and negative(blue)phases.

Fig.8.As in Fig.6 but for the composite results of theWNPSH(contours)and interannualhorizontalw ind anomalies at850 hPa(vectors).TheWNPSH is depicted by geopotential height(units:gpm)at850 hPa,w ith the contours of 1470,1490 and 1510.Statistically significantw ind anomaliesat the 95%confidence levelare plottedw ith bold vectors in(c,f).The units forw ind are given in the top-right corner of(c).The effectof the topography ismasked by grey shading.
To reveal the circulation anomalies responsible,Fig.8 shows the composite resultsof horizontalw ind anomaliesat 850 hPa in summer associated w ith the SS and SC patterns, separately.Clearly,the SS pattern,w ith increased rainfall in SC and decreased rainfall in the YH in the positive phase (Phase1),issignificantly associatedw ith a cyclonic anomaly over SC and the neighboring East China Sea(Fig.8a).In contrast,an anticyclonic anomaly is identified in the negative phase(Phase 4,Fig.8b).Their difference shows a significant cyclonic anomaly over the SC–East China Sea region(Fig.8c).Thecyclone-induced northerly anomaly blows from the YH to SC,whichweakens the climatologicalsouthwestsummermonsoon in EastAsia.Subsequently,theweakenedmonsoon airflow suppresses northwardmoisture transport.The latter divergesover the YH and convergesover SC (Fig.9a).Rainfall decreases in the YH and increases in SC, concurrentw ith ascendingmotion anomaliesoverSC and descendingmotion anomaliesover the YH(Fig.9b).
For the SC pattern,the increased rainfall in SC is related to an anticyclonicanomaly over thenorthern South ChinaSea (SCS)and the Philippine Sea in the positive phase(Phase 2, Fig.8d),and the decreased rainfall in SC is associated w ith a cyclonic anomaly in the negative phase(Phase 3,Fig.8e). Theirdifference ischaracterized by a significantanticyclonic anomaly(Fig.8f),corresponding to the westward extension of thewestern North Pacific subtropicalhigh(WNPSH).Due to the southerly anomaly in the west of the anticyclonic anomaly,moremoisture is transported to SC(Fig.9c),togetherw ith ascendingmotion anomalies(Fig.9d),enhancing rainfallover SC.
In summary,in the positive phase,the SS-pattern rainfall anomalies are induced by the cyclonic anomaly in the lower troposphere over the SC–East China Sea region,and the SC-pattern rainfall anomalies are caused by the anticyclonicanomaly over thenorthern SCSand thePhilippineSea. The physical processes responsible for the formation of the two cyclonic and anticyclonic anomalies in the lower troposphereare discussed in the follow ing subsections5.2 and 5.3, respectively.
5.2. Extratropical impacton the SSpattern
The lower-tropospheric cyclonic anomaly over the SC–East China Sea region,in the positive phase of the SS pattern,is connected with an extratropicalwave train originating from them id–high latitudes of the North Atlantic in the upper troposphere(Fig.10a).To reveal the characteristics of the associated Rossby wave propagation,the zonal and meridional components of a wave-activity flux for stationary Rossby waves(WWW)are employed,follow ing Takaya and Nakamura(2001),which isdefined as

where|V|is the magnitude of the horizontal vector w ind (u,v)andψis thestream function.Variableswith an overbar represent their climatological summermean averaged during1951–2011,and variablesw ith subscriptand primenotations signify theirpartialderivativesand anomaliesassociatedw ith the SSpattern.
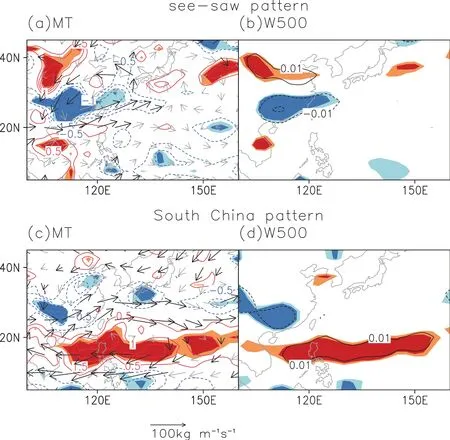
Fig.9.As in Figs.6c and fbut for the composite resultsof interannualanomaliesof column(a,c)moisture transport(vectors),which is vertically integrated from 300 hPa to the surface,and its divergence (contours)and(b,d)vertical pressure velocity at500 hPa.Statistically significantmoisture transport anomaliesat the 95%confidence levelare plottedw ith bold vectors in(a,c),and theunitsaregiven at the bottom of(c).Dark and light shading indicates statistically significant anomalies at the 95%and 90%confidence levels,respectively.The contour interval is 0.5mm d−1in(a,c)and 0.01 Pa s−1in (b,d).
The wave-activity flux at 200 hPa,related to the wave train,originates in them id–high latitudes of the North Atlantic,extends eastward into northern Europe,and then divertsover central Asia atapproximately 60°E southeastward into the Asian westerly jet(Fig.10b).Subsequently,it continues to propagate eastward into East Asia along the Asian westerly jet,causing a negative geopotential height at 200 hPa over East Asia.A similar spatial distribution of geopotentialheightat850 hPa(H850)is also revealed(Fig.10c), suggesting abarotropic natureof theextratropicalwave train. The cyclonic anomaly over the SC–EastChina Sea region in the lower troposphere is formed as thebarotropic response to thenegativeupper-troposphericgeopotentialheightoverEast Asia.
The external forcing related to the SS pattern is also exam ined.The composite sea surface temperature(SST) anomalies show no significant signal in the tropical oceans and the North Atlantic in the concurrentsummer(figure not shown).
5.3. Effectof theWNP heating on the SC pattern
Theanticyclonic anomaly,responsible forenhanced rainfall over SC in the SC pattern,is associated w ith a rainfall decreaseover thenorthern SCSand the Philippine Sea,based on the composite GPCP precipitation difference of the three cases in the positive phase,and three cases in the negative phaseof the SC pattern since1979(Table2).Thedecrease in rainfallover the SCSand the Philippine Sea isalso supported by the composite results using the NCEP–NCAR reanalysis precipitable water data during 1951–2011(Fig.11b).The rainfall reduction–related descent(Fig.11c)causes an anticyclonic anomaly over the northern SCS and the Philippine Sea,through divergencenear the surfacew ith friction.Mean-while,the reduced rainfall–relatedWNPheatingsinkmay excite a Rossby wave response in thewest(Gill,1980),further enhancing the anticyclonic anomaly(Lu,2001;Lu and Lin, 2009).

Fig.10.As in Fig.6c but for the composite results of(a)interannualanomalies of geopotentialheight and(b)associated Takaya and Nakamura flux(vectors)at200 hPa,and(c)geopotentialheightat850 hPa.Dark and lightshading indicatesstatistically significantanomaliesat the95%and 90%confidence levels in(a,c).Shading in(b)depicts the location of the climatologicalwesterly jetat200 hPa.The contour interval is 6 gpm in(a,b)and 2 gpm in(c).The effectof the topography ismasked by grey shading in(c).
The SST related to the SC pattern warms in the Bay of Bengal,the SCS,and the Philippine Sea(Fig.11d).The reduced rainfall over the warm SST anomalies suggests that the SST anomalies are a response against the anticyclonic anomaly related to the SC pattern.Theanticyclonic anomaly may increase incom ing shortwave radiation into the underlying oceans because of cloud cover reduction related to the suppressed rainfall.Itmay also suppress the Asianmonsoon westerly in the south,reducing surfaceevaporation such that the SSTwarms.

Fig.11.As in Fig.6f but for the composite results of interannual summer anomalies of(a)horizontal w indsat850hPa(vectors)and GPCPprecipitation(contours),(b)NCEP–NCAR reanalysisprecipitable water for the entire atmosphere,(c)vertical pressure velocity at500 hPa,and(d)SST.Dark and light shading indicatesstatistically significantanomaliesat the95%and 90%confidence levels,respectively. The contour interval is 1mm d−1in(a),0.5 kgm−2in(b),0.01 Pa s−1in(c),and 0.1°C in(d).The effectof the topography ismasked by grey shading in(a).
It is also noted that the WNP sinking-induced Rossby wave furtherpropagatesnortheastward(Fig.11a),resembling the PJpattern(Nitta,1987)or the EAP pattern(Huang and Sun,1992).Some previous studies have revealed that the EOF1mode is also affected by the EAP pattern triggered by theWNP heating(e.g.Huang et al.,2007).To distinguish their difference,Fig.12 shows the regionsw ith significant positive H850 anomalies related to the SC pattern and the EOF1mode,separately.The significantH850 anomalies related to the SC pattern cover the SCS and Philippine Sea, while theanomalies related to the EOF1mode expand northward,further covering the SC region.The differentH850 responses to theWNPheating arepossibly due to thechange in the basic state,sincemonsoon rainfallpeaks in June over SC and in June–July over the Yangtze River valley.This requires further investigation in future work.The northward expansion of the H850 anomaliescauses thenorthward shiftof the associated southwesterly anomaly and moisture transport in thewest from SC to the Yangtze River valley.Consequently, rainfall increasesin SCassociatedw ith theSC pattern,and in the Yangtze Rivervalley associatedw ith the EOF1mode.
6. Conclusion and discussion

Fig.12.The regionsw ith statistically significant geopotential height at 850 hPa at the 95%confidence level related to the EOF1mode(surrounded by the red contour)and the SC pattern (blue contour).The effectof the topography ismasked by grey shading.
In this study,the authors reveal the EOF2mode of interannual summer rainfallanomalies depictsameridional shift of the YRRB.Moreover,themeridionalshiftof the YRRB is mostly due to two differenttypesof rainfallanomaly patterns: one that reflects an SS pattern of rainfallanomalies between the YH and SC,and the otherw ith themain rainfallanomalies concentrated in SC.The fi rstpattern is referred to as the SSpattern and the latter iscalled the SC pattern.Thereare13SS-pattern yearsand 16 SC-pattern years,which account for three quarters of the total 39 strong EOF2-mode years during 1951–2011.Corresponding to a southward shift of the YRRB,rainfall increases in SC and decreases in the YH in the SSpattern,and it increases in SC only in the SC pattern.
The SS and SC patterns are related to different circulation anomalies.The SS pattern is associated w ith a lowertropospheric cyclonic anomaly over SC and the East China Sea,w ith thenortherly anomaly blow ing from the YH to SC, weakening the climatologicalmonsoon southwesterly.The weakenedmonsoon suppressesnorthwardmoisture transport and subsequent rainfall in the north,i.e.,over the YH,and enhances rainfall in the south over SC.The SC pattern is, however,mainly related to an anticyclonic anomaly over the northern SCSand the Philippine Sea,suggesting awestward extension of theWNPSH.Theenhanced southwesterly in the west transportsmoremoisture to SC and favors rainfall.
Moreover,two differentmechanisms responsible for the formation of the cyclonic anomaly related to the SS pattern and the anticyclonic anomaly related to the SC patterns are proposed.The SSpattern results from an extratropicalwave train originated from themid–high latitudesof the North Atlantic.Thewave train extendseastward into northern Europe, diverts over central Asia,atapproximately 60°E,southeastward into the Asian westerly jet,and then propagates eastward to finally reach East Asia and cause a near-barotropic cyclonic anomaly over SC and the East China Sea.For the SC pattern,the anticyclonic anomaly over the northern SCS and the Philippine Sea is related to the suppressed rainfall in theWNP.
The presentstudy carefully exam ines the EOF2mode of interannual summer rainfall in East China and reveals two different rainfall patterns in the EOF2 mode,w ith nearly equivalent numbers of cases(13 SS-pattern cases and 16 SC-pattern cases).The SS pattern reflects a dipole-like pattern w ith opposite rainfall variation in the YH and SC, and the SC pattern represents amonopole-like pattern w ith rainfall anomalies concentrated in SC.The existence of the monopole-like SC pattern associated w ith the EOF2 mode may challenge the traditional view of the“dipole”mode of summer rainfall in East China(Zhu and Chen,1992;Shen and Lau,1995;You etal.,2003;Zhou and Yu,2005;Chen et al.,2006).Instead,in this study,we propose that the EOF2modemay better depict the latitudinalvariation of the summer-mean YRRB.
We identify twomain rainfallpatternsassociatedw ith the EOF2mode:the SSand SC patterns.It is interesting to note that there is no YH pattern,in which rainfall anomalies are concentrated in the YH only.In the 39 strong EOF2-mode years,there are only five yearsw ith strong rainfall anomalies in the YH and normal rainfall in SC(Table 2),far fewer than the 13 SS-pattern years and 16 SC-pattern years.The absence of the YH pattern is likely due to themuch smaller interannual variance of summer rainfall in the YH than SC explained by the EOF2mode(Fig.2).
The structure of the composite rainfall anomalies in the positive(Fig.6d)and negative(Fig.6e)phasesof the SC pattern slightly deviate from their composite difference in Fig. 6f,though they are basically opposite.The deficient rainfall in SC in the negative phase deviates southeastward and the sufficient rainfall in the positive phase deviates northwestward.The nonlinearity indicated by the different deviation from the range is probably due to the different zonal extension of the WNPSH(Fig.8f).Under the control of thewestward-extended WNPSH,anomalousmoisture transportby the southwesterly anomaly in the west shifts northwestward in the positive phase(figurenotshown),while that transported by the northeasterly anomaly shifts southeastward under the eastward-retreated WNPSH in the negative phase(figurenotshown).Accordingly,the rainfallanomalies movenorthwestward in thepositive phaseand southeastward in the negative phase.
Han and Zhang(2009)investigated anomalies related to the EOF2modeof summer rainfall in EastChina.They proposed that themode,w ith increasing rainfall to the south of theYangtzeRiveroverSC and decreasing rainfall to thenorth over the YH,is induced by a southwestward extension of the WNPSH.In thisstudy,we show that thewestward extension of theWNPSH only contributes to the increased rainfall in SC.Theopposite change in summer rainfallbetween the YH and SC(the SS pattern),w ith above-normal rainfall in SC and below-normal rainfall in the YH,is related to a cyclonic anomaly over SC and the adjacentEastChina Sea,which is probably affected by the extratropicalwave train originated from them id–high latitudesof the North Atlantic.
Acknow ledgements.The authors appreciate the editor’s and the two reviewers’comments and suggestions,which led to an improved manuscript.This research was supported by the National Natural Science Foundation of China(Grant Nos.41375086 and 41320104007).
REFERENCES
Adler,R.F.,and Coauthors,2003:The version-2 globalprecipitation climatology project(GPCP)monthly precipitation analysis(1979–present).J.Hydrometeor.,4,1147–1167.
Chen,J.L.,and R.H.Huang,2007:The comparison of climatological characteristicsamong Asian and Australianmonsoon subsystems.Part II:Water vapor transportby summermonsoon.Chinese J.Atmos.Sci.,31,766–778.(in Chinese)
Chen,W.,L.H.Kang,and D.Wang,2006:The coupling relationship between summer rainfall in China and globalsea surface temperature.Climatic and EnvironmentalResearch,11,259–269.(in Chinese)
Ding,Y.H.,and J.C.L.Chan,2005:The East Asian summer monsoon:An overview.Meteor.Atmos.Phys.,89,117–142.
Gill,A.E.,1980:Some simple solutions forheat-induced tropical circulation.Quart.J.Roy.Meteor.Soc.,106,447–462.
Han,J.P.,and R.H.Zhang,2009:The dipolemodeof the summer rainfallover EastChina during 1958–2001.Adv.Atmos.Sci., 26,727–735,doi:10.1007/s00376-009-9014-6.
He,M.,and X.Li,1992:The relationship between summer rainfall in China and tropical circulation anomaly.Quarterly Journal ofApplied Meteorology,3,181–189.(in Chinese)
Huang,R.H.,and F.Y.Sun,1992:Impactsof the tropicalwestern Pacific on the East Asian summermonsoon.J.Meteor.Soc. Japan,70,243–256.
Huang,R.H.,Y.H.Xu,and L.T.Zhou,1999:The inter-decadal variation of summer precipitations in China and the drought trend in North China.Plateau Meteorology,18,465–476.(in Chinese)
Huang,R.H.,L.T.Zhou,and W.Chen,2003:The progresses of recent studies on the variabilities of the East Asianmonsoon and their causes.Adv.Atmos.Sci.,20,55—–69,doi: 10.1007/BF03342050.
Huang,R.H.,J.L.Chen,G.Huang,and Q.L.Zhang,2006: The quasi-biennialoscillation of summermonsoon rainfall in Chinaand its cause.Chinese J.Atmos.Sci.,30,545–560.(in Chinese)
Huang,R.H.,J.L.Chen,and G.Huang,2007:Characteristicsand variations of the East Asianmonsoon system and its impacts on climatedisasters in China.Adv.Atmos.Sci.,24,993–1023, doi:10.1007/s00376-007-0993-x.
Huang,R.H.,J.L.Chen,L.Wang,and Z.D.Lin,2012:Characteristics,processes,and causes of the spatio-temporal variabilitiesof the EastAsianmonsoon system.Adv.Atmos.Sci., 29,910–942,doi:10.1007/s00376-012-2015-x.
Huffman,G.J.,and Coauthors,1997:The global precipitation climatology project(GPCP)combined precipitation dataset. Bull.Amer.Meteor.Soc.,78,5–20.
Kalnay,E.,and Coauthors,1996:The NCEP/NCAR 40-year reanalysis project.Bull.Amer.Meteor.Soc.,77,437–471.
Lau,K.-M.,K.-M.Kim,and S.Yang,2000:Dynamical and boundary forcing characteristics of regional components of the Asian summermonsoon.J.Climate,13,2461–2482.
Lu,R.Y.,2001:Interannual variability of the summertime North Pacific subtropical high and its relation to atmospheric convection over thewarm pool.J.Meteor.Soc.Japan,79,771–783.
Lu,R.Y.,2004:Associations among the components of the East Asian summermonsoon system in themeridional direction. J.Meteor.Soc.Japan,82,155–165.
Lu,R.Y.,and Z.D.,Lin,2009:Role of subtropical precipitation anomalies in maintaining the summertime meridional teleconnection over the western North Pacific and East Asia.J. Climate,22,2058–2072.
Nitta,T.,1987:Convective activities in the tropical western Pacific and their impact on the Northern Hem i sphere summer circulation.J.Meteor.Soc.Japan,64,373–390.
North,G.R.,T.Bell,R.F.Cahalan,and F.J.Moeng,1982:Sampling errors in the estimation of empirical orthogonal functions.Mon.Wea.Rev.,110,699–706.
Shen,B.Z.,Z.D.Lin,R.Y.Lu,and Y.Lian,2011:Circulation anomalies associated w ith interannual variation of early-and late-summer precipitation in NortheastChina.Science China Earth Sciences,54,1095–1104.
Shen,S.,and K.M.Lau,1995:Biennialoscillation associatedw ith theEastAsian summermonsoonand tropicalseasurface temperatures.J.Meteor.Soc.Japan,73,105–124.
Sm ith,T.M.,R.W.Reynolds,T.C.Peterson,and J.Law rimore, 2008:Improvements to NOAA’s historical merged land–ocean surface temperature analysis(1880–2006).J.Climate, 21,2283–2296.
Su,Q.,R.Y.Lu,and C.F.Li,2014:Large-scale circulation anomalies associated w ith interannual variation in monthly rainfall over South China from May to August.Adv.Atmos. Sci.,31,273–282,doi:10.1007/s00376-013-3051-x.
Takaya,K.,and H.Nakamura,2001:A formulation of a phaseindependentwave-activity flux for stationary and m igratory quasigeostrophic eddies on a zonally varying basic flow.J. Atmos.Sci.,58,608–627.
Wang,B.,R.G.Wu,and K.M.Lau,2001:Interannualvariability of the Asian summermonsoon:Contrastsbetween the Indian and the western North Pacific-East Asian monsoons.J.Climate,14,4073–4090.
Weng,H.Y.,K.M.Lau,and Y.K.Xue,1999:Multi-scalesummer rainfallvariability overChina and its long-term link to global sea surface temperature variability.J.Meteor.Soc.Japan,77, 845–857.
Wu,R.G.,Z.P.Wen,S.Yang,and Y.Q.Li,2010:An interdecadal change in southern China summer rainfallaround 1992/93.J. Climate,23,2389–2403.
Ye,H.,and R.Y.Lu,2012:Dom inantpatternsof summer rainfall anomalies in EastChina during 1951–2006.Adv.Atmos.Sci., 29,695–704,doi:10.1007/s00376-012-1153-5.
You,Y.,Y.Zhou,X.Yang,and L.Fang,2003:Using EOFmethod to analysis the spatial distribution and temporal variation of summer rainfall in China.Journal of Sichuan Meteorology, 23,22–23.(in Chinese)
Zhou,T.-J.,and R.-C.Yu,2005:Atmospheric water vapor transportassociated w ith typical anomalous summer rainfall patterns in China.J.Geophys.Res.,110,D08104,doi:10.1029/ 2004JD005413.
Zhu,Q.G.,and X.G.Chen,1992:Objective division of natural rainfall regions in China.Journal ofNanjing Institute ofMeteorology,15,467–475.(in Chinese)
Zou,L.,and Y.Q.Ni,1998:Impactof ENSO on the variability of the summermonsoon over Asia and the summer rainfall in China.Journal ofTropicalMeteorology,13,306–314.(in Chinese)
10 January 2015;revised 5 June 2015;accepted 9 July 2015)
:Lin,Z.D.,Q.Su,and R.Y.Lu,2016:Revisiting the Second EOFMode of Interannual Variation in Summer Rainfallover EastChina.Adv.Atmos.Sci.,33(1),121–134,
10.1007/s00376-015-5010-1.
∗Corresponding author:Zhongda LIN
Email:zdlin@mail.iap.ac.cn
杂志排行

Advances in Atmospheric Sciences的其它文章
- Variation in Summer Surface Air Tem perature over Northeast Asia and Its Associated Circulation Anomalies
- Ensemble Transform Sensitivity Method for AdaptiveObservations
- Dynam ic and Thermodynam ic Featuresof Low and Midd le Clouds Derived from Atmospheric Radiation Measurement Program Mobile Facility Radiosonde Data at Shouxian,China
- Observational FactsRegarding the Joint Activitiesof the Southwest Vortex and Plateau Vortex after ItsDeparture from the Tibetan Plateau
- Teleconnected Influenceof the BorealW inter Antarctic Oscillation on the Somali Jet:Bridging Role of Sea Surface Tem perature in Southern High and Midd le Latitudes
- Effectsof Surface Flux Parameterization on the Numerically Simulated Intensity and Structureof Typhoon Morakot(2009)