Variation in Summer Surface Air Tem perature over Northeast Asia and Its Associated Circulation Anomalies
2016-08-12WeiCHENXiaoweiHONGRiyuLUAifenJINShizhuJIN
WeiCHEN,XiaoweiHONG,2,Riyu LU∗,Aifen JIN,Shizhu JIN,
Jae-CheolNAM4,Jin-Ho SHIN4,Tae-Young GOO4,and Baek-Jo KIM4
1State Key Laboratory ofNumericalModeling for Atmospheric Sciencesand Geophysical Fluid Dynamics,Institute ofAtmospheric Physics,Chinese Academy ofSciences,Beijing 100029
2University ofChinese Academy ofSciences,Beijing 100049
3DepartmentofGeography,Yanbian University,Yanji133002
4National Institute ofMeteorologicalResearch,Korea Meteorological Administration,Jeju,Korea
Variation in Summer Surface Air Tem perature over Northeast Asia and Its Associated Circulation Anomalies
WeiCHEN1,XiaoweiHONG1,2,Riyu LU∗1,Aifen JIN3,Shizhu JIN3,
Jae-CheolNAM4,Jin-Ho SHIN4,Tae-Young GOO4,and Baek-Jo KIM4
1State Key Laboratory ofNumericalModeling for Atmospheric Sciencesand Geophysical Fluid Dynamics,Institute ofAtmospheric Physics,Chinese Academy ofSciences,Beijing 100029
2University ofChinese Academy ofSciences,Beijing 100049
3DepartmentofGeography,Yanbian University,Yanji133002
4National Institute ofMeteorologicalResearch,Korea Meteorological Administration,Jeju,Korea
This study investigates the interannual variation of summer surface air temperature over Northeast Asia(NEA)and its associated circulation anomalies.Two leadingmodes for the temperature variability overNEA areobtained by EOFanalysis. The fi rst EOFmode is characterized by a homogeneous temperature anomaly over NEA and therefore is called the NEA mode.This anomaly extends from southeastof Lake Baikal to Japan,w ith a central area in Northeast China.The second EOFmode ischaracterized by a seesaw pattern,show ing a contrasting distribution between EastAsia(specifically including the ChangbaiMountains in NortheastChina,Korea,and Japan)and north of this region.Thismode isnamed the East Asia (EA)mode.Bothmodes contribute equivalently to the temperature variability in EA.
The two leading modes are associated w ith different circulation anomalies.A warm NEA mode is associated w ith a positive geopotentialheightanomaly over NEA and thusaweakened upper-troposphericwesterly jet.On the other hand,a warm EA mode is related to a positive heightanomaly over EA and a northward displaced jet.In addition,the NEA mode tends to be related to the Eurasian teleconnection pattern,while the EAmode isassociatedw ith the EastAsia–Pacific/Pacific–Japan pattern.
surface air temperature,NortheastAsia,EastAsia,circulation anomaly,interannualvariability
1. Introduction
Greatattention hasbeen paid to the interannual variability of Northeast Asia(NEA)summer temperature,because of its effects on the economy(e.g.,Ding,1980;Sun et al., 1983).The variability in NEA summer temperature is related to a variety of atmospheric patterns.Itwas found that the pattern ofwave trainsalong theupper-troposphericwesterly jetaffects theNEA summer temperature(Sato and Takahashi,2006).A Rossby wave pattern extending from the Indian Peninsula to NEA is associated w ith NEA temperature variability(Chen and Lu,2014a).In addition,the EastAsia–Pacific/Pacific–Japan(EAP/PJ)teleconnection pattern associatedw ith convection over the tropicalwestern North Pacific can alsomodulate thesummer climateoverNEA(Hirotaand Takahashi,2012;Chen and Lu,2014a).In addition to the two above-mentioned factors,many other factors,including the Okhotsk highs(Sato and Takahashi,2007),polar vortex (Zhang et al.,1985;Gu and Yang,2006),Northern Hem isphere annularmode(He etal.,2006;Wang and Sun,2009) andwestern North Pacific subtropicalhigh(Cuietal.,2007), are also known to influence NEA summer temperature.The variety of teleconnection patternsmentioned above is indicative of the complexity of the remote circulations associated w ith NEA summer temperature variability.
It is expectable that the local circulation anomalies contribute to anomalous NEA temperature.In themiddle troposphere,anomalous geopotential height over NEA affects the local summer temperature(Northeast China Cold Summer Research Group,1979).If NEA is covered by negative height anomalies,cold air becomes active and flows southward from the high latitudes into NEA,resulting in a cold summer.On the other hand,positive height anomalies are associated w ith warmer NEA temperatures(Chen and Lu, 2014a).In the lower troposphere,an anticyclonic circula-tion anomaly occurs along w ith warming over NEA(Chen and Lu,2014a;Gao etal.,2014).The strong southwesterly in the west of the anticyclonic circulation prevents the cold air in the high latitudes from flow ing southward and results in ahigher than normal temperatureoverNEA(Chen and Lu, 2014a).
Furthermore,climate variability over NEA exhibits a regional difference.Iwao and Takahashi(2006,2008)indicated that the interannualvariation ofprecipitationoverNEA showsaseesaw pattern in thenorth and southof Lake Baikal. Sun and Wang(2006)pointed out that the interannual variability of temperature in Northeast China exhibits a seesaw pattern between itsnorth and south areas,shown as the second dom inantmode,while the fi rst leadingmode showshomogeneous variability in the whole region.Therefore,the temperatures in the north and south areasof NortheastChina may exhibitsignificantly different variations.These studies suggested that the interannual variability of NEA summer temperature not only exhibits homogeneous variation,but also showsa regionaldifference in spatialdistribution.Thus, what kind ofmodes does NEA temperature exhibit?What circulation patternsareassociatedw ith such temperaturedistributions?To answer thesequestions thepresentstudy investigates the dom inantmodesof interannualvariability of NEA surfaceair temperatureand itsassociated circulationanomaly during summer.The remainder of the paper is organized as follows:We introduce the datasets used in thiswork in section 2.In section 3,the two leadingmodes of NEA summer temperature are described.The differentcirculation patterns associated w ith these twomodes are compared in section 4. And finally,conclusionsaregiven in section 5.
2. Datasets
The present study uses Climatic Research Unit(CRU; Harris et al.,2014)surface air temperature data based on weather station records,and monthly mean ERA-Interim (European Centre for Medium-RangeWeather Forecasts Interim Reanalysis)data(Dee etal.,2011)for the atmospheric circulation variables including geopotentialheight,temperatureand w ind fields.The study period is from 1979 to 2012. Themean of June,July and August(JJA)representssummer time.We highlight the interannual variability in this study and,considering thatthere isanappreciabledecadalvariation in NEA summer temperature(SunandWang,2006;Chenand Lu,2014b),obtain the component of interannual variability by applying a9-yearGaussian fi lter.Statisticsanalysis isperformed after the fi ltering of alldatasets.
3. Leadingmodesof the summer tem perature over NEA
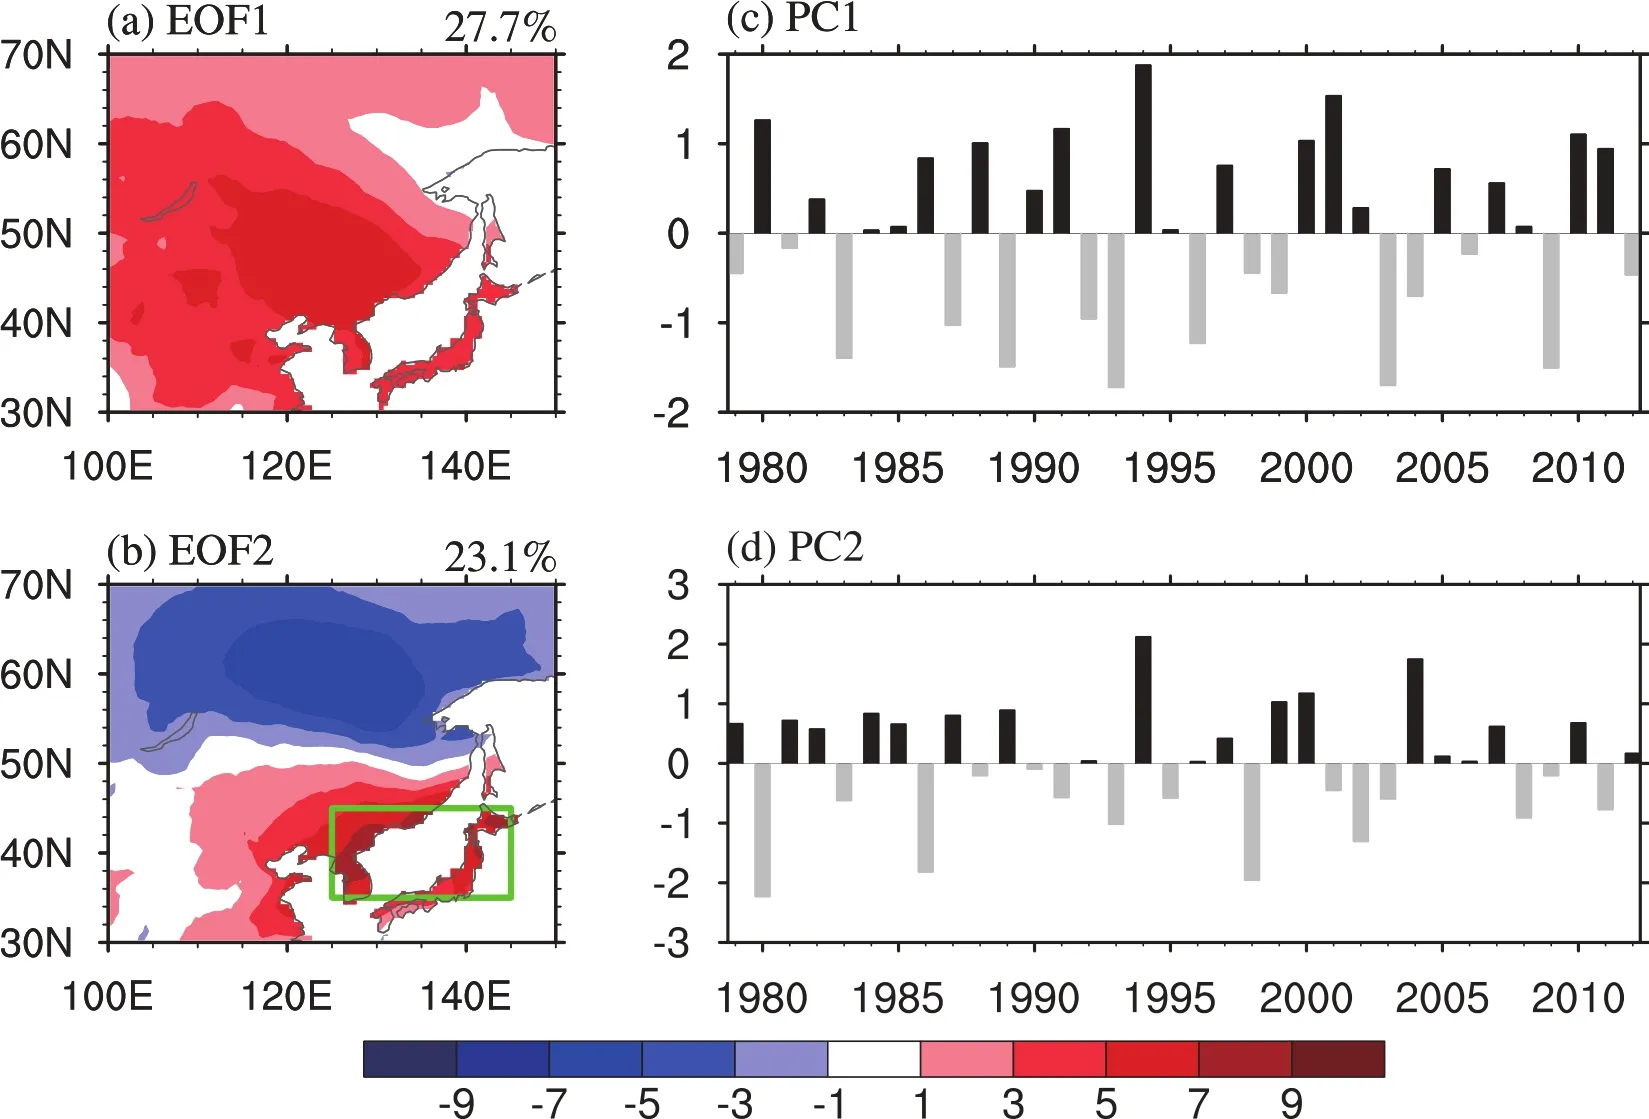
Fig.1.The(a,c)fi rst and(b,d)second leadingmodes and their PC time series for the summer surface air temperature over NEA,determ ined by EOFanalysis.
Figure 1 shows the two leadingmodes of NEA summer temperature,obtained by performing EOF analysis on the summer surface air temperature anomaly w ithin the region (30°–70°N,100°–150°E).These two leadingmodes explain 50.8%of the total variance.The fi rst leadingmode(EOF1) exhibitsasa homogeneous temperature anomaly over NEA, extending from southeastof Lake Baikal to Japan and w itha centralarea in NortheastChina(Fig.1a);the phase line of warm anomalies declines from northwest to southeast.This mode suggests a homogeneous change for the interannual variability of temperature over NEA,including the southeastern part of Russia,Mongolia,northern China,the Korean Peninsula and Japan.Thus,EOF-1 is named the NEA mode.Thismodeexplains27.7%of the totalvariance,which is dom inant in NEA.
It should bementioned that the time series for the fi rst leading mode(PC1)shows a strong decadal variability,if the EOF analysis is performed using the original data(not shown).The decadal variance is so strong that itcan explain more than half of the total variance(55.6%).Therefore,to highlight the interannual variability,we remove the decadal variationsobtained by a 9-year Gaussian fi lter from the originaldata before perform ing the EOFanalysis.
The second leadingmode(EOF 2)behaves as a seesaw pattern for the temperatureanomaly(Fig.1b),in contrastw ith the homogeneous anomaly in EOF1.A positive temperature anomaly and a negative anomaly are located south and north of 50°N,respectively.The positive anomaly is concentrated over EA,including the region of ChangbaiMountains in Northeast China,the Korean Peninsula and central Japan.On the other hand,the negative temperature anomaly isover the northeastof Lake Baikal.EOF-2 displaysan opposite temperatureanomaly between south and north ofNEA and explains23.1%of the totalvariance.EOF-2mainly contributes to ahomogeneous temperatureanomaly overEA,and is therefore called the EAmode.The seesaw pattern issimilar to the distribution of the temperature anomaly associated w ith the Okhotsk highs in Sato and Takahashi(2007,Fig. 6b).Additionally,it should be noted that the seesaw pattern in thisstudy issignificantly different from theseesaw pattern indicated by Sun and Wang(2006).In their result,the seesaw pattern shows a contrasting distribution of temperature anomalies between south and north of 45°N,rather than the latitude of 50°N in this study.This difference results from the different domains for the EOF analysis:we investigated thewhole NEA area,which ismuch larger than that in Sun andWang(2006),whose studywasbased on 23 stationsover NortheastChina.
The surface temperature anomalies in 1980 and 2004, when a negative and a positive EA mode are dom inant in NEA,respectively,are illustrated in Fig.2.In 1980,there are negative temperature anomaliesalong the eastern border of Northeast China,over the Korean Peninsula and central Japan,and positive ones over other parts of NEA.This pattern is sim ilar to the distribution of the temperature anomaly corresponding to the strong Okhotsk highs(Fig.6b in Sato and Takahashi,2007).Actually,thehigher temperature in EA is contributed to by the frequent occurrence of the Okhotsk highs in summer 1980(Kodama,1997).The temperature pattern in 2004 is basically opposite to that in 1980,except for a positive anomaly near the southeast of Lake Baikal. These two years both show a seesaw pattern of the temperature anomaly,indicating a regional difference between the south and north of NEA.This figure confi rms the existence of the EAmode.

Fig.2.Thesummersurfaceair temperatureanomaly(units:°C) overNEA during(a)1980 and(b)2004.
Figure 3 shows the variance explained by these two modes in each grid box of NEA.PC1 contributes to the interannual variability of the temperature anomaly southeast of Lake Baikal(Fig.3a).Formost regions,the explained variance ismore than 20%,including Mongolia,Northeast China,the Korean Peninsulaand Japan.In central Northeast China,theexplained variance ismore than40%.On theother hand,PC2 is in response to the temperatureanomaly over the region of the ChangbaiMountains,Korean Peninsula,Japan and northeast of Lake Baikal(Fig.3b).The variance explained by PC2 in these regions isapproximately 40%.Overall,the interannual variability of NEA temperature ismodulated by these twomodes(Fig.3c).The temperature variances in EA can bemostly explained by these twomodes, which together explainmore than 60%of the total variance inmost areas of EA.In particular,these twomodes explain about90%of the totalvariance in the ChangbaiMountains.

Fig.3.The variance for each grid over NEA explained by(a) PC1,(b)PC2 and(c)PC1 and PC2 combined.
Figure 4 shows the time series of the temperature anomaly over EA,defined as the East Asian Temperature (EAT)index.The EAT index represents the temperature anomalies averaged over the region(35°–45°N,125°–145°E).The EAT index is closely relatedw ith PC1 and PC2, w ith correlation coefficients of 0.62 and 0.57,respectively, both significantat the 99%confidence level.The sim ilar coefficients suggest that the temperature anomalies in EA are equivalently affected by the NEA and EA modes,confi rming the results shown in Fig.3.Furthermore,the yearswhen PC1 and PC2 aregreater(less)than 0.8(−0.8)standard deviation aremarked.Half of the years(16 years)are dominated by only onemode:ten years by PC1 and six years by PC2. Seven years are dom inated by the combination of PC1 and PC2.Among them,PC1 and PC2 offset each other in four years and overlap in other years.These results suggest that attention should bepaid to both PC1 and PC2 for the temperature anomaly over EA.
Figure 5 shows the vertical profi les of temperature anomaliesoverNEA associatedw ith these twomodes.Along 125°–145°E,theNEAmode ischaracterized asastrong temperature anomaly in them idlatitudes(35°–55°N)(Fig.5a). The temperature anomalies extend from the lower to the upper troposphere.On the contrary,the EA mode is related to a shallow temperature anomaly confined to the lower troposphere,but much weaker in the m iddle and upper troposphere.In the upper troposphere,there are some positive anomalies,which aremainly over the higher latitudes rather than the EA region(Fig.5b).Additionally,the positive temperature anomaly around 40°N is associated w ith negative temperature anomalies in the higher and lower latitudes.Thus,in themeridional direction,the vertical structures for the summer temperature anomaly in response to these two modes are different.Furthermore,this difference can also be demonstrated in the zonaldirection(Figs.5c and d).Along 35°–45°N,the NEAmode showsa strong temperatureanomaly covering90°–150°E in thewhole troposphere, but the EAmode showsa positiveanomaly over120°–150°E and is mainly lim ited to the lower troposphere.It seems that the vertical profi le of the temperature anomaly associated w ith PC2 tends to be northward-and westward-tilted w ith height(Figs.5b and d),implying the existence of local baroclinic energy conversion from mean flows to the EAP/PJ pattern(Kosakaand Nakamura,2006;Chen etal.,2013).
4. Circulation associated w ith NEA summ er tem perature variability
These different temperature modes are associated w ith different circulation patterns.Figure 6 shows the 500 hPa geopotential height anomalies associated w ith the two PCs. For PC1,there is a remarkable positive geopotential height anomaly over NEA,w ith a central area in Northeast China. This positive anomaly covers the whole of NEA and is accompanied by warmer temperatures(Fig.1a).Furthermore, this positive anomaly is related to a negative and a positive anomaly over the north of the Caspian Sea and near the Scandinavian Peninsula,respectively,corresponding to the Eurasian teleconnection(EU)pattern(Wallace and Gutzler,1981).The correlation coefficientbetween PC1 and the EU index(Wallace and Gutzler,1981)is 0.47,significantat the 99%confidence level.Moreover,thewave activity flux shown in Fig.6a indicates that the EU teleconnection patterncan be considered as the eastward propagation of planetary waves from Western Europe to NEA,and can contribute to the NEA mode.These circulation anomaliesassociated w ith theNEAmodearedifferent from those in Sato and Takahashi (2006),who suggested thatawave trainalong thewesterly jet affects thesummer temperature in Japan.

Fig.4.The time seriesof the EAT index(units:°C),defined as the surface air temperature averaged w ithin the region(35°–45°N,125°–145°E),marked in Fig.1.The yearswhen PC1 and PC2 are greater(less)than 0.8(−0.8)standard deviation aremarked.

Fig.5.Regression of the vertical profi le of temperature anomalies(units:°C)onto the(a,c)fi rstand (b,d)second PC time series:(a,b)temperature anomalies averaged over 125°–145°E;(c,d)temperature anomaliesover35°–45°N.Shading indicates regionswhere anomaliesare significantat the 95% confidence level,according to the t-test.The thick contours represent0.3°C.
For PC2,however,the positive geopotential height anomaly is weaker and southward shifted,being lim ited to EA.It is associated w ith negative anomalies over the northeastof Lake Baikal.The seesaw pattern of the geopotential heightanomaly corresponds to a sim ilar pattern for the temperature anomaly(Fig.1b).Additionally,it is also related to a negative anomaly over thewestern North Pacific.This distribution of circulation anomalies resembles the EAP/PJ pattern(e.g.,Nitta,1987;Huang and Sun,1992).Additionally,the wave activity flux shown in Fig.6b indicates that the EAP/PJ teleconnection is characterized by a connection among higher,middleand lower latitudes(e.g.,Nitta,1987). The correlation coefficient between PC2 and the EAP index(Huang and Yan,1999)is 0.82.Huang and Yan(1999) defined the EAP index by the 500 hPa geopotential height anomaly at 40°N minus that at 20°N and 60°N,along the longitude of 125°E.This close relationship between the EA mode and EAP pattern implies that the EA mode may be related to the convection anomalies in the tropicalwestern North Pacific,since it is well-known that the EAP/PJ pattern is closely associatedwith tropical convection anomalies. Actually,a positive(negative)EA mode is significantly associatedw ith significantly enhanced(suppressed)convection over the Philippine Sea,which is not shown,but can be illustrated by thehigh correlation coefficient(−0.74)between PC2 and the outgoing longwave radiation anomaly over the Philippine Sea(10°–25°N,120°–140°E).This EAP/PJ pattern issim ilar to thatin Hirotaand Takahashi(2012,Fig.4b). Hirota and Takahashi(2012)suggested that the EAP/PJpattern isan internalmode in theatmosphere,butcanbeaffected by the convection activity over the tropicalwestern North Pacific.Therefore,we suggest that the EA mode can also be considered as an internalmode,but is affected by tropical forcing.
The temperature anomaly for the NEA mode ismainly contributed to by the local geopotential height anomaly (Chenand Lu,2014a;Gaoetal.,2014).Thepositiveanomaly southeast of Lake Baikal(Fig.6a)is closely related to the warm temperature over NEA(Fig.3a).On the other hand, the positive geopotentialheightanomaly associated w ith the EAmode(Fig.6b)is relatively weak,and its contribution to the temperatureanomaly in EAmay besmall.

Fig.6.As in Fig.5 but for the500 hPageopotentialheightanomaly(units:m)and stationary wave activity flux[vectors;units:m2s−2;according to Takaya and Nakamura (2001)].
The differences between the circulation patterns associated w ith two PCs can also be illustrated by the profi les of geopotential height(Fig.7).The profi le of geopotential heightassociated w ith PC1 showsa strong positive center inmiddle latitudes(Fig.7a).This anomaly extends from the upper to lower troposphere,being consistentw ith the deep temperature anomaly over NEA(Figs.5a and c).In addition,the positive anomaly seems to be isolated in themeridionaldirection,w ithoutconnectionw ith the lowerand higher latitudes.On the contrary,PC2 is associated with a narrow positive center in them iddle latitudes,and shows a“+−+”pattern from the lower to higher latitudes(Fig.7b),indicating a connection of the EA modew ith the lower and higher latitudes.
Figure 8 shows the zonalw ind anomalies at200 hPa associated w ith the NEA and EA modes.The NEA mode is associatedwithanegativeanomaly along 40°Nwhere theclimatologicalEastAsian jet(EAJ)locates.Therefore,theNEA mode is related to the change in the intensity of the EAJ.PC1 is significantly correlated w ith the EAJintensity index,w ith a negative correlation coefficientof−0.58.Here,we define the EAJindex as the200 hPazonalw ind anomaliesaveraged over(35°–45°N,100°–140°E),which is sim ilar to Lu(2004) butw ith a westward shift of the averaging region.The results suggest that a warm(cold)NEA mode corresponds to aweakened(strengthened)EAJ.The connection between the NEA mode and the EAJ intensity can be explained by the weakened meridional gradient of geopotential heights over the EA in association w ith the positive heightanomaly over NEA(Fig.6a).

Fig.7.Asin Fig.5but for theverticalprofi leof thegeopotential heightanomaly averaged over125°–145°E(units:m).

Fig.8.As in Fig.5 but for the 200 hPa zonalw ind anomaly (units:m s−1).The thick dashed lines represent the location of the climatological EastAsianwesterly jet.
On the other hand,PC2 is associated w ith a positive anomaly and a negative one north and south of the EAJ,respectively(Fig.8b).Itmeans that the EAmode is related to a meridionalshiftof the EAJ.Furthermore,the correlation coefficientbetween PC2 and the EAJmeridional shift index is 0.69.The EAJmeridionalshift index isdefined as the difference of 200 hPa zonalw ind anomalies averaged over(40°–50°N,100°–140°E)and(30°–40°N,100°–140°E),which is similar to Lu(2004)and Lin and Lu(2005)butw ith awestward shift of the averaging regions.These results indicate thata positive(negative)EA mode is in response to a northward(southward)shift of the EAJ.The northward(southward)shiftof the EAJis associated w ith an anticyclonic(a cyclonic)anomaly(Fig.6b)and awarmer(colder)tempera-ture in EA(Fig.1b).
5. Conclusions
This study investigates the two leading modes of interannual variation of summer surface temperature over NEA during the period 1979–2012.EOF analysis is applied on NEA summer temperature using CRU data,which are based onweather station records.
Two leadingmodes are demonstrated in this study.The fi rst leading mode is characterized as the NEA mode,w ith a homogeneous temperature anomaly covering thewhole of NEA.Thismode indicates a homogeneous change in the interannual variability of summer temperature extending from southeastof Lake Baikal to Japan.The second leadingmode exhibits as a seesaw pattern between the follow ing two regions:(1)the ChangbaiMountains in Northeast China,the Korea Peninsulaand central Japan;and(2)northeastof Lake Baikal.Thismode is called the EAmode.These twomodes are associated w ith different vertical structures of temperature:significantair temperature anomalies appear in the entire troposphere for the NEA mode,butare concentrated in the lower troposphere for the EAmode.
Moreover,bothmodes are equivalently important to the temperature over the region of the ChangbaiMountains,Korean Peninsulaand central Japan.Thecorrelation coefficients between PC1 and PC2 w ith the temperature averaged over this region are 0.62 and 0.57,respectively.The interannual varianceof temperatureoverEA explained by theNEAmode is close to thatexplained by the EA mode.Thus,the results indicate that EA temperature ismodulated by the combination of these twomodes.
The two leadingmodes are in response to different patterns of circulation anomalies.Thewarm NEA mode is related to a strong positive geopotential height anomaly over NEA in the entire troposphere,while the warm EA mode is associated w ith a positive height anomaly over EA and a strong negative anomaly to the north.Correspondingly, thewarm NEA mode is associated w ith a weakened uppertropospheric westerly jet,and thewarm EA mode is related to apoleward shiftedwesterly jet.In addition,theNEAmode tends to be related to the EU pattern,while the EA mode is closely related to the EAP/PJpattern.
The present results suggest that the regional difference in interannual temperature variability in NEA should be noticed besides the homogeneous change.The homogeneous change(the NEA mode)and regional difference(the EA mode)are in response to different circulation patterns and different physical processes.In particular,bothmodes contributeequivalently and greatly to the temperatureanomalies over EA,suggesting that thesemodesshould be furtherstudied for a better understanding of temperature variability in EA.
Acknow ledgements.Theauthorsacknow ledge the twoanonymous reviewers for their valuable comments and suggestions.This studywassupported by the NationalNatural Science Foundation of China(GrantNos.41105046 and 41320104007).
REFERENCES
Chen,G.S.,R.H.Huang,and L.T.Zhou,2013:Baroclinic instability of the silk road pattern induced by thermaldamping.J. Atmos.Sci.,70,2875–2893.
Chen,W.,and R.Y.Lu,2014a:The interannual variation in monthly temperature over Northeast China during summer. Adv.Atmos.Sci.,31(4),515–524,doi:10.1007/s00376-013-3102-3.
Chen,W.,and R.Y.Lu,2014b:A decadalshiftof summer surface air temperature over Northeast Asia around them id-1990s. Adv.Atmos.Sci.,31(4),735–742,doi:10.1007/s00376-013-3154-4.
Cui,J.,J.Li,A.Z.Zhang,and Q.Yan,2007:Advances in studies of summer low temperature in NortheastChina.Meteorologica Monthly,33(4),3–9,doi:10.3969/j.issn.1000-0526.2007. 04.001.(in Chinese)
Dee,D.P.,and Coauthors,2011:The ERA-Interim reanalysis: Configuration and performance of the data assim ilation system.Quart.J.Roy.Meteor.Soc.,137,553–597,doi:10.1002/ qj.828.
Ding,S.S.,1980:The climatic analysis of low temperature in summer over the Northeast China and influence for agriculturalproduct.Acta Meteorologica Sinica,38(3),234–242.(in Chinese)
Gao,Z.T.,Z.Z.Hu,B.Jha,S.Yang,J.S.Zhu,B.Z.Shen,and R.J.Zhang,2014:Variability and predictability of Northeast China climateduring 1948–2012.Climate Dyn.,43,787–804.
Gu,S.N.,and X.Q.Yang,2006:Variability of the northern circumpolar vortex and its association w ith climate anomaly in China.Scientia Meteorologica Sinica,26(2),135–142.(in Chinese)
Harris,I.,P.D.Jones,T.J.Osborn,and D.H.Lister,2014:Updated high-resolution gridsofmonthly climatic observations–the CRU TS3.10 Dataset.International Journal ofClimatology,34,623–642.doi:10.1002/joc.3711.
Hirota,N.,and M.Takahashi,2012:A tripolar pattern asan internalmode of the East Asian summermonsoon.Climate Dyn., 39,2219–2238.
He,J.H.,Z.W.Wu,and L.Qi,2006:Relationships of Northern Hem ispheric annualmode and Northeast China cold vortex w ith summerprecipitation in EastAsiaand China.Journalof Meteorology and Environment,22,1–5.(in Chinese)
Huang,G.,and Z.W.Yan,1999:The East Asian summermonsoon circulation anomaly index and its interannualvariations. Chinese Science Bulletin,44(14),1325–1329.
Huang,R.H.,and F.Y.Sun,1992:Impactof the tropicalwestern Pacific on the East Asian summermonsoon.J.Meteor.Soc. Japan,70,243–256.
Iwao,K.,and M.Takahashi,2006:Interannualchange in summertime precipitation over northeast Asia.Geophys.Res.Lett., 33,L16703,doi:10.1029/2006GL027119.
Iwao,K.,and M.Takahashi,2008:A precipitation seesaw mode between Northeast Asia and Siberia in summer caused by Rossby waves over the Eurasian Continent.J.Climate,21, 2401–2419.
Kodama,Y.M.,1997:Airmass transformation of the Yamase airflow in the summer of 1993.J.Meteor.Soc.Japan,75,737–751.
Kosaka,Y.,and H.,Nakamura,2006:Structure and dynam ics of the summertime Pacific–Japan teleconnection pattern.Quart. J.Roy.Meteor.Soc.,132(619),2009–2030.
Lin,Z.D.,and R.Y.Lu,2005:Interannual meridional displacement of the East Asian upper-tropospheric jet stream in summer.Adv.Atmos.Sci.,22,199–211,doi:10.1007/ BF02918509.
Lu,R.Y.,2004:Associationsamong the components of the East Asian summermonsoon system in themeridional direction. J.Meteor.Soc.Japan,82,155–165.
Nitta,T.,1987:Convectiveactivitiesin the tropicalwestern Pacific and their impacton the northern hem isphere summer circulation.J.Meteor.Soc.Japan,65,373–390.
NortheastChina Cold Summer Research Group,1979:A preliminary study on the long range forecasting of the cold/warm summer in Northeast China.Acta Meteorologica Sinica, 37(3),44–58.
Sato,N.,and M.Takahashi,2006:Dynamical processes related to the appearance of quasi-Stationary waves on the subtropical jetin them idsummernorthern hem isphere.J.Climate,19, 1531–1544.
Sato,N.,and M.Takahashi,2007:Dynam icalprocesses related to theappearanceof theOkhotsk high during earlymidsummer. J.Climate,20,4982–4994.
Sun,J.Q.,and H.J.Wang,2006:Regional difference of summer air temperature anomalies in NortheastChina and its relationship to atmospheric general circulation and sea surface temperature.Chinese JournalofGeophysics,49,588–598.
Sun,Y.T.,S.Y.Wang,and Y.Q.Yang,1983:Studies on cool summerand crop yield in NortheastChina.Acta Meteorologica Sinica,41(3),313–321.(in Chinese)
Takaya,K.,and H.Nakamura,2001:A formulation of a phaseindependentwave-activity flux for stationary and m igratory quasigeostrophic eddies on a zonally varying basic flow.J. Atmos.Sci.,58,608–627.
Wang,H.J.,and J.Q.Sun,2009:Variability of northeast China river break-up date.Adv.Atmos.Sci.,26(4),701–706,doi: 10.1007/s00376-009-9035-1.
Wallace,J.M.,and D.S.Gutzler,1981:Teleconnections in the geopotentialheight field during thenorthern hem ispherew inter.Mon.Wea.Rev.,109,784–812.
Zhang,S.Q.,T.J.Yu,F.Y.Li,X.M.Wang,X.F.Wang,andW.M. Wu,1985:Seasonal variation of Northern Hem isphere polar vortex areaand associated intensity,and theirassociationw ith the temperatures in Northeast China.Scientia Atmospherica Sinica,9,178–185.(in Chinese)
15 February 2015;revised 22 June 2015;accepted 26 June 2015)
:Chen,W.,and Coauthors,2016:Variation in summersurfaceair temperatureoverNortheastAsiaand itsassociated circulation anomalies.Adv.Atmos.Sci.,33(1),1–9,
10.1007/s00376-015-5056-0.
∗Corresponding author:Riyu LU
Email:lr@mail.iap.ac.cn
杂志排行

Advances in Atmospheric Sciences的其它文章
- Ensemble Transform Sensitivity Method for AdaptiveObservations
- Dynam ic and Thermodynam ic Featuresof Low and Midd le Clouds Derived from Atmospheric Radiation Measurement Program Mobile Facility Radiosonde Data at Shouxian,China
- Observational FactsRegarding the Joint Activitiesof the Southwest Vortex and Plateau Vortex after ItsDeparture from the Tibetan Plateau
- Teleconnected Influenceof the BorealW inter Antarctic Oscillation on the Somali Jet:Bridging Role of Sea Surface Tem perature in Southern High and Midd le Latitudes
- Effectsof Surface Flux Parameterization on the Numerically Simulated Intensity and Structureof Typhoon Morakot(2009)
- Verification and Correction of Cloud Base and Top Height Retrievals from Ka–band Cloud Radar in Boseong,Korea