Numerical study of im purity distribution in ultrasonic heat meter body*
2015-12-01SHIShuo石硕SUNJianting孙建亭DUGuangsheng杜广生ZHANGin张敏SchoolofEnergyandPowerEngineeringShandongUniversityJinan25006China2KeyLaboratoryofRenewableEnergyUtilizationTechnologyinBuildingofNationalEducationinistryShandongJianzhu
SHI Shuo (石硕), SUN Jian-ting (孙建亭), DU Guang-sheng (杜广生), ZHANG M in (张敏). School of Energy and Power Engineering, Shandong University, Jinan 25006, China2. Key Laboratory of Renewable Energy Utilization Technology in Building of National Education M inistry,Shandong Jianzhu University, Jinan 25000, E-mail: shishuo@sdjzu.edu.cn
Numerical study of im purity distribution in ultrasonic heat meter body*
SHI Shuo (石硕)1,2, SUN Jian-ting (孙建亭)1, DU Guang-sheng (杜广生)1, ZHANG M in (张敏)1
1. School of Energy and Power Engineering, Shandong University, Jinan 250061, China
2. Key Laboratory of Renewable Energy Utilization Technology in Building of National Education M inistry,Shandong Jianzhu University, Jinan 250001, E-mail: shishuo@sdjzu.edu.cn
(Received February 7, 2015, Revised August 4, 2015)
Based on a discrete phase model, the numerical simulation is carried out for the flow fields of different size calcium carbonate suspensions in the ultrasonic heat meter body. The flow characteristics and the impurity distribution in the ultrasonic heat meter body are analyzed. The errors of the ultrasonic heat meter in measuring calcium carbonate suspensions of particles of 10 micrometers and the causes are analyzed by simulation and experiment. Results show the effects of the impurities on the value of the k coefficient and the sound attenuation on the reflection path due to the particle distribution are the two main factors that influence the measurement accuracy.
impurity, ultrasonic heat meter, discrete phase, numerical simulation
Introduction0F
A long w ith the rapid development of the global economy, the environment and the energy shortage become more and more a serious issue. In recent year's w inters, many cities in the northern China are shrouded in a pollution haze, which affects the health of people and the social stability. The energy conservation and the pollution treatment are very important in our country. This problem is related w ith the coal burning in the heat supply process. A reform of heat charging is an important measure for avoiding the energy waste and reducing the pollution. As a core part of the reform, the heat metering must have a certain degree of accuracy in measurement. But due to the bad water quality in China, impurities greatly affect the measurement accuracy. Analyzing the distribution of different size impurities in the heat meter body at different flow rates and studying the effects of impurities on the measurement are important to improve the accuracy of the ultrasonic heat meter.
A great deal of work was devoted to improving the flow characteristics in the heat meter body. Zhao et al.[1]studied the influence of complex flow profiles on the multipath ultrasonic gas flow meter performance and installed a conditioner upstream to reduce the measurement error. The reflection device of ultrasonic flowmeter is studied by Li et al.[2]using FEM method,which adopted the acoustic-structure coupling method to connect the sound pressure in fluid domain and the structural deformation in solid domain.. Zheng et al.[3]discussed the effects of the transducer protrusion and recess on the ultrasonic flowmeter accuracy by CFD and indicated that the protruding transducers are a better arrangement type. Based on the CFD results,Zheng et al.[4]developed a novel three-dimensional flow pattern model by the trust region New ton algorithm, to provide a practical method to study the flow adaptability of the ultrasonic flowmeter in non-ideal flow fields. The performance of the ultrasonic flow meters installed in the Three Gorges power station was analyzed by Wang et al.[5]w ith respect to the effects of the complex flow field on the metering accuracy. Xiao[6]used the large eddy simulation method to simulate the instantaneous line and correction coefficient k at different speeds and reduced channel areas in the pipeline. However, the effects of impurities on the ultrasonic flow meter measurement have not been given a due attention.
The flow of water containing impurities in an ul-trasonic heat meter is a complicated solid-liquid twophase flow problem. Its distribution in the ultrasonic heat meter body and the impurity effect on the continuous phase are closely related to the particle size,shape, density, compactness, the flow field characteristics of the continues phase and other factors. For the solid-liquid two-phase flow, Tarpagkou and Pantokratoras[7]studied the interaction between the secondary phase and the primary phase and the way this influence affects the efficiency of the tank, using a Lagrangian method with two-way coupled calculations. Mezheriche et al.[8]compared the DEM and DPM methods in the simulation of the particle pneumatic conveying. Hsu et al.[9]drew the motion trace of a single particle of different particle sizes and densities in the hydrocyclone separator with the RSM and DPM models, and it was found that the particle size influences the separation efficiency more significantly. Recent years, many research progresses were made of the solid-liquid two-phase flow by Xu et al.[10],WANG et al.[11], CHEN et al.[12], Li[13], Noorpoor and Vahidi[14]and other scholars. Shi et al.[15]studied the errors in the U type ultrasonic heat meter measurements due to the water containing impurities by experiment, but the flow field characteristics were not analyzed in detail.

Fig.1 A section of DN25 ultrasonic heat meter
1. Physical model and numerical method
A section of the DN25 ultrasonic heat meter is shown in Fig.1, where the ultrasound emission and reception is carried out by two transducers. The TOFROM arrow represents the ultrasonic propagation path[15]. The line-average velocity on the propagation path can be calculated by Eq.(1), then it is converted to the face-averaged velocity according to the distribution factor of the velocities in the heat meter body. To avoid the instability of the flows at the inlet and exit, a ten diameter long pipe is added in front of the heat meter and a five diameter long pipe is added behind it. Because of the reducer and the reflection beam with slopes, the structure of the ultrasonic heat meter is very complex. An unstructured grid is employed for the calculation region to adapt the local variations of the structure. Grid independence of the results is checked for grid sizes of 2.3×10⁷, 4.7×10⁷, 1.07×10⁸and 3.6×10⁸elements. The outlet flow is changed from the 1.07×10⁸case only by 0.1% upon further refinement. Hence the 1.07×10⁸element mesh is chosen. According to experiment[15], when the calcium carbonate mass concentration is 1%, the error of the ultrasonic heat meter is large at a small flow rate. So the particle size of 1 µm, 10 µm and 100 µm calcium carbonate suspensions with 1% mass concentration are chosen to simulate when the instantaneous flow rate is 0.07 m3/h,0.14 m3/h, 0.35 m3/h, 1.05 m3/h, according to the test standard of the DN25 heat meter[15].
The flow of the calcium carbonate suspensions in the U type ultrasonic heat meter is very complex. Our study focuses on the distribution and the influence of the particles on the continues phase. As the volume fraction is much less than 10%-12%, the DPM model is selected to trace the particles and the time-averaged Navier-Stokes equations are used to describe the fluid movement. The flow is turbulent except when the flow rate is 0.07 m3/h. The turbulence fluctuation and the time-averaged value are described by the standard k-εturbulent model. The particle movement is solved using an independent momentum equation. The two-way coupling between the two phases is implemented by alternately solving the liquid and discrete phase equations until the solutions in both phases converge, with a term of the momentum exchange to represent the interaction between the two phases.
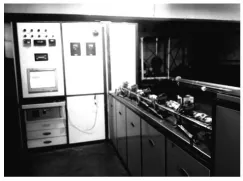
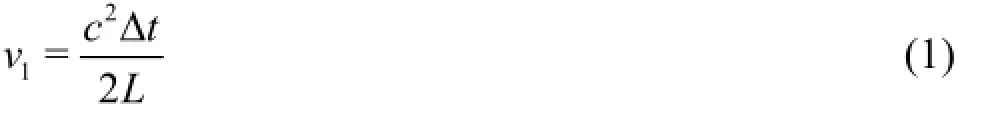
Fig.2 Calibrator for heat meter inspection
Fig.3k coefficient of different water samples at five flow rates

Table 1k coefficient comparison for calcium carbonate suspensions and water
2. Mathematical model
2.1 Continues phase
The liquid phase satisfies the continuity equation and the momentum equation, which are described as follows under the steady state.
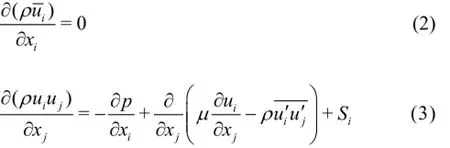
where ρ,µrepresent the fluid density and the dynamic viscosity, respectively, the range ofIand j is (1,2,3),is the Reynolds stress, and Siis the generalized source item.
2.2 Discrete phase
Differential equations of the particle forces in Cartesian coordinates are as follows

where FD(u-up)is the force induced by the speed difference in phases,gx(ρp-ρ)is the gravity item inx direction.uand upare the liquid phase velocity and the particle velocity,dprepresents the particle diameter,Fxis other forces inxdirection which include the additional mass force, the thermophoretic force, the brown force and the Saffman lift force.ρ, ρprepresent the fluid density and the particle density, respectively[16-18]. What makes 1 µm particles different from other particles is that the Saffman lift force should be considered because of their small size.
2.3 Balance of particles in heat meter body
The particles move in the pipe along with the fluid, when the gravity, the resistance and the buoyancy are in equilibrium. The terminal velocity can be expressed as

where dpis the diameter of the particle, and CDis the drag coefficient.
In the heat meter body, the liquid is driven to move horizontally forward, and the influences of other factors such as the turbulent exchange, the asymmetric flow of the complex structure in the heat meter body and the superposition of particles are superimposed. As a result, the behavior of the solid particle movement is more complicated. When the diameter of particles is small, the buoyancy and the turbulent force play a major role, the particles can suspend in the heat meter body. When the diameter of particles is large,the particles can suspend as long as

in which,u′is time averaged pulsation of turbulence. Besides, the fluid velocity should be greater than the velocity that begins to subside.
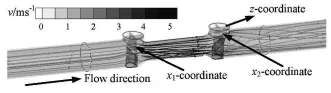
Fig.4 3-D streamlines of 3.5 m3/h flow rate

Fig.5 Contours of velocity magnitude for different flow rates
3. Analysis of simulated results
The impurities affect the ultrasonic heat meter measurement accuracy in at least two ways: (1) the movement of the impurities affects the flow field of the continuous phase, especially the coefficient k, that is the ratio of the line-averaged velocity to the areaaveraged velocity on the reflecting path, (2) if the particle diameter or the concentration of impurities reach a certain level, the ultrasonic attenuation will follow,which influences the signal acquisition.
3.1 The influence of particle concentration on thek coefficient
The direct measurement result of the ultrasonic heat meter is the line-averaged velocity on the ultrasonic propagation path, and whether it can accurately reflect the velocity of the flow section is very important to the measurement accuracy. The difference between the line-averaged velocity and the area-averaged velocity depends on the velocity distribution.
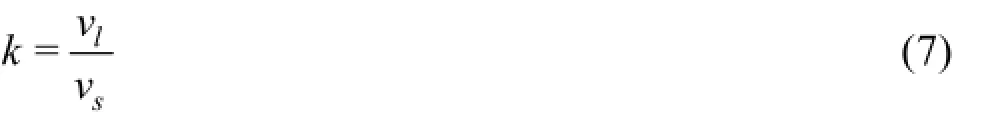
Calculation models for water and the three kinds of suspensions of different particle sizes in the heat body are used with Fluent in calculations until convergence. Then the line-averaged velocity on the propagation path and the area-averaged velocity are simulated. The flow testing of water is carried out using the flow calibration facility shown as Fig.2. The area-averaged velocity is obtained from the time averaged total flow, which is measured by the weighing device of the flow calibration facility. The line-averaged velocity is calculated by Eq.(1), in which Δtrepresents the time difference between those of downstream and upstream, crepresents the propagation velocity of the ultrasound in a stationary liquid. The data acquired from simulation and experiment are computed by Eq.(7) respectively to obtain thek coefficient value, in which,vland vsmean the line averaged velocity on the reflection path and the area-averaged velocity of the center section of the heat meter body.
A coordinate system is established as shown in Fig.3, where thek coefficient is on the vertical axis and the flow rate is on the horizontal axis. Four sets of the simulation results of water and different size particle calcium carbonate suspensions and the experiment results are plotted on it. Compared with the result of water, thek coefficient and the errors of three kinds of calcium carbonate suspensions are shown in Table 1. It is clear from these data:
(1) The experimental curve and the theoretical curve almost overlap, which means that the calculation model is reliable.
(2) Thek coefficient decreases with the increase of the flow rate, and tends to a stable value when the flow rate is greater than 1.05 m3/h.
(3) The calcium carbonate particles have a great effect on the value of the kcoefficient when the flow rate is 0.07 m3/h and 0.14 m3/h, especially, 0.07 m3/h. While the flow rate is high, the influence of impurities on thek coefficient is small, and the errors are within 0.35%.
The dependence of thek coefficient on the flow rate is mainly due to the different fluid velocity distributions in the heat meter for different velocities. The three-dimensional streamlines are shown in Fig.4,where it can be seen that the fluid flows into the heat meter body from the entry section, forming a circling flow when the flow goes through the reflection beam. Then it is rectified and the velocity increases by the reducer. After the flow goes through another reflection beam, it finally flows out from the outlet. To observe the particle distribution characteristics more clearly, two x-coordinate surfaces through the axis of the reflection beam and a z-coordinate surface at the center of the heat meter body are built on the heat meter, as shown in Fig.4.
When the flow is laminar, it goes into the heat meter body through the entrance section and turns to a fully developed laminar flow. The strong viscous effect induces a large velocity gradient, leading to an uneven velocity distribution in the cross section. The velocity near the wall is close to zero while the velocity at the axis is high because it is far away from the wall. As a result, the difference between the line-averaged and area-averaged velocities is more significant, as shown in Fig.5(a), where thek coefficient is greater than 1. For a fully developed turbulent flow, due to the lateral momentum exchange perpendicular to the flow direction, the velocity distribution along the radial direction is more balanced and is well compared with the laminar flow, as shown in Fig.5(b). In addition, the energy loss comes into being because of the circling flow near the reflection beam. A boundary layer is formed on the reflective beam surface, which means that the line-averaged velocity near the reflection surface decreases significantly and the velocity distribution is different from that in water without impurities. As a result, the line-averaged velocity is lower than the area-averaged velocity. When the flow rate is over 1.05 m3/h, the flow turns to be a turbulent rough flow, and the flow state could no longer be affected by the Reynolds number, then thek coefficient tends to be stable.

Fig.6 Area-averaged DPM concentration of different particle sizes at heat meter body bottom
When the flow rate is low, the axial fluctuating velocity of the liquid phase decreases, which reduces the liquid impurity-carrying capacity. According to Eq.(5), the deposition amount of impurities at the bottom increases gradually with the increase of the particle size because the terminal velocity increases. The relationship between the area-averaged impurity concentration at the heat meter body bottom and the flow rate of different particle sizes is shown in Fig.6. The deposition amount decreases with the increase of the flow rate, as shown in Fig.6. The deposition amount of the 1 µm calcium carbonate particles is small, and the 1 µm particles move in the heat meter in a sediment transport motion in homogeneous solid-liquid twophase flows, except when the flow rate is 0.07 m3/h. For the 10 μm particles, one sees some amount of deposition when the flow rate is 0.14 m3/h, but the deposition is reduced significantly when the flow rate is 0.35 m3/h. Because of the large size of the 100 µm particles, nearly all of them deposit at the bottom, except when the flow rate is 1.05 m3/h and 3.5m3/h, as shown in Fig.6. The flow area decreases as the deposition increases, so the velocity distribution sees a subtle change. But small changes would affect the kcoefficient significantly when the flow rate is low, that is why the error of thek coefficient is over 1% when the flow rate is 0.07 m3/h and 0.14 m3/h.

Fig.7 Particle concentration on reflection path in heat meter body
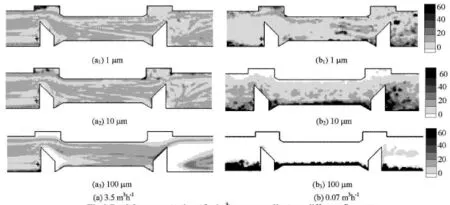
Fig.8 Particle concentrations on z-coordinate at different flow rates
3.2 Particle distribution on the ultrasonic reflection path
When the ultrasonic wave transmits in the heat meter, because of the existence of diffusion, absorption and scattering, the acoustic energy declines with the increase of the transmission distance, which is called the attenuation of the ultrasonic wave. The ultrasonic attenuation is mainly caused by the acoustic absorption of the medium, which means that the attenuation is due to the characteristics of the medium itself. The acoustic attenuation coefficient is a quantity describing the ultrasonic attenuation. The acoustic attenuation of the ultrasonic transmission in the particle two phase flow is related to the ultrasonic frequency. There are many other influence factors, including the particle size, the concentration, the material properties,the properties of the continuous media, and the temperature. Therefore, the study of the particle distribution on the ultrasonic reflection path is the foundation for the ultrasonic transmission in the meter.
The concentration of eighteen uniformly distributed points on the ultrasonic transmission path line is computed by Fluent. The relationships between the particle concentration and the flow rate for particles of different diameters are shown in the same coordinate. In order to study the particle distribution in the whole heat meter body, a contour graph of the z-coordinate face in the heat meter center is shown. From Fig.7, it is seen that:
(1) The particle distribution on a reflection path is like the wave, that is, the particle concentration is low near the reflection beams and high in the middle section with random fluctuations.
(2) When the diameter of the calcium carbonate particles is 1 μm and the instantaneous flow rate is 0.07 m3/h, the fluctuation extent of the concentration is the largest, which means that the particle distribution is very uneven. It can be seen from Fig.8 that some particles already begin to deposit. When the particle diameter is 10μm and the flow rate is 0.07m3/h and 0.14m3/h, the mass concentration on the propagation path changes greatly in scope and the difference between them is over 10 kg/m3. It is evident that the particle deposition becomes more and more significant.
(3) When the particle size is 100μm and the flow rate is 0.07 m3/h, 0.14 m3/h and 0.35 m3/h, the concentration on the reflection path is nearly zero, and almost all particles deposit on the bottom under the reflection path. While the flow rate is 3.50 m3/h, the particle concentration in the heat meter body is uniform except for the area near the transducer, where the liquid velocity is low and the capacity of carrying particles declines, and as a result, the particle concentration declines sharply.
The particle distribution properties depend both on the flow field characteristics and the nature of the particle itself. If they are made of the same material,the distribution mainly depends on the particle diameter[16]. The smaller the diameter, the better the features of following the liquid phase. When the particle diameter is 1 μm, its gravity force is small and can easily be carried by the liquid phase, so the turbulent fluctuation effects are large and the particle distribution is random. There, 1μm calcium carbonate particles can be at different positions in the heat meter body. Because of the restriction of the reflection beam and the decrease of the flow area influenced by the reducer,the velocity of the continuous phase increases and vortexes appear above the reflection beam, as shown in Fig.5(a1).
1 µm particles can follow the liquid movement under a small vortex strength, so the particle concentration increases at the vortex center and decreasesaround the vortex. The vortex cleans the reflection surface, which leads to the decrease of the particle concentration near the reflection beam, while the particle concentration increases above the reflection beam, as shown in Fig.8(a1). When the flow rate is 0.07 m3/h, as the velocity of the liquid and the particle injection velocity are small and the velocity decreases under the viscous force, a small amount of particles can not reach the exit but settle down on the bottom under the effect of gravity, as shown in Fig.8(b1). But for 10 µm particles, the influence of gravity gradually becomes outstanding. According to Eq.(6), the sedimentation velocity of particles increases, so the axial liquid velocity is increased to overcome the influence of gravity.
As shown in Fig.8(a2) and Fig.8(b2), 10 µm particle concentration in the 3.5 m3/h flow is higher than 0.07 m3/h. A certain amount of particles already deposit at the heat meter bottom when the flow rate is 0.07 m3/h. Because of a large variation of the velocity on the reflection path, the capabilities of liquid carrying particles in different positions are different, which induces a large fluctuation of the particle concentration on the reflection path. As for 100 µm particles,the effect of gravity increases further, the particles can almost entirely escape from exit only when the flow rate is 1.05 m3/h or 3.5m3/h, as seen from Fig.8(a3)and Fig.8(b3). Under the conditions of other flow rates,a large number of particles deposit on the bottom, as shown in Fig.6 and Fig.8.
4. Conclusions and a comparison with experiment
A discrete phase model is used to simulate the flow field and the particle distribution in the u-shaped ultrasonic heat meter body with three kinds of calcium carbonate suspensions, of the mass concentration of 1% and the particle diameters of 1 µm, 10 µm and 100 µm. Results show that 1μm particles have a good following behavior and a uniform distribution in the meter body. When the particle diameter is 100 µm, a great deal of deposition appears when the flow rate is below 0.35 m3/h. As for 10 μm calcium carbonate suspensions, when the flow rate is 0.07 m3/h and 0.14 m3/h, the velocity distribution of the continuous phase changes because of the deposition of the particle phase, which has a great effect on the k coefficient. The change of the kcoefficient goes more than 5% when the flow rate is 0.07 m3/h. In addition, the particle mass concentration has a large fluctuation on the ultrasonic transmission path, with a range above 10 kg/m3. So the time difference calculation deviation caused by the acoustic attenuation on the transmission path has a significant influence on the low flow rate measurement[15]. Thek coefficient deviation and the ultrasonic attenuation on the ultrasonic transmission path are the key factors which affect the measurement accuracy in the water containing impurities for the ultrasonic heat meter. The experiments by Shi et al.[15]on 10 μm calcium carbonate suspensions at different flow rates show that when the mass concentration is 1% the abnormal error appears at 0.07 m3/h and 0.14 m3/h and the relative error is more than 10% when the flow rate is 0.07 m3/h. In this paper, the simulation results explain the deviations of the experimental results and provide a theoretical basis for improving the ultrasonic heat meter measurement accuracy for water containing impurities.
[1] ZHAO H., PENG L. and STEPHANE S. A. et al. CFD aided investigation of multipath ultrasonic gas flow meter performance under complex flow profile[J]. IEEE Sensors Journal, 2014, 14(3): 897-907.
[2] LI Dong, YUAN Xiu-le and DU Guang-sheng et al. Analysis of the reflection device in ultrasonic flowmeter based on acoustic-structure coupling method[J]. Chinese Journal of Scientific Instrument, 2015, 36(9):1945-1952(in Chinese).
[3] ZHENG D., ZHANG P. and XU T. Study of acoustic transducer protrusion and recess effects on ultrasonic flowmeter measurement by numerical simulation[J]. Flow Measurement and Instrumentation, 2011, 22(5):488-493.
[4] ZHENG D., ZHANG P. and ZHANG T. et al. A method based on a novel flow pattern model for the flow adaptability study of ultrasonic flowmeter[J]. Flow Measurement and Instrumentation, 2013, 29: 25-31.
[5] WANG C., MENG T. and HU H. et al. Accuracy of the ultrasonic flow meter used in the hydroturbine intake penstock of the Three Gorges Power Station[J]. Flow Measurement and Instrumentation, 2012, 25: 32-39.
[6] XIAO Yang. Numerical analysis on dynamic flow characteristic of ultrasonic heat meter flow measurement with U type reflector[D]. Master Thesis, Xi'an,China: Chang'an University(in Chinese).
[7] TARPAGKOU R., PANTOKRATORAS A. CFD methodology for sedimentation tanks: The effect of secondary phase on fluid phase using DPM coupled calculations[J]. Applied Mathematical Modelling, 2013,37(5): 3478-3494.
[8] MEZHERICHER M., BROSH T. and LEVY A. Modeling of particle pneumatic conveying using DEM and DPM methods[J]. Particulate Science and Technology,2011, 29(2): 197-208.
[9] HSU C., WU S. and WU R. Particles separation and tracks in a hydrocyclone[J]. Tamkang Journal of Science and Engineering, 2011, 14(1): 65-70.
[10] XU Y., LIU M. and TANG C. Three-dimensional CFD-VOF-DPM simulations of effects of low-holdup particles on single-nozzle bubbling behavior in gas-liquid-solid systems[J]. Chemical Engineering Journal,2013, 222: 292-306.
[11] WANG Zhen-bo, ZHANG Yu-chun and XU Chunming. Numerical simulation of discrete particle distribution characteristics in mixing cavity of quick-contact cyclone reactor[J]. Chemical Engineering and Machinery, 2014, 41(3): 357-360+373(in Chinese).
[12] CHEN Ju-shi, WANG Yi and JIANG Zhong-an. Nume-rical simulation of blasting dust concentration distribution and diffusion regularities in stope[J]. Journal of China Coal Society, 2013, 38(A01): 147-152(in Chinese).
[13] LI Run-zhi. Simulation study on propagation law of diferent-amount deposited coal dust explosion induced by gas explosion[J]. Mining Safety and Environmental Protection, 2013, 40(1): 17-20, 25(in Chinese).
[14] NOORPOOR A., VAHIDI M. A. Numerical solution of the flow in the gas transfer system of an industrial unit[J]. Technical Journal of Engineering and Applied Sciences, 2013, 24: 3688-3694.
[15] SHI Shuo, LIU Zheng-gang and SUN Jian-ting et al. Study of errors in ultrasonic heat meter measurements caused by impurities of water based on ultrasonic attenuation[J]. Journal of Hydrodynamics, 2015, 27(1):141-149.
[16] CHE De-fu, Li Hui-xiong. Multiphase flow and application[M]. Xi'an, China: Xi'an Jiao Tong University Press, 2007, 131-263(in Chinese).
[17] LOVE A. I. J., GIDDINGS D. and POWER H. Numerical analysis of particle flows within a double expansion[J]. Powder Technology, 2014, 266: 22-37.
[18] DUANGKHAMCHAN W., RONSSE F. and DEPYPERE F. et al. CFD study of droplet atomisation using a binary nozzle in fluidised bed coating[J]. Chemical Engineering Science, 2012, 68(1): 555-566.
* Project supported by the National Natural Science Foundation of China (Grant No. 51276102).
Biography: SHI Shuo (1980-), Female,Ph. D. Candidate,
Associate Professor
DU Guang-sheng,E-mail: du@sdu.edu.cn
猜你喜欢
杂志排行

水动力学研究与进展 B辑的其它文章
- An effective method to predict oil recovery in high water cut stage*
- Impact of bridge pier on the stability of ice jam*
- Implicit large eddy simulation of unsteady cloud cavitation around a planeconvex hydrofoil*
- Prediction of ship-ship interactions in ports by a non-hydrostatic model*
- Flow hydrodynamics in embankment breach*
- The variations of suspended sediment concentration in Yangtze River Estuary*