生态与农业气象研究进展
2014-08-31
生态环境与农业气象
Ecological Environment and Agrometeorology
生态与农业气象研究进展
1 生态和农业气象基础理论与应用技术研究
1.1 高时空分辨率数据融合模型研究
本研究对基于MODIS产品(高时间分辨率、低空间分辨率)和Landsat卫星数据(高空间分辨率、低时间分辨率)光谱相似性、像元空间尺度和时间差异的数据融合模型STARFM进行如下改进:(1)将MODIS双向反射率数据校正为天顶方向,根据地表覆盖类型数据实现BRDF产品的缺测值填图;(2)利用滑动窗技术,计算得到MODIS和Landsat数据的最大相关系数,进而实现MODIS和Landsat数据的几何精度校正;在此基础上构建集成的数据融合模型框架(Integrated STARFM,ISTARFM),实现模型半自动化运行。该模型框架可以实现两类数据在时间分辨率和空间分辨率的向上融合,为高时频、精细化冬小麦区域干旱监测服务。(王培娟)
1.2 Landsat地表参数反演及空间尺度转换
利用LEDAPS(Landsat Ecosystem Disturbance Adaptive System)模型,将最新发射的Landsat8卫星数据的DN值转换为地表反射率,以地表反射率数据为基础,计算得到归一化植被指数(NDVI)、叶面积指数(LAI)和地表温度(LST)。反演30 m分辨率地表温度数据时,首先将Landsat8的30 m反射率数据进行降尺度转换到100 m,得到与热红外波段空间分辨率相同的地表反射率数据,建立地表反射率和地表温度的回归模型T-R (Temperature-Reflectance),而后利用该模型和30 m分辨率的地表反射率数据,实现地表温度的精细化空间尺度转换(图1)。(王培娟)
1.3 精细化逐日多层土壤墒情和灌溉预报系统研发
基于土壤水分、土壤质地、蒸散、遥感水分亏缺指数等数据集,通过像元匹配、误差分析和神经网络等方法,研究了土壤水分人工、自动、遥感监测等多资料融合技术。利用中国103个站1961—2010年逐日总辐射和日照时数资料,分析了a、b系数时空变化规律,确定了中国不同区域各年代a、b系数参考值。在前期冬小麦农田水量平衡简化模型和精细化逐日多层土壤墒情和灌溉预报模型研究基础上,构建了3个省级预报系统(试用版),并在2014年冬小麦主要生长季进行试用。进一步开发了基于数据管理、数据处理、土壤墒情预报、灌溉量预报、产品制作、效果检验6个模块的业务应用平台,并在河北省进行了初步本地化应用,发布服务产品3次。(毛飞)
1.4 夏玉米生理生态与生长特性对干旱过程的响应研究
夏玉米在七叶期灌水处理15天后发生轻旱,1个月后发生中旱,2个月后发生特旱。轻旱条件下,拔节期玉米叶片光合作用存在“午休”现象,顶部第一片展开叶光合速率、蒸腾速率、气孔导度和水分利用效率对干旱响应敏感,具有指示作用。全生育期内玉米叶片光合速率、蒸腾速率和气孔导度均随干旱发生发展呈下降趋势,叶片水分利用效率则呈上升趋势。叶片光合速率、蒸腾速率和气孔导度前期下降幅度较大,处理间差异显著,随干旱发展,土壤相对湿度差异减小,后期下降幅度减小,处理间差异也减小。叶片水分利用效率前期上升幅度较小,处理间差异也较小,干旱发展后期上升幅度较大,处理间差异也较大。夏玉米生育期内叶片含水率随干旱发生发展呈线性下降趋势,并与土壤相对湿度显著相关,可表征玉米的受旱程度。随着干旱的发生发展,玉米光合限制因素由气孔限制向非气孔限制转换,干旱强度越大、持续时间越长,叶片光合限制因素转换时间越早,且转换发生时叶片含水率越高。夏玉米茎含水率在拔节期达到最大值(93%左右),茎含水率对土壤水分胁迫的响应没有叶片含水率灵敏。土壤相对湿度较高处理的叶面积指数在抽雄期达到最大,土壤相对湿度较低处理的叶面积指数在灌浆期达到最大。比叶面积前期呈迅速下降趋势,后期维持稳定并略有下降趋势;比叶重在开花期前呈明显上升趋势,开花期后呈稳定并略有上升趋势,比叶重在生长末期显著高于生长初期。夏玉米地上生物量累积对土壤水分变化反应灵敏,玉米各生育期的生物量干重均随土壤相对湿度的下降而减少。拔节期和抽雄期干旱造成的夏玉米地上生物量增幅明显下降。干旱条件下夏玉米地上生物量平均每天增幅速率在1.15~1.74 g/d之间,增幅速率随土壤相对湿度的下降而下降(图2)。(周广胜)
2 农业气象防灾减灾技术研究
2.1 基于TIGGE和分布式水文模型的农业干旱预警
采用全球三大TIGGE数据归档中心(中国气象局、欧洲中期天气预报中心和美国国家环境预报中心)的TIGGE资料,基于NOAH_LSM对TIGEE资料进行动力降尺度、神经网络ANN、TOPMODEL和新安江水文模型构建了新的水文模型XXT。研究把土壤蓄水容量曲线和地下水水位线紧密关联,形成新的蓄水容量曲线概念,并与TOPMODEL土壤分层结构及地下产流方程结合,提取了新产流方程和新的水量平衡方程,在此基础上构建了新型降雨-径流模型——XXT。虽然,此时的XXT模型通过大量试验验证了其比传统的TOPMODEL和新安江水文模型性能优越,但由于该模型的本质是基于物理过程的模型,所以在预测精度上仍然比经典的基于人工智能技术的统计模型(如神经网络,支持向量机等)要差。为了提高其模拟精度,我们首次将神经网络模块嵌入到XXT模型的产流方案中,这与传统方法显著不同,因为传统方法是将神经网络模块集成到基于物理过程的水文模型的汇流方案中。(赵俊芳)
2.2 冬小麦干旱预测预警模式研发
在山东农业大学国家重点实验室试验站利用美国Li-COR公司生产的Li-6400便携式光合作用测定系统测定了干旱条件下作物光合生理生态参数变化情况,用英国Hansatech公司生产的FMS-II脉冲式调制荧光测定仪测定了叶片叶绿素荧光参数。研究表明:随着干旱胁迫的加剧,фPSII呈现出明显的下降趋势,表明严重干旱胁迫时,叶片PSII的实际量子效率的影响显著,Fv/Fm与Fv/F0均与фPSII一致;随着干旱胁迫程度加剧呈持续降低,或呈现降低—升高—降低趋势,表明夏玉米在经受适度水分胁迫时,可以作出一定的适应性调节反应,其调节程度与品种有关。基此,将农业干旱识别模式中的相关模块进行了相应改进,在此基础上利用C++与Fortran混合编程技术,建立起了适用于我国山东、河北及河南3省的农业干旱预测预警模式,小麦干旱综合预测预警准确率达到85%以上。(刘建栋)
2.3 华南地区龙眼寒害时空分布规律及演变趋势
基于华南4省(福建、广东、广西、海南)64个气象站点1961—2012年逐日资料,根据《龙眼寒害等级标准》,选取影响龙眼寒害的主要影响因子,计算龙眼寒害指数,确定各级别寒害的发生频率;通过对龙眼寒害指数矩阵、主要发生月份(11月至次年3月)寒害指数矩阵的经验正交分解(EOF),提取第一时间分量,分析了近52年华南龙眼寒害时空分布特征。结果表明:受气候变暖影响,华南地区平均积寒随年代呈减少趋势,有利于龙眼寒害的减少;时间分布特征为1—2月为寒害发生频率最高的月份,体现了年寒害分布的主要特征,是年寒害发生的最主要时段,但发生频率随年代呈现明显减少趋势。11—12月和3月不是年寒害发生的主要时段,发生频率相对低,但个别年份仍有可能出现较重寒害;龙眼寒害空间分布呈明显纬向分布,寒害发生频率由南至北增加,寒害还与地理位置有关,发生频率由沿海至内陆增加,研究结果与历史记载情况基本一致。对闽东地区龙眼寒害风险分析表明,1981—2010年闽东沿海龙眼寒害发生概率较大(0.42~0.43),风险概率为0.10~0.16。(赵俊芳)
2.4 西南地区农业与水稻洪涝灾害发生等级评价指标构建
针对西南地区农业与水稻洪涝灾害监测预警的需求,基于西南农业区341个气象站1961—2010年的逐日降水量、分省农业洪涝灾情、分县水稻产量等资料,以重庆市单站洪涝等级指标(过程降水量)为原型,通过对原型指标中不同等级洪涝的降水量临界值进行幅度为-50~+50 mm、步长为1 mm的增减,得到各单站共101个洪涝指标,在此基础上,分别构建单站、分省逐年洪涝指数以及平均每站分省逐年洪涝指数,采用灰色关联度方法确定不同等级洪涝对实际灾情的影响权重,综合考虑由101个洪涝指标计算得到的洪涝指数与农业洪涝实际受灾程度的相关性、指标与历史洪涝灾害记录的吻合性以及分省指标的可比性,优选构建了分省农业洪涝等级指标。基于分县水稻减产率与洪涝指数、洪涝过程日数、过程降水量,构建了水稻洪涝等级指标。依据构建的指标,揭示了西南地区农业与水稻洪涝灾害的时空分布特征。近50年云南、贵州、四川、重庆农业洪涝发生较严重的年代分别为20世纪80年代、20世纪90年代、20世纪80年代和21世纪初。近50年洪涝的多发区分别位于云南西南和东南部、贵州西南部和四川盆地的西部和东北部。一季稻洪涝危险性指数高值区主要位于四川中北部、云南南部以及贵州西南部(图3)。(霍治国)
2.5 重大病虫害发生的气候背景指示指标与长期预测、动态预警模型优化
针对重大病虫害(小麦白粉病、稻飞虱)发生气象条件监测、预警与评价的业务应用需求,基于1971—2010年病虫害发生面积、发生程度、74项大气环流特征量、北太平洋海温场格点资料,采用因子膨化、空间拓扑分析、最优化处理、因子独立性检验等方法,补充构建了全国小麦白粉病发生面积率等级的大气环流、北太平洋海温指示指标;经验证检验,指示因子对小麦白粉病发生流行等级指示效果较好。补充研发了全国稻飞虱发生程度、小麦白粉病发生面积率等级的大气环流预测模型、北太平洋海温预测模型,对应的模型等级预测正确率分别为97.5%、82.5%、82.5%、80%。补充研发了基于fisher判别分析的广西桂林地区稻飞虱发生程度等级、河北地区小麦白粉病发生程度等级的动态预警模型,桂林地区稻飞虱发生程度等级的回代检验、预测检验基本一致,准确率分别为84.6%、88.2%,河北地区小麦白粉病发生程度等级回代检验、预测检验基本一致,准确率分别为97.8%、95.0%。(霍治国)
2.6 南方双季稻低温灾害时空分布特征及风险分析
针对中国南方双季稻区早稻播种移栽期低温灾害、晚稻抽穗扬花期寒露风灾害,基于169个气象站1981—2010年的逐日平均气温资料、气象行业标准规定的双季稻低温灾害等级指标,综合考虑不同低温灾害等级及其出现的风险概率,构建了低温灾害综合风险指数,揭示了双季稻不同低温灾害等级发生次数的时空变化以及等级风险和综合风险的地理分布特征。近30年南方早稻低温灾害、晚稻寒露风(粳稻、籼稻)轻、中、重度发生次数以及总次数总体均呈减少趋势,但部分区域呈增加趋势,按灾害呈增加趋势覆盖面积的大小依次为粳稻寒露风、早稻低温灾害和籼稻寒露风。中重度灾害风险高值区:早稻低温灾害主要位于湖南、江西、福建3省的部分地区,发生概率中度为20%~40%、重度在10%以下;粳稻寒露风主要位于云南种植区中部、陕西种植区、四川成都西部以及四川种植区东北部等地,发生概率中度为20%~30%、重度为20%~45%;籼稻寒露风主要位于云南、湖南、安徽、陕西、四川的部分地区,发生概率中度为20%~40%,重度为50%~95%(图4)。(霍治国)
2.7 华南荔枝寒害风险评估
构建了包括灾害危险性、承灾体暴露性和脆弱性3个方面的华南荔枝寒害风险动态评估指标体系。致灾因子及孕灾环境的危险性由灾害强度乘以其月或年发生的频率确定。寒害强度即由最大降温幅度、极端最低气温、日最低气温≤5.0 ℃的持续日数、日最低气温≤5.0 ℃的积寒等要素构造的综合寒害指数,分为极重、重度、中度、轻度和无寒害5个等级。承灾体的脆弱性由荔枝减产(相对气象产量)等级与其发生频率之积确定,减产等级分为4级。承灾体的暴露性根据荔枝收获面积与耕地面积的比值确定。运用自然灾害风险指数法(风险指数=危险性×暴露性×脆弱性)构建了华南荔枝寒害的月或年风险评估模型。据此模型对广东和海南省的荔枝进行逐月或年的寒害风险区划。结果表明,广东荔枝从11月开始即有发生寒害的中度风险,至12月、1月及2月发展为较高风险及以上。其中,广宁、高要到台山一线为寒害的高风险区。另外,年度寒害风险区较月的范围有所扩大。海南荔枝月的寒害风险在中度及以下,而年的风险级别达到了较高(图5)。(马玉平)
2.8 重大农业气象灾害立体监测与动态评估技术研究
针对西南地区农业干旱、南方双季稻低温和黄淮海小麦干热风灾害,取得了以下几个方面的研究成果。完善了灾害立体监测指标。建立了以遥感植被指数为指标的遥感监测大面积干热风灾害的方法。建立了基于干热风危害指数的黄淮海地区冬小麦干热风灾损评估模型。采用经验指标模型或将指标嵌入ORYZA2000模型作为水稻低温冷害的动态评估方法,并可以从站点和区域尺度进行灾害的动态评估。站点尺度的评估紧跟水稻生长过程,监测到低温影响后,及时作出冷害评估,提供定量的冷害评估结果。区域评估以遥感反演信息作为数据源代入指标模型或作物模型中计算或更正评估结果,并以MODIS为例,探索了低温造成生育期延迟的评估方法。对于西南作物干旱,建立了基于干旱累积指数(DI)的产量损失评估模型和基于WOFOST模型的干旱影响作物评估模型。在前期研究成果的基础上,初步完成了黄淮海干热风和西南作物干旱省级灾害监测与评估业务平台。(赵艳霞)
2.9 华北冬小麦灌浆期高温热害指标研究
在冬小麦灌浆中后期,短期(3天、6天或9天)高温胁迫导致灌浆速率下降、灌浆持续时间缩短,千粒重与高温胁迫期间午间平均冠层气温呈显著性的负线性相关关系。通过对千粒重数据进行标准化处理,得到了不同年型间表现一致的千粒重相对值与高温特征值的关系,并据此提出了冬小麦灌浆中后期短期高温热害的温度指标。由3年不同长度的短期高温胁迫试验结果提炼出了一个反映灌浆中后期全阶段高温热害当量的特征量-高温有效度时,并得出适应于不同年型的千粒重相对值与高温有效度时的统计相关关系,并由此给出了不同减产程度的致灾高温积热指标。(谭凯炎)
2.10 长江中下游地区双季早稻冷害、热害风险识别技术
以长江中下游地区48个站点1961—2012年的气象资料为基础,利用统计分析、Mann-Kendall和小波分析的方法研究早稻生长季前期冷害、后期冷害、后期热害的时空变化。结果表明:近52年来早稻生长季气温呈极显著升高趋势(>0.5 ℃/10a);前期冷害和后期冷害均从21世纪初开始出现减弱趋势,前期冷害变化存在2~4年的短周期,后期冷害变化存在2~4年和4~6年2个周期;后期热害从21世纪初开始有显著增强趋势,无明显周期特征;空间分布上,前期冷害高风险区基本与山脉地形特征相吻合而后期冷害与水系的分布相关性很高。全球变暖背景下长江中下游地区低温灾害减弱、高温灾害增强。(王春乙)
2.11 东北地区玉米主要气象灾害风险评价
利用东北地区35个农业气象站1961—2010年气象资料、1981—2010年玉米发育期资料、1961—2010年产量面积资料、近50年东北3省的灾情资料以及近10年东北3省各县的社会经济统计资料,以玉米出苗-抽雄、抽雄-成熟两个生长阶段里发生的干旱及冷害为研究对象,基于水分亏缺指数和热量指数分别建立了干旱指标和冷害指标,对东北地区玉米干旱、冷害进行风险分析。建立了包括危险性、脆弱性、暴露性和防灾减灾能力4个方面的东北地区玉米干旱、冷害风险评价模型,指出危险性和防灾减灾能力是风险评价模型中最重要的2个影响因子。给出了东北地区玉米干旱、冷害高风险值区位于黑龙江西南部和东北部,以及辽宁西部建平县一带,风险指标值在0.8以上;吉林西北部、东南部、辽宁东北部为次高值区,风险指标值在0.6~0.7之间;低值区位于辽宁中南部及辽东半岛,风险值在0.3左右。(王春乙)
3 农业应对气候变化研究
3.1 全球变化影响下主要作物的脆弱性及评价指标
研究表明,显著增温对春小麦生育期和关键发育期的影响是气候变化背景下春小麦产量脆弱性的主要原因。春小麦生育阶段气温升高,使拔节期、抽穗期、开花期和成熟期显著提前,从而使春小麦生育期显著缩短。然而,播种期调制、耕作方式改变和新品种引入等适应性措施的不断实施,弥补了由于生育期缩短和发育期变化等对小麦产量的可能影响。统计分析表明,由于增温趋势和适应性措施实施水平的区域性差异影响,增温对春小麦生育期缩短和发育期变化的贡献率在23%~68%,平均达到40.3%;每增温1 ℃,生育期可能缩短6~7天,产量可能减少522 kg/hm2。另外,应该清晰地认识到,人类的适应性措施伴随气候变化而持续实施,到目前为止的作物生育期和发育期变化是气候变化和人类适应气候变化的共同结果。(俄有浩)
3.2 东北玉米生产对气候变化的响应与适应
进一步细化了作物发育期,以平均资源适宜指数(Isr)、平均效能适宜指数(Ise)和平均资源利用指数(K)作为评价指标,评价了近50年东北地区玉米气候资源的适宜情况和利用率。从年际、潜在生长季和作物生长期3个时间尺度方面,确定影响春玉米生长发育的关键气象因子,分析了近30年来东北春玉米关键发育期的变化特征和演变趋势,构建了玉米生长期对气候变化的响应关系模型,探讨了春玉米发育期对不同时间尺度气象因子的响应规律。提出了分离东北玉米气候产量的最优方法,分离出气候变化对东北春玉米产量的影响,确定了影响东北春玉米气候产量的关键气象因子,建立了反映不同地区气象因子和春玉米气候产量关系的区域模型。(赵俊芳)
3.3 大气CO2 浓度升高和增温影响作物需水量变化机理研究
利用开顶式生长箱(OTC)与大田试验,对比研究了增温和CO2浓度升高对冬小麦需水量的影响。结果表明,冬小麦生长期间(2013年10月11日至2014年6月10日),日平均增温3.1 ℃,并且日平均施加CO2浓度到760×10-6,冬小麦生育期缩短17天(7%)。日均耗水量增加0.7 mm(OTC日均2.7 mm,大田日均2.0 mm),全生育期增加需水量123.5 mm(25.5%)。另外,利用半封闭OTC(无CO2施加)与大田对比试验表明,半封闭式OTC比大田日平均增温0.7 ℃,冬小麦生育期缩短7天,日均耗水量增加0.65 mm,全生育期增加需水量138.8 mm(28.7%),与封闭式OTC中日均耗水量和全生育期增加的需水量接近。出现这种情况的原因可能有两方面:一是虽然封闭式OTC增温幅度明显大于半封闭式OTC,但是封闭环境下空气流动性比半封闭环境下差,不利于水汽流动,导致封闭式OTC中蒸散量较小;二是许多文献资料提到增加CO2浓度能够减少蒸散量,增加水分利用效率。由于该试验观测结果是增温和CO2浓度增加的综合表现,无法分离各自作用对需水量的影响及贡献,因此,还需要进一步试验观测和分析。(俄有浩)
3.4 增温和CO2增加对华北主要作物产量影响的试验研究
偏冷年的增温将促进小麦的分蘖,有效穗数显著增加,籽粒产量较对照大幅度增加;偏暖年的增温也显著促进冬小麦有效穗数和穗粒数增加,尽管使得千粒重显著降低,但并未导致产量下降。OTC小麦增温+CO2的试验也得出,增温+CO2对产量没有产生影响,与单纯CO2增加试验不同,即没有预期的CO2施肥效应在小麦增温+CO2中表现出增产的结果。玉米大田增温试验得出:增温可能降低玉米产量,可能与玉米生长期处于夏季高温期,如再升温就可能超出玉米适应高温的能力有关。预期的CO2施肥效应在玉米增温+CO2中表现出增产的效应(图6)。(房世波)
3.5 近30年东北春玉米发育期对气候变化的响应
基于1981—2010年东北地区55个农业气象观测站发育期数据、16个气象站逐日气象资料,采用趋势变率、秩相关分析、主成分分析和结构方程模型等方法,分析了近30年东北春玉米关键发育期的变化特征,探讨了春玉米发育期对不同时间尺度气象因子的响应规律。结果表明,1981—2010年春玉米关键发育期(播种期、抽雄期、成熟期)均有延后趋势,大部分地区春玉米生长前期(播种期-抽雄期)日数减少,生长后期(抽雄期-成熟期)日数增加,全生育期日数增加。在绝大多数年份,春玉米播种期在温度适播期之后,成熟期在初霜日之前。近30年对东北春玉米生育期日数影响最大的气象要素为温度,主成分分析结果显示,年际尺度的升温、温度生长期的延长和作物生长期的高温对生育期日数影响显著;结构方程模型指出,作物生长期的最高温度和最低温度对生育期日数影响有间接效应,主导气象要素能够解释生育期日数变异的44%。全球变暖背景下,东北春玉米发育期变化是作物响应气候变化和农业生产适应气候变化的共同结果。(郭建平)
3.6 气候变化和科技进步对中国玉米产量影响的定量评估
农作物产量受气候变化和科技进步的共同影响,客观和定量评价气候变化和科技进步对农作物产量的影响有利于保障农业的可持续发展。本研究利用农业生态区域法计算了作物光合生产潜力、光温生产潜力和气候生产潜力,并结合主要作物主产省实际产量变化趋势,系统分析了近50年来不同气候资源要素变化对作物气候生产潜力的影响,分析了近30年来气候变化和科技进步对主要作物产量的影响。研究结果表明:近50年辐射减少对我国主要农作物产生了显著的不利影响;近50年温度升高对玉米和双季稻有不利影响,但对小麦有正效应;近50年降水变化对农作物的影响地区间有显著差异,对不同作物也有差异,但以正效应为主;近30年气候变化对农作物产量均以负面影响为主,农业增产主要是科技进步的贡献。如果没有气候变化的不利影响,我国粮食作物的实际增产幅度可能比现在更大。(郭建平)
3.7 东北种植制度变化下作物气候生产潜力和气候资源利用效率分析
利用已有的种植制度界限指标体系,综合考虑水、热资源对东北地区农业种植制度的影响,分析了种植制度界限变化敏感区作物气候生产潜力和气候资源利用效率的变化。结果表明:随着未来气候变化,综合考虑热量和降水资源,东北一年两熟的北界明显的北移东扩,2071—2100年黑龙江哈尔滨附近的小部分区域可以实现一年两熟,而黑龙江西南地区由于水资源的缺乏,仍只适宜一熟制作物种植;由于高温胁迫,研究区域内春玉米气候生产潜力会随时间下降,种植模式的调整是提高气候生产潜力的一种有效方式。但在热量相对较高的地区,过高的温度导致冬小麦、夏玉米生育期的缩短,冬小麦与夏玉米两熟模式下的气候生产潜力总和也会降低,但仍然高于一熟种植方式;随着气候变暖,积温相应增加,一熟制种植方式出现了资源浪费的现象。改一熟为两熟,延长了作物的生长季节,可以很好地利用气候资源,有利于提高农业气候资源利用效率。(郭建平)

图1 Landsat8数据地表参数反演结果(a:归一化植被指数(NDVI);b:叶面积指数(LAI);c:地表温度(LST))Fig. 1 Inversion maps of Landsat8 surface parameters (a: NDVI; b: LAI; c: LST)

图2 玉米全生育期叶片光合作用限制因素Fig. 2 Factors limiting leaf photosynthesis of summer maize during growing season

图3 1961—2010年中国西南地区农业洪涝平均次数Fig. 3 Average agricultural f ood frequency in Southwest China during 1960–2010
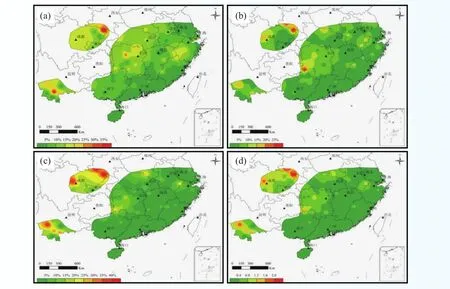
图4 南方地区晚稻(粳)寒露风风险概率及综合风险指数地理分布(a:轻度寒露风;b:中度寒露风;c:重度寒露风;d:寒露风风险指数)Fig. 4 Geographical distribution of risk probability of each-level cold dew wind to japonica rice during 1981 to 2010 (a: the occurring probability of mild cold dew wind; b: the occurring probability of medium cold dew wind; c: the occurring probability of severe cold dew wind; d: risk index of cold dew wind)

图5 广东和海南省荔枝月及年寒害风险区划Fig. 5 The monthly or annual risk zoning of litchi chilling injury in Guangdong and Hainan provinces

图6 单独增温和增温+CO2复合对玉米产量影响的差异Fig. 6 The different effects between warming treatments and warming conbined CO2 enrichment
Research Progress in Ecology and Agrometeorology
1 Ecological and agrometeorological theories and application techniques
1.1 A study on data fusion model for high temporal and spatial resolution remote sensing data
The Spatial and Temporal Adaptive Ref ectance Fusion Model (STARFM) was used to blend Landsat and MODIS surface ref ectance based on their spectral similarities and spatio-temporal differences. An operational data fusion framework was built by integrating STARFM (referred to as ISTARFM hereinafter). Compared with STARFM, several improvements have been incorporated in the ISTARFM. These include: (1) viewing angular correction on the MODIS daily bidirectional ref ectance to get daily NBAR (Nadir BRDF (Bidirectional Reflectance Distribution Function) - Adjusted Reflectance), and filling gap values in BRDF products with BRDF lookup table obtained from MODIS International Geosphere-Biosphere (IGBP) land cover and MODIS BRDF products, (2) precise and automated co-registration on MODIS and Landsat paired images by looking for maximum correlation coeff cient with the moving-window technique. The ISTARFM provides a feasible and cost-effective way to build dense time-series surface ref ectance at Landsat spatial resolution, which can serve as regional drought monitoring for winter wheat precisely at high spatial and temporal resolutions with remote sensing images. (Wang Peijuan)
1.2 Landsat surface parameters inversion and spatial down-scaling
Digital number (DN) was converted to surface reflectance based on LEDAPS (Landsat Ecosystem Disturbance Adaptive System) model for Landsat8. And then several surface parameters were inverted using surface reflectance at their own spatial resolution, which include normalized difference vegetation index (NDVI) at 30 m resolution, leaf area index (LAI) at 30 m resolution, and land surface temperature (LST) at 100 m resolution. A Temperature-Ref ectance (T-R) model was developed with LST and down-scaled surface ref ectance at 100 m resolution. Therefore, LST can be down-scaled spatially based on T-R model and surface ref ectance at 30 m resolution to get LST at 30 m resolution (Fig. 1). (Wang Peijuan)
1.3 Research on and development of f ne daily multi-layer soil moisture and irrigation forecasting system for winter wheat
Based on data sets of soil moisture, soil texture, evapotranspiration, water def cit indices of remote sensing and so on, the fusion technologies of soil moisture observation data by manual, automatic and remote sensing were studied with the methods of pixel matching, error analysis, neural network and others. Using daily total radiation and sunshine time data in 103 stations from 1961 to 2010 in China, the spatial and temporal distribution of the a coeff cients and b coeff cients were analyzed and the a coeff cients and b coefficients for each age (ten years) in every region of China were given. Based on earlier stage research on the simplified models of water balance and daily multi-layer soil moisture and irrigation forecast models for winter wheat, three provincial forecasting systems (probation) were established, and tried in main winter wheat growth period in 2014. The operational application platform based on six modules of data management, data processing, soil moisture forecasting, irrigation quantity forecasting, product making and results testing was developed and tried in Hebei Province preliminarily. Three service products were issued. (Mao Fei)
1.4 Study on responses of summer maize ecophysiological and growth characteristics to drought process
During the manipulation experiment of summer maize drought occurrence and development, light drought occurred after 15 days of water control, and moderate drought happened one month later, extreme drought appeared two months later. The midday depression phenomenon of leaf photosynthesis occurred during the jointing stage under the conditions of light drought. The photosynthetic rate, transpiration rate, stomatal conductance and water use eff ciency of the f rst maize leaf were sensitive to drought, implying they were able to be indicative indices. The photosynthetic rate, transpiration rate and stomatal conductance of maize leaves during growing season decreased signif cantly with the decrease of soil relative moisture. The difference of all these parameters between water treatments declined with the development of consecutive drought. The water use eff ciency showed a rising trend and its difference between water treatments was small at earlier stage, but enlarged at later stage with the aggravation of consecutive drought. The leaf water content decreased linearly with the drought occurrence and development during growing season and it was signif cantly correlated with soil relative moisture, implying that the leaf water content is able to be an index of crop drought. The limiting factor of maize photosynthesis was a conversion process from stomatal limitation to non-stomatal limitation during growing season. The occurrence time of the conversion process was in correspondence with drought intensity and duration. The leaf SPAD value was not as sensitive as the photosynthetic rate to drought, which ref ected its hysteretic nature. Electron transfer rate, photochemical quenching coeff cient and photochemical efficiency decreased significantly from filling stage to milk stage. The summer maize stem water content reached the maximum at jointing stage (about 93%) and it was not as sensitive as leaf water content to drought. The leaf area index reached the maximum at tasseling stage for the treatment under higher soil relative moisture, while for the treatment under lower soil relative moisture it reached the maximum at f lling stage. The specific leaf area declined rapidly in the early stage, while it showed a stable trend. The specific leaf weight showed an opposite trend, and it was signif cantly higher in the late stage than in the early stage. The summer maize aboveground biomass was sensitive to soil water content, and it decreased with the decrease of soil relative moisture at all stages. The reduction caused by drought at jointing and tasseling stages was obvious. The average daily increase of summer maize aboveground biomass was between 1.15 g to 1.74 g, and the increase rate declined with the decrease of soil relative moisture (Fig. 2). (Zhou Guangsheng)
2 Agrometeorological disaster prevention and mitigation
2.1 Agricultural drought warning based on TIGGE and distributed hydrological model
In this study, three global ensemble weather prediction systems from the China Meteorological Administration (CMA), the European Centre for Medium-Range Weather Forecasts (ECMWF), and the US National Centers for Environmental Prediction (NCEP) in THORPEX (The Observing System Research and Predictability Experiment) Interactive Grand Global Ensemble (TIGGE) archive were used. A new distributed hydrological model XXT was built based on TIGEE dynamical downscaling through NOAH_LSM, neural network ANN, TOPMODEL and Xin,anjiang hydrological models. It was based on the soil moisture storage capacity distribution curve (SMSCC), some essential modules of the Xin,anjiang model, together with the simple model framework of the TOPMODEL (a topography based hydrological model). The innovation of XXT was that the water table was incorporated into SMSCC to connect the surface runoff production with base f ow production. This improved the description of the dynamically varying saturated areas that produced runoff and also captured the physical underground water level. XXT was tested and found to have better performance against the TOPMODEL and the Xin,anjiang model. However, due to the fact that XXT model was based on physical processes, the prediction accuracy was still poorer than the classical statistical model which was based on artif cial intelligence techniques (such as neural networks, support vector machines, etc.). In order to improve its simulation accuracy, we f rstly embedded neural network module in the runoff program of XXT model, which was signif cantly different from the conventional method. Because the traditional method was that the neural network module was integrated into the scheme of hydrological model with physical processes. (Zhao Junfang)
2.2 Development of the agro-drought prediction model for the winter wheat in North China Plain
Variation of the physiological parameters of the winter wheat under drought conditions, including photosynthesis rate of the winter wheat leaves etc., was measured with Li-6400 portable photosynthesis analyzers in the National Key Laboratory of Shandong Agricultural University. Green f uorescence parameters of the leaves were also determined with FMS-II pulse modulated f uorescence detector. The results indicat that фPSII deceased obviously with the evolution of the drought in the f eld, which means that the real quantum efficiency of PSII would be seriously effected under severe drought conditions. Variations of the Fv/Fm and Fv/F0 agreed quite well with that of the фPSII. All of the parameters would decrease steadily with the development of the drought, or fluctuate like a wave of deceasing-increasing-decreasing. These variations indicat that the crop can somewhat regulate itself to adapt to the consecutive drought conditions. However, the adaptability changes with varieties. Based on these achievements mentioned above, the researchers have successfully improved some of the related modules in the agro-drought prediction model. An agro-drought prediction model was also established by using the hybrid programming technology of C++and Fortran, with comprehensive prediction accuracy as high as 85%. The model is quite suitable for agro-drought prediction in Shandong, Hebei and Henan provinces in North China Plain. (Liu Jiandong)
2.3 Spatial and temporal distribution characteristics of longan caused by chilling injury in South China
According to the meteorological service standards “Grade of Chilling Injury to Dimocarpus Longan Trees” (QX/T168-2012), the main inf uencing factors of chilling injury in longan production were selected, and the chilling injury indexes (Hi) of longan in the 64 stations in four provinces of South China from 1961 to 2012 were calculated. The occurrence frequencies of each level of chilling injury were determined. Based on the empirical orthogonal function (EOF), the matrix of longan chilling injury indexes of 52 years, and the matrix of chilling injury indexes in main months (November-March) were analyzed, while the f rst time components of the above matrix were extracted. The results show that under climate warming, the average accumulated harmful temperature (<5 ℃) presented a signif cant decreasing trend along with decadal time in South China, and it was helpful to reduce disaster of chilling injury. Changes in temporal characteristics of chilling injury indicated the highest frequency was found in January and February, ref ecting the main distribution features of chilling injury. These two months were the most important period of chilling injury occurring in a year. November–December and March were not the main period for chilling injury, with a relatively low frequency. But in some years, it might still experience severe chilling injury. Spatial distributions of chilling injury presented obvious latitudinal distribution. The occurrence frequency of chilling injury increased from south to north and from coast to inland areas, which was related to geographic location. A comparative analysis of the historical records indicated that the spatial and temporal distributions of chilling injury could reflect the main actual characteristics of historical record. The frequency of chilling injury from 1981 to 2010 in the eastern coastal Fujian was high (0.42–0.43), with the risk probability standing at 0.10–0.16. (Zhao Junfang)
2.4 The evaluation indicators of agricultural and rice f ooding level
For the demand of agricultural and rice f ood monitoring and early warning in Southwest China, the single station f ood indicators, provincial f ood indicators year by year and provincial f ood indicators year by year in each station have been developed based on daily precipitation data, agricultural f ood disaster information and the rice yield by county from 341 weather stations in southwest agricultural areas from 1961 to 2010. In the progress of building the indicators, flood indicators of Chongqing as the prototype, through increasing and decreasing precipitation threshold by the amplitude which was -50~+50 mm and step size was 1 mm, 101 groups of flood indicators were obtained in each province. Agricultural flood level indicators of each province were constructed which used grey correlation method to determine weights of different levels of f ood impact on actual situation, comprehensive consideration of correlation between f ood intensity calculated by 101 indicators and crop flood real seriousness, coincidence between indicators and historical flood records and comparability of indicators of each province. Rice f ood level indicators were constructed based on yield reduction rate of each county and f ood index, days of f ood disaster process and process rainfall. According to the f ood level indicators, temporal-spatial distribution features of f ood disaster in southwest agricultural areas were revealed. The ages in which f ood disaster appears very serious are 1980s in Yunnan, 1990s in Guizhou and 1980s and 2000s in Sichuan and Chongqing in recent 50 years. The areas in which flood frequently occurred are located in southwest and southeast of Yunnan, southwest of Guizhou and west and northeast of Sichuan basin in recent 50 years. Regions of high value f ood dangerous index of single-season rice are mainly located in northern and central Sichuan, south of Yunnan and southwest of Guizhou (Fig. 3). (Huo Zhiguo)
2.5 The climate background indicator of major pests diseases occurrence and long-term prediction, dynamic early warning model optimization
For operational application needs of major pests diseases (powdery mildew, planthoppers) occurrence weather conditions monitoring, early warning and assessment, data on the national occurrence area and degree of rice planthopper and wheat powdery mildew from 1971 to 2010, 74 kinds of atmospheric circulation characteristics from 1970 to 2010, and North Pacif c SST data from 1969 to 2010 were reveiwed. Atmospheric circulation and North Pacific SST data level indicators of rice planthopper and wheat powdery mildew occurrence area level were also used including factor puffing, topological analysis, optimization process, and factor independence test. After the test, indication factor method showed a better result for the powdery mildew of occurrence epidemic level. The whole nation rice planthopper occurrence degree model, the rice planthopper occurrence rate of atmospheric circulation model and North Pacif c SST model were established, the accuracy of which are 97.5%, 82.5%, 82.5% and 80%, respectively. Early dynamic warning models were developed based on f sher discriminant analysis of rice planthopper occurrence degree in Guangxi Guilin and wheat powdery mildew in Hebei. The level evaluation accuracy of rice planthopper model in Guilin is 84.6%, while the prediction accuracy is 88.2%. The level evaluation accuracy of wheat powdery mildew model in Hebei achieves 97.8%, while the prediction accuracy is 95.0%. (Huo Zhiguo)
2.6 Low temperature disaster temporal/spatial distribution characteristics of double cropping rice in southern China and its risk analysis
For cold damage in early rice seeding transplanting period and cold dew wind damage of late rice in heading f owering stage in double cropping rice areas in southern China, the risk index of cold temperature damage was established which was based on the community standard and the data of daily average temperature from 169 weather stations during 1981–2010. It revealed the characteristics of geographical distribution of the occurrence probability and integrated risk index for double cropping rice from different low temperature disasters by level. In recent 30 years, the cold damage of early rice in southern China, the frequency of light, moderate and severe occurrence of late rice cold dew wind (japonica rice and indica rice), and the number of total occurrences showed a decreasing trend. But some regions showed an increasing trend. According to the disasters showing an increasing trend in terms of coverage, they are japonica cold dew wind, cold rice disasters and indica cold dew wind. High value areas of moderate to severe disaster risk: Cold damage of early rice mainly in parts of Hunan, Jiangxi and Fujian provinces, moderate probability of 20% to 40%, severe below 10%. Japonica rice cold dew wind is mainly located in the middle of Yunna, Shaanxi planting area, western Sichuan and Chengdu, and in northeastern of Sichuan growing areas, where the moderate probability of occurrence is 20% to 30%, and the severe probability of occurrence is 20% to 45%. Indica rice cold dew wind is located in parts of Yunnan, Hunan, Anhui, Shaanxi and Sichuan, where the moderate of occurrence is 20% to 40%, and the severe probability of occurrence is 50% to 95% (Fig. 4). (Huo Zhiguo)
2.7 Risk assessment of litchi chilling injury in South China
The risk evaluation index system of litchi chilling injury was f rstly constructed, which included risk of disasters, exposure and vulnerability of litchi in South China. The risk of the disaster factor and its environment was determined by the intensity of disaster multiplied by the frequency of its occurrence in a month or year. Chilling intensity was the integrative chilling damage index constructed by maximum temperature drop, extreme minimum temperature, persisting days of low temperature and harmful chilling accumulation in which the minimum temperature stays below 5. Chilling intensity was classif ed as severe, heavy, moderate, mild and no chilling injury. The vulnerability was determined by the grades of litchi yield decrease multiplied by its occurrence frequency. The grade was divided into 4 levels. Exposure was determined by the ratio of litchi harvest area to cultivated land area. The monthly or annual risk assessment model of litchi chilling in South China was then constructed by using natural disaster risk index method which was risk multiplied by vulnerability and exposure. Based on this model, the monthly or annual chilling injury risk zoning was carried out in Guangdong and Hainan provinces. The results show that moderate risks of litchi chilling injury have begun in November and gradually developed into higher risk from December, January to February in Guangdong Province, in which the high risk area of litchi is in Guangning, Gaoyao to Taishan regions. Moreover, annual chilling risk area is greater than that for monthly one. Monthly chilling risk grade is in moderate and below but the annual is rather high in Hainan Province (Fig. 5). (Ma Yuping)
2.8 Study on the stereo monitoring of and the dynamic assessment technology for major agrometeorological disasters
The f ndings about the dry-hot wind for winter wheat in Huanghuaihai areas, low-temperature damage for double cropping rice in southern China and the agricultural drought in Southwest China have been summarized as follows. Indicators for stereo monitoring were improved. Vegetation indexes were developed to monitor the large-scale dry-hot wind disastrous to wheat. The model based on the hazard index of dry-hot wind was constructed to assess the wheat loss due to dry-hot wind. For low-temperature damage to rice, loss was assessed at site and regional scale based on ORYZA2000 and empirical models. The assessment at site scale followed the rice growth process. Once the impact of low temperature was monitored, the quantitative evaluation results would be made in time. At regional assessment, remote sensing inversion was used as input data to ORYZA2000 or empirical model to calculate and modify the results. And taking MODIS data coupled with model as example, the methods were investigated for evaluating the impact of low temperature on delaying rice growth. For crop drought, yield loss was assessed based on drought accumulation index (DI) and WOFOST model. The operational platforms of monitoring and evaluation of dry-hot wind in Huanghuaihai areas and drought disasters in Southwest China at the provincial level have been established. (Zhao Yanxia)
2.9 Study on high temperature stress at grain f lling stage of winter wheat in North China
High temperature stress at the mid to late grain filling stage of winter wheat reduced the grain filling rate and shortened the grain f lling duration, resulting in a signif cant reduction of grain yield. After taking into account the other influencing factors, a significant negative linear relationship was found between the grain weight and the midday canopy air temperature in this period. This study suggest that the extent of the high temperature stress effects on winter wheat grain yield depends on both the strength and duration of the stress, which can be represented by the effective accumulated heat (summation of the hour’s temperature differences above a threshold value during the mid to late grain filling stage of winter wheat). There were signif cant negative linear relationships between the normalized grain weight of winter wheat and the effective accumulated heat above 30 °C during the mid to late grain f lling stage (P ≤0.05). This proved that the high temperature stress index is a useful parameter for quantitative evaluation of the impacts of high temperature at the grain f lling stage on winter wheat yield. (Tan Kaiyan)
2.10 Risk identif cation techniques for cold and heat damage to double-season early rice (DSER) in the middle and lower reaches of Yangtze River
Based on daily meteorological data of 48 meteorological stations during 1961–2012 in the middle and lower reaches of Yangtze River (MLRYR), spatial and temporal distribution of early cold damage, late cold damage and late heat damage of early rice was analyzed using such methods as statistical analysis, Mann-Kendall and wavelet analysis. Results show that over the past 52 years, average temperature increased signif cantly (>0.5/10a) during early rice growing season in MLRYR. Both the early and late cold damage showed a downtrend from 2000. There was a short cycle of cold damage of two to four years in early period and two to four, four to six years in late period. Late heat damage showed a signif cant increase trend from 2000 with no obvious periodicity. High risk area of early cold damage was consistent with spatial distribution of mountain terrain while that of late cold damage was consistent with distribution of water system. Cold damage weakened and heat damage increased in MLRYR under global warming. (Wang Chunyi)
2.11 Risk assessment of main meteorological disasters to maize in Northeast China
The meteorological data from 1961 to 2010, maize growth data from 1981 to 2010, production data from 1961 to 2010 in 35 agro-meteorological stations, disaster record for the latest 50 years in three provinces of Northeast China, and social and economic statistics for the latest 10 years in the counties of these three provinces were employed in this study. The drought and chilling injury at two stages of the maize including emergence-tasseling and tasseling-mature were studied, and the risk of the drought and cold injury to corn in Northeast China was evaluated. The creation of index systems of drought and cold injury was based on water deficit index and heat index. The indices of drought and chilling injury risk assessment model of the maize included hazard, vulnerability, exposure, and emergency response and recovery. Hazard and emergency response and recovery were the two most important factors in the model. For the whole growth and development period of the maize, the high values of risk index were in the southwest and northeast of Heilongjiang Province and west of Liaoning Province, standing above 0.8. The moderate values were found in the northwest and southeast of Jilin Province and the northeast of Liaoning Province, standing between 0.6 and 0.7. The low values were in the central south of Liaoning Province and Liaodong Peninsula, standing around 0.3. (Wang Chunyi)
3 Response of agriculture to climate change
3.1 Vulnerability and evaluation index of main crops under global change
The research results indicate that the impact of climate warming on growth periods and critical growth stages of spring wheat was the primary reason for vulnerability of spring wheat yield under the background of climate change. Increased temperature during the growing season accelerated the phonological development, including internode elongation, heading, anthesis and stage of grain ripening, resulted in a shorter growth period. The application of adaptation strategies, such as adjusting the sowing dates, introducing new cultivars and changing the tillage practices, likely compensated some effects of shorter growth period on wheat yield. A correlation analysis reveales that the increase in temperature during the growing season was responsible by 23% to 68%, with an average of 40.3% for the shortening growth period and altered farming practices based on phonological events, in spite of regional differences in increased temperature trend and in application of adaptation strategies. The trend analyses reveal that rising temperature has shortened the growth period by 6 to 7 days per 1 ℃, resulting in the decrease in spring wheat yield of averagely 522 kg ha-1. In addition, the fact should be recognized that the adaptive strategies continue to be performed along with the changing climate since the changes in growth period and phenology of spring wheat up to now both result from climate change and human adaptive activities. ( E Youhao)
3.2 Response of maize production to climate change and its adaptation in Northeast China
The growth period of spring maize was further subdivided into four stages: germination to emergence, emergence to jointing, jointing to tasseling, and tasseling to maturity. The average resource suitability index (Isr), average eff cacy suitability index (Ise), and average resource utilization index (K) were used as indicators of agricultural climatic resource suitability and utilization for maize production. The utilization dynamics of agricultural climatic resource during spring maize cultivation from 1961 to 2010 in Northeast China were analyzed. The key climatic factors limiting the spring maize growth were identif ed from three time scales of interannual, potential growth season and crop growing period. The variations of key growth stages of spring maize in Northeast China over the past 30 years were analyzed. The regression models on the growing period of maize in response to climate change were also established. The response of growing period of maize to climate change at different time scales was investigated. Compared with the methods of moving average and harmonic average, logistic regression optimally decoupled the climate induced yield of spring maize. The contribution of climate change to spring maize yield over the past three decades in Northeast China was decoupled. The key meteorological factors limiting the climate-induced yield were determined. Finally, the models between climatic variables and climate-induced yield of spring maize in Northeast China were also established to ref ect geographical differences. (Zhao Junfang)
3.3 Study on the impact of extreme temperature and CO2 enrichment on crop water demand
The control experiments in open top chambers (OTC), side half closed chambers and field were performed to investigate the effects of elevated atmospheric carbon dioxide concentration [CO2] and increase in temperature on winter wheat water requirement. The results show that, compared to the f eld, in open top chambers the air temperature increased by mean daily temperature of 3.1 ℃ and [CO2] elevated to 760×10-6, the whole growing period was shortened by 17 days (7%), and the average daily water requirement increased by 0.7 mm. Consequently, the water requirement increased by 123.5 mm (25.3%) during the growth period. While in side half closed chambers in which using the ambient [CO2], the air temperature increased by mean daily temperature of 0.7 ℃, the whole growing period was shortened by 7 days and the average daily water requirement increased by 0.65 mm. So, the water requirement increased by 138.8 mm (28.7%) during the growth period, indicating the approximately equivalent water requirement both in open top chambers and in side half closed chambers. There would be two reasons to explain these results. For one thing, in OTC, the air exchange with outside is less than that in side half closed chambers, leading to less evapotranspiration though signif cantly warmer in OTC than in side half closed chambers. For another, the elevated [CO2] may decrease the evapotranspiration by raising water use efficiency as mentioned in literatures. However, we have not separated the positive effect by elevated [CO2] on evapotranspiration from increased air temperature, due to the compounded effects of both elevated [CO2] and increased air temperature. Further experiments still need to be made to separate the impacts of elevated [CO2] and increased air temperature. (E Youhao)
3.4 Experimental study on the impacts of extreme temperature and CO2 enrichment on crop yield in North China
The heated treatments of winter wheat showed higher values of panicles per square meter, and no signif cant difference in the 1000 grain weight, which had signif cantly increased the yield compared to CK in the colder year (2011). The warm year (2012) showed higher values of panicles per square meter and grain number in each panicle, while the 1000 grain weight is signif cantly reduced compared with CK, but the heated treatments did not lead to yield reduction. Warming and CO2enrichment could hardly show any difference with CK, and no fertilizer effects of CO2were shown in this experiment. The warmed treatment of maize had the potential to reduce the yield compared with CK, which maybe come from the negative effect of extreme temperature in summer. But warming and CO2enrichment could set off the negative effect of extreme temperature, which increased the yield in 2012 (Fig. 6). (Fang Shibo)
3.5 Response of growth stages of spring maize to climate change in Northeast China over the past30 years
Based on the observation data of spring maize from 55 agricultural meteorological stations, and daily meteorological data of 16 meteorological stations in Northeast China, the variations of key growth stages of spring maize in Northeast China over the past 30 years were analyzed, using such methods as trend rate, spearman correlation analysis, principal component analysis and structural equation modeling. Finally, the responses of growth period of spring maize to meteorological factors over the past 30 years were further analyzed at different time scales. The results show that the spring maize’s critical growth stages in Northeast China over the past 30 years were postponed. The number of days decreased during the early maize growth period (from sowing to tasselling), while both days during the late maize growth period (from tasselling to maturation) and days of whole growth period increased. In most years, the sowing date of spring maize was later than suitable planting date, and the maturating date was earlier than the f rst frost date. Temperature was the most notable meteorological factor responsible for the altered spring maize growth period during the past 30 years. A principal component analysis showed that the increased temperature at the inter-annual timescale, the prolonged temperature growth period and the high temperature in the crop growth period were more notable than other meteorological factors. While, in the structural equation modeling, the effects of temperature on days of growth period partly were indirect, and signif cant meteorological factors could explain 44% of variation in growth period’s days. Changes in the growth stages of spring maize were caused by the response of crops and the adaptation of agricultural production to climate change under global warming. (Guo Jianping)
3.6 Attribution of crop yield increase in China to climate change and technological advancement
Crop yields are affected by climate change and technological advancement. Objectively and quantitatively evaluating the attribution of crop yield change to these two factors will ensure sustainable development of agriculture under climate change. The relative impacts of different climate variables on climatic potential productivity of maize from 1961 to 2010 in China are then evaluated based on Agro-Ecological Zones (AEZ) model. In the AEZ model, the climatic potential productivity was examined through three steps or levels: photosynthetic potential productivity, photosynthetic thermal potential productivity, and climatic potential productivity. Combined with the observations of maize, the contributions of climate change and technological advancement to maize yield from 1981 to 2010 in China were separated. The results show that, from 1961 to 2010, decreased radiation was the main factor leading to the decrease of climatic potential productivity of crops. Increased temperature had a signif cant adverse impact on the climatic potential productivities of maize and double cropping rice in China. However, it had a positive effect on wheat. Climate change had a signif cant adverse impact on the crop yield in China from 1981 to 2010. This suggests that technological advancement had offset the negative effects of climate change on maize yield. Our f ndings highlight the fact that agronomic technological advancement has contributed dominantly to crop yield increases in China in the past three decades. (Guo Jianping)
3.7 Effects of adjusted cropping systems on climatic potential productivity and utilization eff ciency of climatic resources in Northeast China
Based on the existing limitation indicators of cropping systems, while considering the impact of water and thermal resources on cropping systems in Northeast China, changes in climatic potential productivity and utilization eff ciency of climatic resources in the sensitive areas of cropping systems were analyzed. The results show that the planting boundaries of different cropping systems in Northeast China obviously shifted toward the north and the east along with the heat and precipitation resources. However, in southwestern Heilongjiang Province, only one crop in a year could be planted because of the shortage of precipitation resources. Due to high temperature stress, the climatic potential productivity of spring maize would be reduced in the future. In certain small areas nearby Harbin in the Heilongjiang Province, two crops in a year could be planted from 2071 to 2100. Therefore, adjusting the cropping system was an effective way to improve the climatic potential productivity and climate resource utilization. In some thermal resource rich areas, the climatic potential productivity of summer maize or winter wheat decreased because of the shortened growth season caused by a warming and drying climate. However, if the one crop in one year pattern (spring maize) becomes a two crops in one year pattern (summer maize and winter wheat), the total climatic potential productivities of two crops would be higher than that of one crop. This f nding further illustrates that after a paradigm shift from one crop in one year to two crops in one year, the thermal resources, which were not originally used, would become fully utilized. (Guo Jianping)
