大气探测与雷电研究进展
2014-08-31
大气探测与雷电防护
Atmospheric Sounding and Lightning Protection
大气探测与雷电研究进展
2014年大气探测研究所以理论研究为基础,紧密联系实际应用,围绕野外观测试验和理论研究的重点方向,开展了大量卓有成效的观测和研究工作,并取得了丰硕的成果。2014年共发表期刊论文13篇,其中SCI论文4篇;申请国内发明专利3项、国际发明专利1项、实用新型专利2项;获得软件著作权授权1项;1人获得全国优秀青年气象科技工作者称号。具体成果主要体现在以下几个方面。
1 野外观测试验和闪电物理过程研究
1.1 雷电野外观测试验
2014年大气探测研究所在广州、重庆以及拉萨分别开展了雷电外场试验。5月6日到8月28日在广州从化的广州野外雷电试验基地开展的 “广东闪电综合观测试验(GCOELD)” 是自2006年以来的第9年度外场试验。本年度的触发闪电次数达到历年最高值,实现了共计15次包括多回击在内的人工触发闪电,总回击次数达到了45次,并获得了上述触发闪电的电磁场、光辐射、高速摄像、电流的直接测量资料。在自然闪电观测方面进一步发展了多频段同步信号的自动化观测技术,完善了低频电磁场、光辐射、宽带辐射场和高速摄像的多频段(低频-高频-甚高频-光信号)的同步综合观测平台,改善了触发记录方式,实现了自动化测量,获得了几十例闪电信号多频段观测数据,进一步深化了对闪电放电过程的研究。同时,新发展和研制的高灵敏度闪电电场变化测量系统已经架设并稳定运行,获取了大量的闪电放电的连续记录数据。在高建筑物闪电观测方面,增设了2套大量程的快慢电场变化测量仪以及2套全视野闪电通道成像仪,全年共获取综合观测个例79个,积累了更多的高建筑物自然闪电同步观测资料(图1~2)。
雷电防护技术测试获得了高压架空线在近距离闪电回击的电磁环境中的感应情况,检验了架空线的电磁兼容性能,研究了真实雷电环境下电磁脉冲在架空线的耦合机理,成功获得了数十次的架空线感应电压特征,为架空线雷电防护方案的优化提供了重要的基础数据。
重庆野外试验初步建成由9个子站和1个闪电数据处理中心站构成的地基高精度3D闪电定位系统区域示范网络,并完成基于时差定位技术的高精度闪电3D定位算法和闪电类型识别软件。拉萨外场试验主要针对“布达拉宫雷电灾害防御基础研究”项目的任务,按照计划完成了雷电光学图像和电磁信号观测设备的架设。(张阳,吕伟涛)
1.2 雷电先导3D发展特征的观测和分析
闪电通道2D图像不能反映闪电通道的真实分布情况,难以满足准确分析闪电通道3D发展特征和闪电先导相互作用的需求。本研究建立了一种利用双站摄像资料重建闪电3D通道的方法,从2幅在不同位置拍摄到的闪电2D图像上分别获取闪电通道的坐标序列,利用空间立体几何原理,寻找2组序列中相互匹配的坐标,再由匹配的坐标序列重建出最终的闪电3D通道。
利用建立的闪电通道3D重建方法,对2012年在广州观测到的6次自然负极性闪电连接过程中上行连接先导(UCL)的通道进行了3D重建,并对比分析了利用单站高速摄像资料和双站光学观测3D重建资料得到的(UCL)的2D和3D发展特征。主要结论如下:重建得到的6个UCL通道3D长度的范围为180~818 m,平均值为426 m;计算得到了38个3D发展速率,其变化范围为(0.8~14.3)×105m/s,平均值为4.7×105m/s,其中4个(11%)处于106m/s量级;对应的2D长度和发展速率的变化范围分别为147~610 m和(0.3~10.6)×105m/s;平均来看,UCL的3D发展速率为2D的1.3倍;UCL的发展速率随时间呈现逐渐增加的趋势,4个106m/s量级的3D速率都出现在回击前的0.2 ms内;对于3D长度短于300 m的UCL,77%(20/26)的3D速率小于5×105m/s,而对于3D长度超过300 m或者头部高度超过650 m的UCL,其3D速率均高于5×10⁵m/s(图3)。(吕伟涛,马颖)
1.3 人工触发闪电连续电流过程与M分量特征
在广州野外雷电试验基地,对2008年和2011年夏季人工触发闪电回击之后的14个连续电流过程和43个M分量的通道底部电流、电场变化和通道亮度进行了同步测量和分析。结果表明:M分量的电流、快慢电场变化和亮度变化波形均近似对称;触发闪电连续电流过程的持续时间、转移电荷量、电流平均值的几何平均值分别为22 ms,6.0 C和273 A;M分量的幅度、转移电荷量、半峰值宽度、上升时间、持续时间的几何平均值分别为409 A,205 mC,520 μs,305 μs和1.6 ms;连续电流持续时间与M分量的个数、相邻M分量之间的时间间隔均存在显著的正相关关系(图4)。(郑栋,张阳)
1.4 闪电不规则脉冲簇事件的发生规律
分析了2012 年广州地区6 次雷暴过程的负地闪中不规则脉冲簇(CPT)放电事件的发生规律。结果表明,CPT 能够发生在首次回击之前、各个回击间以及最后一次回击之后,是负地闪放电过程中普遍存在的一种放电现象。在323次负地闪中有243次出现了CPT放电事件,比例达到了75.2%,并且能够发生在负地闪的首次回击之前、回击之间以及最后一次回击之后,其中有66.7%的继后回击之前和11.5%的最后一次回击之后发生了CPT。研究还发现,CPT在继后回击之前有4种分布类型,即单独出现一次CPT-c(与继后回击相连的CPT)、单独出现一次CPT-i(与继后回击有一定时间间隔的CPT)、同时出现CPT-c 和CPT-i 以及同时出现多次CPT-i。其中,单独出现一次CPT-c类型最为多见,39.4%的继后回击之前为此类型,而在第1次和第2次继后回击之前更容易出现多次CPT的现象,分别占到对应次序回击总数的9.4%和7.7%。而随着继后回击次序的增加,其之前发生CPT的概率呈减小的趋势,并且除了第1次和第2次继后回击以外,其他继后回击之前CPT-c的出现频次大于CPT-i。另外,CPT-i和最后一次回击之后的CPT均叠加在K变化上,部分回击间的CPT也能够发生在J过程中(图5)。(张阳)
1.5 闪电不规则先导的多尺度熵分析
针对不规则脉冲簇难以判别问题,将多尺度熵应用于不规则先导分析中,给出了一种多尺度熵计算方法,并通过实例说明多尺度熵在表征复杂信号方面的能力,来区分不规则先导与直窜先导及梯级先导的不同。探讨了闪电信号不规则脉冲分析应用中多尺度熵关键参量的选择方法。在此基础上,将不规则先导与直窜先导及梯级先导闪电信号的多尺度熵进行比较。统计分析表明:不规则先导和直窜先导熵值随尺度先增加后趋于平稳,但熵值有很大差异;梯级先导熵值随尺度变化不明显,整体呈增长趋势,与不规则先导的熵值在大于3的尺度上也有所差异,因此当尺度大于3时可将熵值大于1.5的先导归类为不规则先导,熵值小于1.5的先导归类为梯级先导或直窜先导。不规则先导的特征熵平均值为2~2.1,最大值范围为2.6~2.8,最小值范围为1.5~1.51(图6)。(张阳)
1.6 闪电电场变化信号测量系统及方法
为了解决闪电电场近距离测量的饱和问题并兼顾其测量的动态范围,发明了一种闪电电场变化信号测量系统。该系统包括探测天线、电场快变化接收机、信号处理模块:电场快变化接收机分别连接探测天线和信号处理模块;探测天线用于将感应到的闪电产生的电场变化信号传输至电场快变化接收机;电场快变化接收机用于处理电场变化信号,以得到闪电电场快变化信号,并将闪电电场快变化信号传输至信号处理模块;信号处理模块用于采集并处理闪电电场快变化信号,以得到闪电电场慢变化信号。同时发明了一种与上述测量系统相对应的闪电电场变化信号测量方法。所发明的闪电电场变化测量系统和方法,可通过电场快变化接收机获取闪电电场快变化信号,并对闪电电场快变化信号处理得到闪电电场慢变化信号,实现了对闪电电场快、慢变化信号的集成化测量,有效解决了近距离闪电信号过强导致的闪电电场慢变化探测输出饱和的问题(图7)。(张阳,孟青)
2 雷暴中闪电活动特征及其与天气现象关系研究
2.1 基于大气层结和雷暴演变的闪电和降水关系
选取2006—2008年发生在北京及其周边地区的28次雷暴过程,基于大气不稳定度参数和雷达参量对雷暴过程进行分类,分析了不同分类条件下的总闪电活动(SAFIR3000 3D闪电定位系统观测)和对流降水(雷达反演)的关系。结果表明,总闪对应降水量的平均值为1.92×10⁷kg/fl。依据对流有效位能和抬升指数对雷暴进行分类的分析表明,较强的不稳定状态对应了较小的总闪对应降水量,同时总闪频次与对流降水量的相关性更好。基于雷达特征参数的分类分析表明,总闪对应降水量在对流运动较弱情况下最小,其次是对流运动较强的情况下,而对流运动适中时最大。(郑栋)
2.2 上海及周边地区地闪活动特征及海陆差异
利用LS8000闪电定位系统2009—2011年的地闪观测资料对上海及周边地区(120°~122.5°E,30°~32°N)的地闪活动特征进行了研究。结果表明,分析区域内正地闪的比例约占8.5%,大电流地闪(电流绝对值大于50 kA)的比例约为5.6%。地闪活动主要集中在6—9月,峰值出现在8月;日间12∶00—19∶00闪电活动最为活跃,峰值出现在14∶00,凌晨闪电活动最弱。从日变化上来说,正地闪和大电流地闪比例在地闪活动较强时段低于地闪活动较弱时段;在月分布上,在地闪活动最强的夏季,正地闪比例普遍在10%以下,在地闪活动较弱的春、秋、冬季,正地闪比例普遍在10%以上。以31°N为界,分析区域北部地闪密度基本在6~12次/(km2·a),南部基本在2.4~4.8次/(km2·a)。同时陆地上的地闪密度要显著高于湖泊和海洋上的地闪密度,而海洋上的正地闪比例和大电流地闪比例要显著高于陆地。闪电空间分布的时间变化说明,下午地闪活动主要出现在陆地,而凌晨地闪主要出现在水体附近,其他时段则表现出过渡特征,这与下垫面的加热作用紧密相关。(郑栋)
3 利用WRF-Electric模式模拟热带气旋电荷结构的演变特征
以WRF-ARW模式为基础,在Milbrandt和Morrison2个双参数微物理方案中分别耦合了感应和非感应的起电机制,同时引入了放电参数化方案,从而构建起一个完整的中尺度起电放电模式WRFElectric。模式不仅能够模拟风暴内电荷结构的演变,同时还具有区域闪电活动分布的预报能力。在非感应起电机制方面,不仅引入了基于液态水含量的TGZ机制和GZ机制,还将基于霰粒子结淞率的SP98机制和RR机制引入到了数值模式。图8所示为中尺度起电放电模式的架构。利用建立的中尺度起电放电模式,对于一个理想的热带气旋起电的演变进行了模拟。研究热带气旋的起电及电荷结构,有利于更进一步地理解热带气旋中的闪电活动。本研究从数值模拟的角度尝试描述热带气旋电荷结构的演变特征,已有的大部分观测事实和模拟结果从不同方面支持了本研究的结论。
模拟结果表明(图9),眼壁区对流一般表现出负的偶极性结构,有一个负电荷区在正电荷区之上。在加强阶段,眼壁区伴随的强烈上升气流的极端强对流呈现正常的3极性电荷结构,有一个主负电荷区夹在2个正电荷区之间。外螺旋雨带对流的电荷结构在不同阶段均呈现正常的偶极性电荷结构。进一步的分析表明,不同的电荷结构主要是由上升气流和粒子分布的差异造成的。在眼壁区对流的上升气流一般较弱,不同粒子的混合区域主要分布在较低的层次,导致起电过程主要发生在霰粒子的正起电区。在加强阶段,眼壁区爆发的强对流具有强的垂直上升气流,起电在霰粒子的正、负起电区同时进行。而在外螺旋雨带对流中,霰粒子和冰晶粒子的主要共存区在云的高层,起电过程也主要发生在霰粒子的负起电区,从而形成正常的偶极性电荷结构。据此,构建了热带气旋电荷结构演变的概念模型(图8~9)。(王飞,徐良韬)
4 雷电业务工作进展
4.1 雷电临近预警系统的推广培训
针对雷电业务应用系统的需求,2014年9月16—19日,按照“2013年气象监测与灾害预警工程”项目实施方案的指导精神,中国气象科学研究院大气探测所承担的第2期全国“雷电临近预警系统培训班”在中国气象局气象干部培训学院安徽分院举办,来自全国30个省(市、自治区)气象台、防雷中心以及民航华北空管局气象中心的技术人员共65名学员参加了本次培训班。
大气探测所在第1期培训班的基础上,根据培训后的反馈精心调整授课内容,更新修订了教材。培训内容涉及了雷电物理、灾害天气、雷电探测、雷电预警预报、防雷工程等多方面知识,受到了学员的好评,进一步推动了现有科研成果的业务转化和应用。(姚雯,孟青,张文娟)
4.2 雷电临近预警系统推广应用
2014年3月,雷电临近预警系统在广东省防雷中心本地化调试后,于2014年4月20日投入业务试验运行。系统运行期间,已成功对广东省多次雷暴过程提前作出了准确的雷电预警,系统POD、FAR以及TS评分较好。目前,广东省防雷中心已将雷电临近预警系统的业务产品应用于广州市超高建筑物、危化品场所等多个重点单位的雷电临近预警服务,为重点单位合理安排经营时间、规避雷击风险以及雷电应急安全生产等工作提供了重要的决策参考。(姚雯,孟青)

图1 人工引雷试验场(左)和一次成功触发闪电(右)Fig. 1 Field for artif cially triggered lightning (left) and a successfully triggered lightning (right)

图2 新架设的观测设备(左)和一次高建筑闪电(右)Fig. 2 A building observation system (left) and a high-building lightning (right)

图3 广州试验观测到的一次闪电过程的上行连接先导的3D通道重建结果(右上为3D通道,左上、左下和右下分别为3D通道在Y-Z平面、X-Y平面和X-Z平面上的投影,颜色指示高度的变化)Fig. 3 3D reconstruction results of the upward connecting leader (UCL) for a lightning f ash observed in Guangzhou. It contains the 3D reconstruction channel of the UCL (top right), the projection of the 3D reconstruction channel in the Y-Z plane (top left), the X-Y plane (bottom left) and the X-Z plane (bottom right). The colors indicate height

图4 触发闪电连续电流过程观测波形:(a)电流波形;(b)快电场变化波形;(c)慢电场变化波形;(d)通道亮度变化波形Fig. 4 Observed waves of continuous current of triggered lightning: (a) current wave; (b) fast electric f eld waveform; (c) slow electric f eld waveform; (d) channel luminosity variation waveform
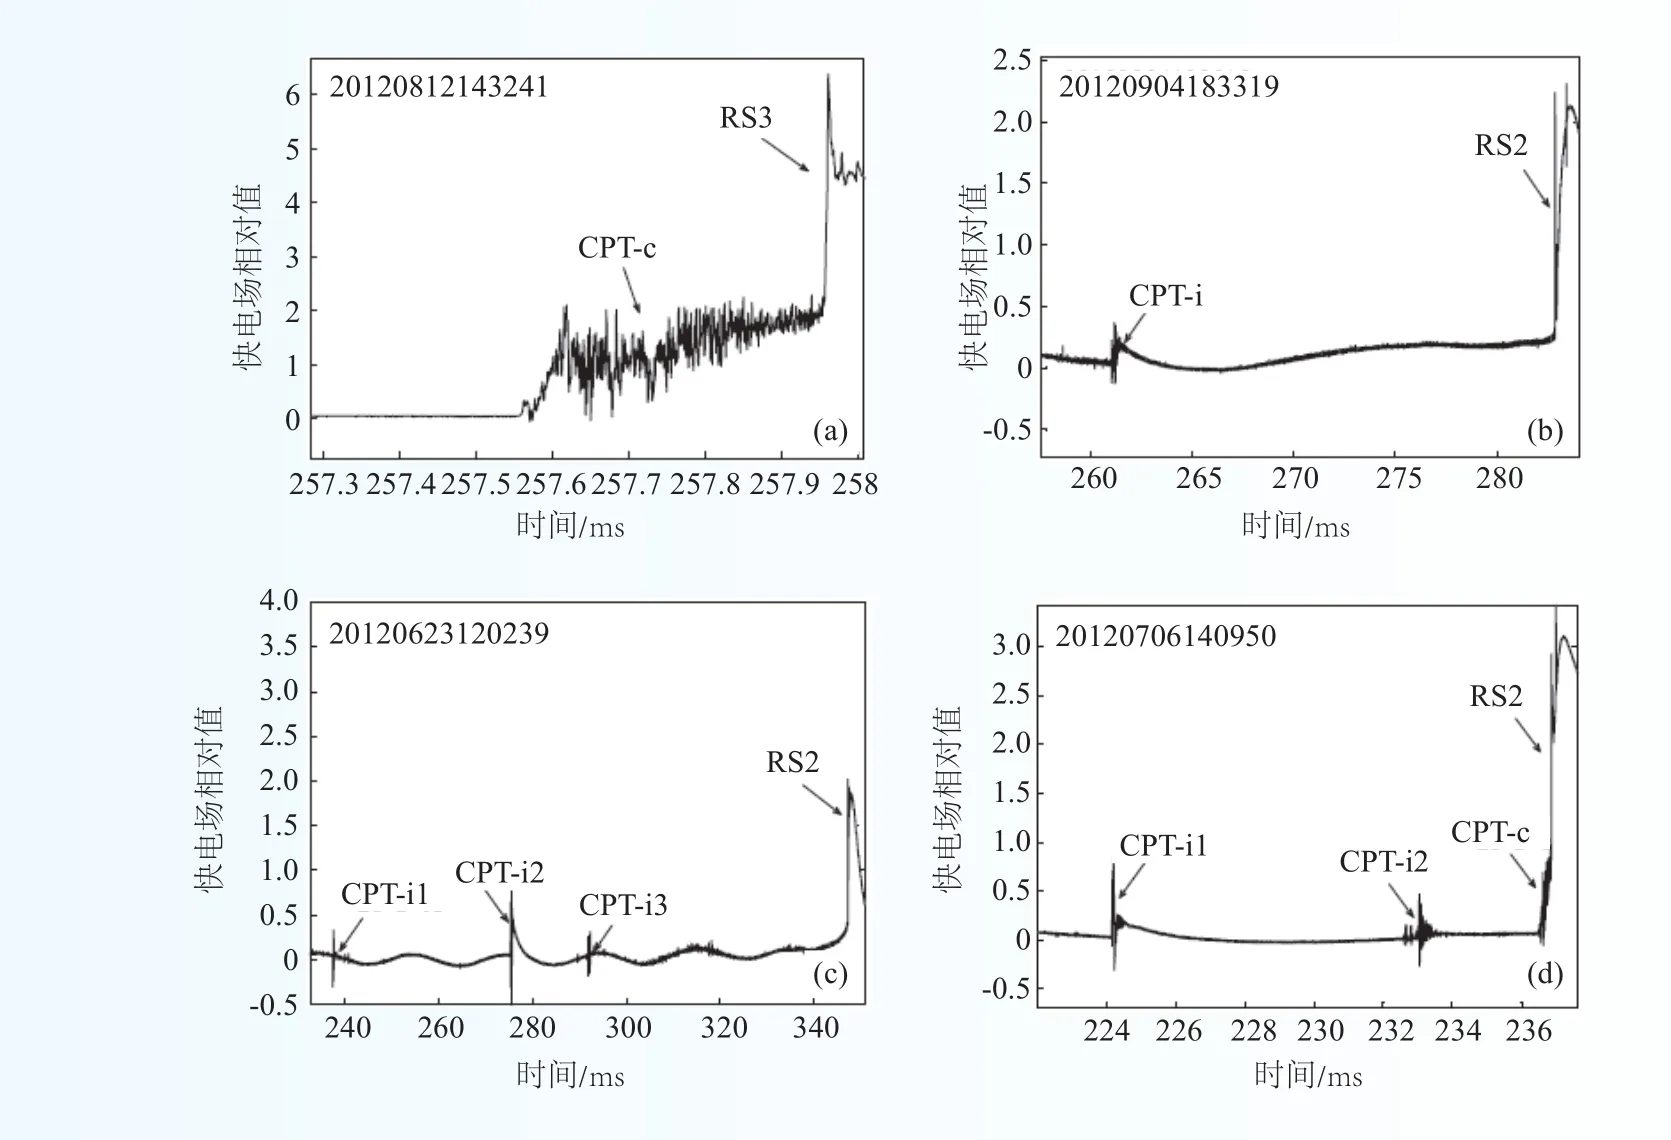
图5 不规则脉冲簇在放电波形中的位置分布Fig. 5 Distribution of chaotic pulses in the discharge waveform
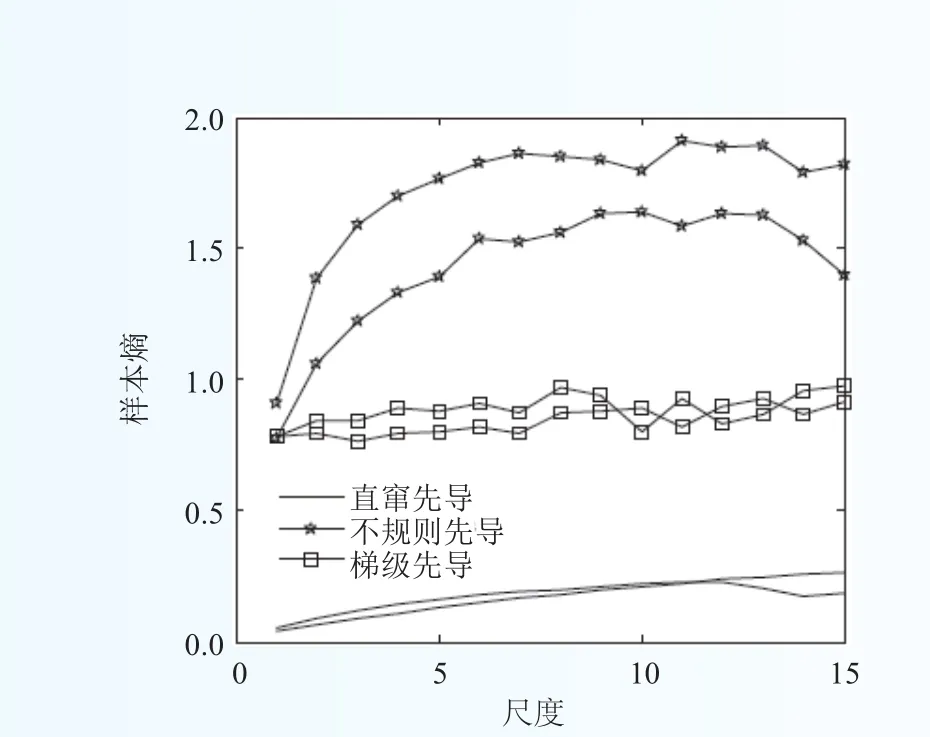
图6 不同先导的多尺度熵特征Fig. 6 Multi-scale entropy features of different leaders
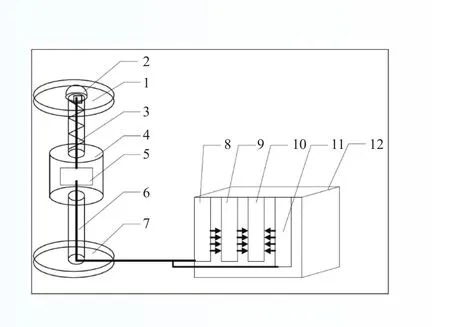
图7 闪电电场变化集成测量系统示意Fig. 7 Integrated measurement system of lightning E-change

图8 中尺度起电放电模式WRF-Electric的架构Fig. 8 Frame of the WRF-Electric model

图9 热带气旋不同阶段的电荷结构演变特征(眼壁区加强阶段(a-b)和准稳态阶段(c-d)电结构;外螺旋云带加强阶段(e)和准稳态阶段(f)电结构)Fig. 9 Evolution of the charge structure of a TC in different stages: Intensif cation stage (a-b) and quasi-steady stage (c-d) of an eyewall; Intensif cation stage (e) and quasi-steady stage (f) of the outer spiral rainband cells
Progress in Atmospheric Sounding and Lightning Research
Based on theoretical research and practical application while focused on key directions of the lightning field experiment and the theoretical research, a lot of observation and research activities were carried out and fruitful results were achieved by the Institute of Atmospheric Sounding (IAS) in 2014. 13 papers were published, 4 of which were collected by SCI/EI; one was requesting an international patent, 3 national patents for invention and 2 patents for practical novelty; one software copyright was authorized; one person obtained the title of “National Outstanding Young Meteorological Science and Technology Worker”. The concrete results are shown as follows.
1 Lightning f eld experiment and physical process research
1.1 Comprehensive observation experiment on lightning discharge
The IAS conducted the comprehensive observation experiment on lightning discharge in 2014. The Guangdong Comprehensive Observation Experiment on Lightning Discharge (GCOELD) carried out in Guangzhou from May 6 to Aug 28 is the ninth f eld experiment since 2006. 15 lightning f ashes, including 45 return strokes, have been triggered successfully, which are the best results since the year of 2006 when GCOELD began. The synchronous observation data, including current, electromagnetic signal, optical radiation and high speed video, have also been acquired. As for the observation of natural lightning, the synchronous auto-observation technology of multiband lightning signals has been further developed, and the multiband observation platform, which detects LF electromagnetic signal, optical radiation, broadband radiation, and high-speed video, has been improved through a f exible triggering method and an auto-observation method. The multiband observation data for tens of f ashes have been recorded, which helps further deepen the research of lightning discharge. At the same time, the novel observation system of electric f eld change and of highsensitivity has been built and operated continuously, and continuous data of lightning discharge have been acquired. As for the observation of lightning on high buildings, we set up some novel observation systems, including two slow/fast antennas with a large detection range and two whole-view imagers of lightning channel, with 79 comprehensive cases of high building lightning recorded.
Additionally, the test of lightning protection technology has been conducted based on the close triggered lighting. The electromagnetic compatibility of high voltage line has been checked and 10 induction signals near the triggered lightning have been recorded, which provide fundamental data for optimizing the lightning protection scheme of high voltage line and establishing the lightning protection level in the future. Further, the coupling mechanism on electromagnetic pulse of a high voltage line has been studied.
The experiment in Chongqing has preliminarily built a local prototype network of three-dimensional (3D) lightning location system of high accuracy, which includes 9 substations and 1 central station. At the same time, the location algorithm of time-of-arrival (TOA) for lightning 3D location of high accuracy and the software for distinguishing lightning types has been developed.
The experiment in Lasa focused on the tasks as described in the project “Fundamental Research for Lightning Protection in the Potala Palace”. The instruments of optical imaging and electromagnetic signal for lightning have been installed and operated (Fig.1–2). (Zhang Yang, LǚWeitao)
1.2 Observation and analysis of the 3D propagation characteristics of lightning leader
A two-dimensional (2D) image of lightning channel, which cannot ref ect the real 3D spatial distribution of lightning channel, is insufficient to meet the needs of an accurate analysis of the 3D lightning channel development characteristics and the interaction between different leaders. A reconstruction method of 3D lightning channel from dual-station optical observation is established. The 2D coordinate sequence of lightning channel is obtained from each 2D lightning image captured at different positions. The principles of 3D spatial geometry are used to match the coordinates from different sequences to reconstruct the 3D lightning channel.
Six downward negative f ashes terminated on tall structures in Guangzhou are analyzed. The 3D lightning channels of the upward connecting leaders (UCL) are reconstructed. For comparison, the corresponding 2D parameters are calculated using the single-station high-speed images. The main conclusions are summarized as follows: the 3D length values of the six UCLs range from 180 to 818 m with an average value being 426 m; 38 3D speed values calculated by combining the 3D UCL channel and the high-speed images for the six UCLs range from 0.8×10⁵to 14.3×10⁵m s-1(average: 4.7×10⁵m s-1) and four of them (11%, 4/38) are on the order of 106m s-1; the corresponding 2D length and 2D speed range from 147 to 610 m and 0.3×10⁵to 10.6×10⁵m s-1, respectively; the average value of the 3D speed is 1.3 times that of the 2D speed; when the time approaches the return stroke, the propagation speed of the UCL increases and all of the four 3D speed values on the order of 106m s-1occur less than 0.2 ms prior to the RS; when the 3D length is shorter than 300 m, 77% (20/26) of the corresponding 3D speed values are smaller than 5×10⁵m s-1, and when the 3D length is longer than 300 m or the UCL tip height is higher than 650 m, all of the corresponding 3D speed values are faster than 5×10⁵m s-1(Fig. 3). (Lǚ Weitao, Ma Ying)
1.3 Characteristics analysis of a continuing current process and M-component in an artificially triggered lightning
The Continuing Current (CC) process of cloud-to-ground lightning is a discharge process in which charges are continuously transferred to ground along the lightning channel after a return stroke. The magnitude of CC is small, but the duration of CC is commonly long. So CC often causes a lightning disaster. It,s very hard to get current data due to the randomness of lightning. An artif cially triggered lightning, in which the location and time of a triggered lightning can be controlled, is an effective way to measure currents of lightning. An artif cially triggered lightning is different from a natural lightning, which only has CC after a return stroke. Yet an artif cially triggered lightning has both CC and Initial Continuous Current (ICC) processes. Only the CC is analyzed using simultaneous observations of current, electric f eld change and channel luminosity by coaxial shunts, fast and slow antennas, and high-speed cameras in Guangzhou Field Experiment Site for Lightning Research and Testing, Conghua, Guangdong, China. Then, photoelectric characteristics and parameters of 14 CC and 43 M-components after return strokes of a triggered lightning observed in summer from 2008 to 2011 are analyzed. The relationships between some characteristic parameters of CC and M-component are analyzed, too.
The current waveforms of CC after return strokes are continuous and change slowly. Usually, there are current pulses ranging in size superimposed on CC waveforms. The slow electric field waveforms of CC are slowly changing, too. The lightning channel below the cloud is always luminescent during CC. The current waveforms, fast and slow electric field waveforms and channel luminosity variation waveforms of M-components are approximately symmetrical. The geometric mean of duration, charge transferred to ground, average current and action integral for CC are 22 ms, 6.0 C, 273 A, 4187 A2s, respectively. The geometric mean of magnitude, charge transferred, half peak width, rise time (10%–90%), duration, preceding CC level, inter-pulse interval, action integral for M-components are 409 A, 205 mC, 520 μs, 305 μs, 1.6 ms, 310 A, 6.5 ms, 465 A2s, respectively. There are remarkable positive correlations between the duration of continuing current and number of M-components, and between the duration of continuing current and inter-pulse interval of M-components. The correlation coeff cients are 0.83 and 0.75, and both pass the signif cant verif cation of 0.01 level (Fig. 4). (Zheng Dong, Zhang Yang)
1.4 Occurrence regularity of CPT discharge events in a negative cloud-to-ground lightning
Occurrence regularity of chaotic pulse trains (CPT) discharge events in a negative cloud-to-ground (CG) lightning during six thunderstorms is analyzed. Results show that CPT is a common phenomenon throughout the negative CG lightning discharge process. 243 times of CPT discharge events occur during 323 negative CG lightning processes with a proportion reaching 75.2%. CPT in negative CG can occur before the first return stroke, between the strokes, and after the last stroke. The proportion of 66.7% of the total subsequent strokes is preceded by CPT, and CPT occurs after 11.5% of the total last strokes. It is also found that there are four distributions prior to subsequent strokes: single CPT-c (CPT connecting with subsequent strokes), single CPT-i (CPT occurring in an interval between CPT and return strokes), CPT-c and CPT-i occur concurrently, and several CPT-is appear concurrently. Single CPT-c is the most common, 39.4% of subsequent strokes are preceded by single CPT-c, and several CPTs are easier to occur before the f rst and second subsequent strokes, which are respectively 9.4% and 7.7% of the total corresponding strokes. With the increasing subsequent strokes, there is a decreasing occurrence of CPT, and in addition to the previous two subsequent strokes, the number of CPT-c is obviously greater than that of CPT-i. In addition, both CPT-i and CPT-c coincide with the negative CG K-change, and some also correspond to the process of J-change in the slow electric f eld wave (Fig. 5). (Zhang Yang)
1.5 The multi-scale entropy feature of a chaotic leader in a CG lightning
To address the difficulty in determining chaotic pulses, we apply the multi-scale entropy method to distinguish chaotic, dart and dart-stepped leaders. The calculation method of multi-scale entropy and the applicability in characterizing complex signals have been investigated. The key parameters of multi-scale entropy during their application to the analysis of lightning chaotic pulses have been researched, and the multiscale entropies for chaotic, dart and dart-stepped leaders have been compared. The results show that although the entropies of chaotic and dart leaders both increase f rstly and then stabilize with the changing scale, their values are obviously different. The entropy of a stepped leader does not change too much with the increasing scale, and its value is different from that of a chaotic leader when the scale is larger than 3. As a result, we suggest that the entropy with a value of >1.5 indicates a chaotic leader, in contrast, the entropy with a value of< 1.5 corresponds to a stepped-leader or a dart leader. The average value of characteristic entropy for a chaotic leader is 2–2.1, the range of maximum values of it is 2.6–2.8, and the range of minimum values of it is 1.5–1.51 (Fig. 6). (Zhang Yang)
1.6 Lightning electric f eld change signal measuring system and method
To address the saturation during the close measurement of lightning, a lightning electric field change signal measuring system has been invented. The system comprises a detection antenna, an electric f eld rapidchange receiver and a signal processing module, wherein the electric f eld rapid-change receiver is respectively connected with the detection antenna and the signal processing module; the detection antenna is used for transmitting an electric f eld change signal generated by an induced lightning to the electric f eld rapid-change receiver; the electric f eld rapid-change receiver is used for processing the electric f eld change signal to obtain a lightning electric f eld rapid-change signal and transmitting the lightning electric f eld rapid-change signal to the signal processing module; and the signal processing module is used for acquiring and processing the lightning electric f eld rapid-change signal to obtain a lightning electric f eld slow-change signal. The invention also covers a lightning electric f eld change signal measuring method corresponding to the measuring system. The system and method detect the electric f eld change signal by the reception of E-change, and then process the data to get a slow E-change waveform. As a result, it realizes an integrated measurement of lightning electric f eld rapid-change and slow-change signals, and solves the saturation during the close measurement of lightning (Fig. 7). (Zhang Yang, Meng Qing)
2 Characteristics of lightning activity in a thunderstorm and its relationship with weather phenomena
2.1 Relationship between lighting and precipitation based on atmospheric stratification and thunderstorm development
A total of 28 thunderstorms occurring in and around Beijing from 2006 to 2008 are collected to investigate the relationship between total lighting (observed by SAFIR3000) and convective precipitation (by radar inversion). These cases are classif ed according to the parameters of atmospheric stratif cation and the ref ectivity of radar. The quantitative results provide a reference for applications of lightning data to severe weather warning and precipitation estimation. The lightning forecast can also be improved by assimilating the relationship between the hydrometeors and the lighting activities to the numerical prediction models. The analysis can extend the application of the lighting data.
The results show that the average convective rain yield per f ash is 1.92×10⁷kg f-1on the whole, while the linear correlation coefficient between total lightning frequency and convective precipitation is 0.584. Total lightning frequency (expressed by F with the time interval being 6 min) can be used to calculate the amount of convective precipitation with the equation being R = (2.813×10⁸) + (4.570×10⁶) F. A total of 28 thunderstorms are classif ed according to the available potential convective energy (Ecap) and lifting index (LI) of the atmospheric stratif cation. It is found that strong instability of atmospheric stratif cation tends to be associated with smaller precipitation and there is a more pronounced correlation between total lightning and precipitation. The classif ed Ecap (no less than 1600 J·kg-1) has a correlation coeff cient of 0.837. The total lightning frequency can be used to calculate the amount of convective precipitation with the equation being R = (1.620×10⁸) + (5.478×10⁶) F. While the classif ed LI (no less than 4 K) has a correlation coeff cient of 0.853, the total lightning frequency can be used to calculate the area of the amount of convective precipitation with the equation being R = (1.530×10⁸) + (6.276×10⁶) F. Another three parameters are calculated from radar reflectivity, i.e., maximum height of 20 dBz reflectivity, maximum reflectivity at 12 km level, and volume ratio of the ref ectivity larger than 30 dBz above 0℃ to the ref ectivity larger than 40 dBZ above 0℃, in terms of their radar volume scans. The most pronounced relationships between lightning and precipitation occur in the classif cation of H20 dBz<11.5 km, 25 dBz≤f12 km<35 dBz, and V40/30<0.39, when the correlation coeff cients are 0.804, 0.609 and 0.750, respectively. The linear correlation between lightning and precipitation shows obvious differences in different classifications. The fitting equations in different classifications will provide references for the application of relationships between lightning and precipitation according to the characteristics of thunderstorm processes. (Zheng Dong)
2.2 Characteristics of CG lightning in Shanghai and its surrounding regions and land-sea difference
With observations from the LS8000 lightning location system, cloud-to-ground (CG) lightning activities in Shanghai and its surrounding regions are studied. The percentage of positive CG lightning in the total is about 8.5% and that of large current CG lightning (with the absolute value of current larger than 50 kA) is 5.6%. CG lightning activities highly occur in the period from June to September, and peak in August. For the temporal distribution of CG lightning, 12:00 to 19:00 BT is an active period, which peaks at 14:00 BT and bottoms out in the morning. The monthly and hourly distributions of the percentage of the positive cloud-toground (PCG) lightning are seasonal. Setting 31°N as the boundary, the CG lightning density is generally 6 to 12 f ashes/(km2·a) in the northern part and 2.4 to 4.8 f ashes/( km2·a) in the southern part of the analyzed area. At the same time, the CG lightning density on land is higher than those in lake and oceanic areas, while the percentage of PCG lightning and the large current CG lightning in the oceanic area is signif cantly higher than those on land. The time changes of spatial distribution of CG lightning show that CG lightning activities mainly appear on the land in the afternoon and near the water in the morning, while in other periods are transitional, which is closely related to the heating effect of the underlying surface. (Zheng Dong)
3 Simulation of the electrif cation of a tropical cyclone using the WRF-Electric model
Inductive and non-inductive electrif cation schemes and a bulk discharge parameterization are introduced into the Milbrandt and Morrison two-moment microphysical schemes in the WRF-ARW model. The model with electrical processes, referred to as WRF-Electric, is able to simulate charge density and lightning distribution in storms. Four different charge separation schemes (TGZ, GZ, SP98 and RR) are introduced into the two microphysics schemes. Fig. 8 shows the frame of the WRF-Electric model.
The evolution of the electrification of an idealized Tropical Cyclone (TC) is simulated by the WRFElectric model. The characteristics of TC lightning can be further understood by comprehending the electrif cation of TCs. This study makes an attempt to illustrate the evolution of the charge structure of TCs. The results of this study can be supported by most of the previous observations and simulations.
The results indicate that the eyewall generally exhibits an inverted dipole charge structure with negative being above positive. In the intensif cation stage, however, the extremely tall towers of the eyewall may exhibit a normal tripole structure with a main negative region found between two regions of positive charge. The outer spiral rainband cells display a simple normal dipole structure in all stages. Further analyses indicate that the differences in charge structures are associated with different updrafts and particle distributions. Weak updrafts, together with a coexistence region of different particles at lower levels in the eyewall, result in charging processes that occur mainly in the positive graupel charging zone (PGCZ). In the intensification stage, the occurrence of charging processes in both positive and negative graupel charging zones are associated with strong updrafts in the extremely tall towers. In addition, the coexistence region of graupel and ice crystals is mainly situated at upper levels in the outer rainband, so the charging processes mainly occur in the negative graupel charging zone (NGCZ). The conceptual model of the evolution of the charge structure of TCs is built (Fig. 8–9). (Wang Fei, Xu Liangtao)
4 Research working progress about lightning operational application
4.1 Promotion training of the lightning detection, nowcasting and warning system
“2013 Meteorological Monitoring and Disaster Warning Project”, the second stage of the national training on CAMS_LNWS, was held by IAS in Anhui branch of the China Meteorological Administration Training Center during 16–19 September 2014. A total of 65 staff members from meteorological stations and lightning protection centers at national level and from the Meteorological Center of the North China Air Traff c Management Bureau of Civil Aviation Administration of China participated in this course.
The IAS revised the context of the course and updated the teaching materials according to the feedback of the first training course held in 2013. The training course covered lightning physics, lightning disaster, lightning detection, lightning warning, and lightning protection engineering. The course, which was highly praised by the participants, promoted the further application of research outputs to operations and services. (Yao Wen, Meng Qing, Zhang Wenjuan)
4.2 Application of Lightning Nowcasting and Warning System (CAMS_LNWS)
After localization test in the Lightning Protection Center of Guangdong Province, the CAMS_LNWS was put into operation in Guangdong on April 20, 2014. During the operational period, it made several successful early warnings and the evaluation results of POD (Probability of Detection), FAR (False Alarm Rate) and TS (Threat Score) showed that all warnings performed well. Now, the products of CAMS_LNWS have been used in the services for ultra-high buildings, hazardous chemicals sites and other key areas. It can provide an important reference for decisions to be made for work time arrangement, lightning risk avoidance, and safety production.( Yao Wen, Meng Qing)
