Multi-point design optimization of hydrofoil for marine current turbine*
2014-06-01LUOXingqi罗兴锜ZHUGuojun朱国俊FENGJianjun冯建军
LUO Xing-qi (罗兴锜), ZHU Guo-jun (朱国俊), FENG Jian-jun (冯建军)
Institute of Water Resources and Hydro-electric Engineering, Xiʼan University of Technology, Xiʼan 710048, China, E-mail: yuanhang3543@163.com
Multi-point design optimization of hydrofoil for marine current turbine*
LUO Xing-qi (罗兴锜), ZHU Guo-jun (朱国俊), FENG Jian-jun (冯建军)
Institute of Water Resources and Hydro-electric Engineering, Xiʼan University of Technology, Xiʼan 710048, China, E-mail: yuanhang3543@163.com
(Received March 21, 2014, Revised May 9, 2014)
The comprehensive performance of the marine current turbine is an important issue in the ocean energy development. Its key is the performance of the hydrofoil, which is used to form the turbine blade. A multi-point optimization method of the hydrofoil is proposed in this paper. In this method, the Bezier curve is used to parameterize the hydrofoil. The geometrical parameters are used as variables while the lift-drag ratio and the cavitation performance of the hydrofoil are used as the objective functions. The NSGA-II algorithm is chosen as the optimization algorithm. In order to resolve the difficulty of this high-dimensional multi-objective optimization problem, the conception of the distance metric in the metric space is introduced to unify the lift-drag ratio and the cavitation performance under different working conditions. And then, the above optimization method is applied in the NACA63-815 hydrofoilʼs optimal design under three typical conditions. Finally, the results from the performance comparison of the original and optimized hydrofoils obtained by using the CFD simulation are analyzed in detail. It is indicated that the optimized hydrofoils enjoy a better hydrodynamic performance than the original ones under the three conditions. The feasibility and the theoretical validity of this optimization method are confirmed by the results.
marine current turbine, hydrofoil, multi-point optimization, metric space, NSGA-II algorithm
Introduction
The gradual exhaustion of the fossil energy resources and the serious environment pollution force people to look for new energy sources, which must be economical and secure. The oceans represent a huge energy reservoir, and most of its energy can be exploited in several different ways. The ocean energies that can be exploited are in several different forms, including the wave energy, the marine current energy, and the tidal barrages. But what is most likely to be put into applications in a short term may be the wave energy and the marine current energy. Both of them involve the conversion of the kinetic energy of the moving water into power, without the need of impoundment or diversion of conventional hydroelectric facilities based on dams and therefore belong to the category of hydrokinetic energy conversion.
The marine current turbine is a mechanical device, used for the marine current energy conversion. The runner is the core component of a marine current turbine. Its blade consists of hydrofoils in different spans according to the pre-defined pitch angle distribution. So the important issue of a mariner current turbine is the performance of hydrofoils. The hydrodynamic characteristics of hydrofoils and marine current turbines were extensively studied. Xu[1]and Wang[2]studied the marine current turbineʼs hydrodynamic characteristics based on the Boltzmann method. Hyun et al.[3]studied the unsteady flow around a Darrieus-type turbine numerically. Luznik et al.[4]analyzed the effect of surface waves on the performance of a model marine current turbine by experiments. Zhao et al.[5]investigated the influence of the preset attack angle on the performance of a vertical-axis marine current turbine. Ma[6]designed a whole marine current energy conversion system and tested it under the actual working conditions. Goundar et al.[7]compared the lift-drag ratio performance of different kinds of hydrofoils. And the most prolific research group is the sustainableenergy research group at the University of Southampton, which is led by Professor Bahaj. The research group published a number of key papers on hydrofoil design, test and scale experiments of marine current turbine[8-12]. Their experimental data served as a foundation for many researchers. Furthermore, the optimization methods of hydrofoils were explored. Grasso[13]made a design optimization of hydrofoils based on the RFOIL solver and the sequential quadratic programming gradient based algorithm. Yang and Shu[14]improved the lift-drag ratio of the NACA0012 based on a CFD simulation and hierarchical fair competition genetic algorithms. Cocke et al.[15]optimized the lift-drag ratio of hydrofoils, used for the sailing craft based on CFD simulations and genetic algorithms.
From the above studies, it can be seen that the hydrofoils used for marine current turbines in all published papers were developed directly from an aerodynamic design or experiments without specifical considerations of the marine current turbines. And most of the optimum design methods for hydrofoils were focused on the hydrofoilʼs lift-drag ratio but not so much on the cavitation performance. So, it is necessary to explore a design optimization method which can take into account the lift-drag ratio and the cavitation performance simultaneously for hydrofoils to improve the performance of marine current turbines more efficiently.
With due consideration of the present stage of development in hydrofoils for marine current turbines, a multi-point design optimization method is proposed in this paper. In this method, the Bezier curve is used to parameterize the initial hydrofoil profile, and the geometry parameters are used as the variables for the optimum design. The concept of the distance metric in the metric space of functionals is introduced to unify the objectives of the lift-drag ratio and the cavitation performance under different attack angle conditions. And the two unified parameters are used as the objective functions. Finally, a nondominated sorting genetic algorithm II is put forward to solve this multi-objective optimization problem. With the optimization, the hydrofoil with a better performance and more suitable for marine current turbines can be obtained. The method mentioned above is applied to optimize the NACA63-815 in this paper to validate its feasibility and effectiveness.
1. Parameterization of hydrofoil
The parameterization of a hydrofoil should be made accurate and flexible. The Bezier curve based on Bernstein polynomials enjoys perfect smoothness and high order continuity, thus becomes one of the best choices in parameterization. A Bezier curve of the nth order is defined by
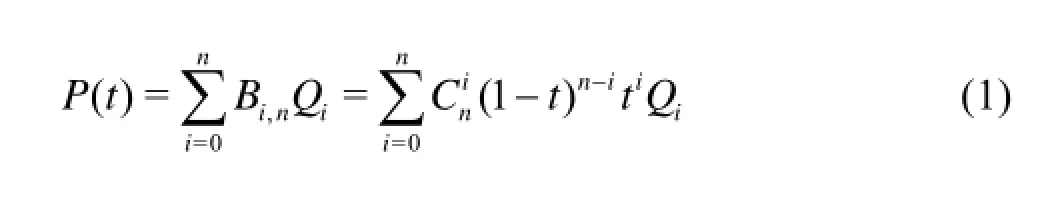
where P( t) is a point on the Bezier curve, t∈(0,1) is the weight coefficient of the point on the Bezier curve, Bi,nis the Bernstein basis function, Qiis the ith control vertex of the Bezier curve, and Cniis the combinatorial symbol.
The hydrofoil NACA63-815, used as the test hydrofoil in Ref.[8], is considered in this paper, and its chord length is 0.23 m. For a Bezier curve used to parameterize the shape of a hydrofoil, the higher the order of the curve the higher the precision of the shape fitting will be. By weighting the fitting precision and the number of control vertexes, two Bezier curves of degree six are used to parameterize the upper and lower curves of the hydrofoil profile, respectively. As shown in Fig.1, the points U1-U7are the control vertexes of the Bezier curve for fitting the upper curve of the original hydrofoil, and the points B1-B7are the control vertexes of the Bezier curve for fitting the lower curve of the original hydrofoil. According to the known data of the original hydrofoil profile, these control vertexes can be determined by the reverse calculation based on the least squares method.
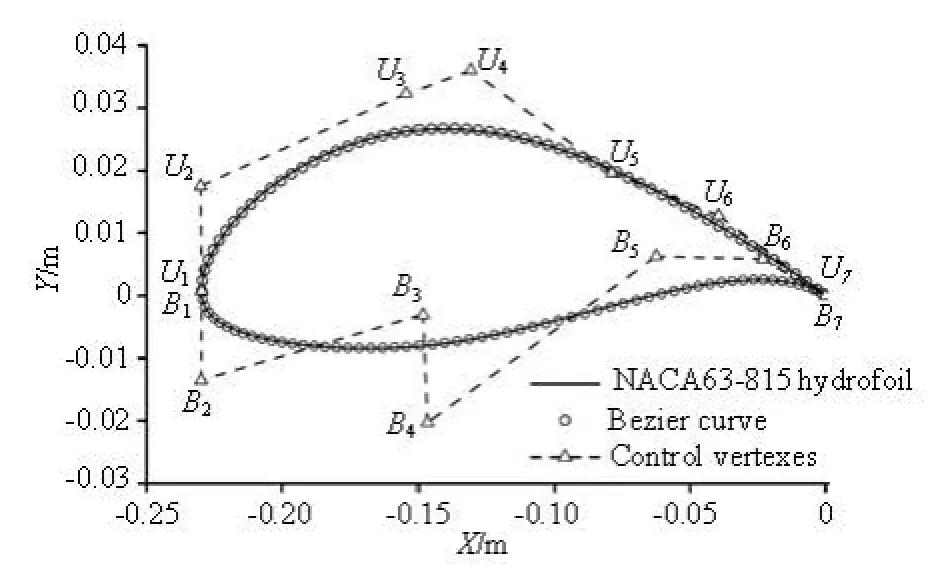
Fig.1 Parameterization of the hydrofoil NACA 63-815 using Bezier curve
In order to analyze the deviation of the hydrofoil fitting, the fitted curves of the original hydrofoil and the profile curves of the original hydrofoil are imported into the UG software. And the actual deviations of them are obtained according to the curve deviation analysis function of the UG. Then, the actual deviation values are normalized as
where Δi is the actual deviation value at point i on the fitted curves of the original hydrofoil, l is the actual chord length of the original hydrofoil, δ is thenormalized deviation at point i on the fitted curves of the original hydrofoil. Figure 2 shows the relationship between the normalized deviation and the relative chord length. In Fig.2, when the relative chord length is equal to 0, we come to the leading edge, and when the relative chord length is equal to 1, we come to the trailing edge.
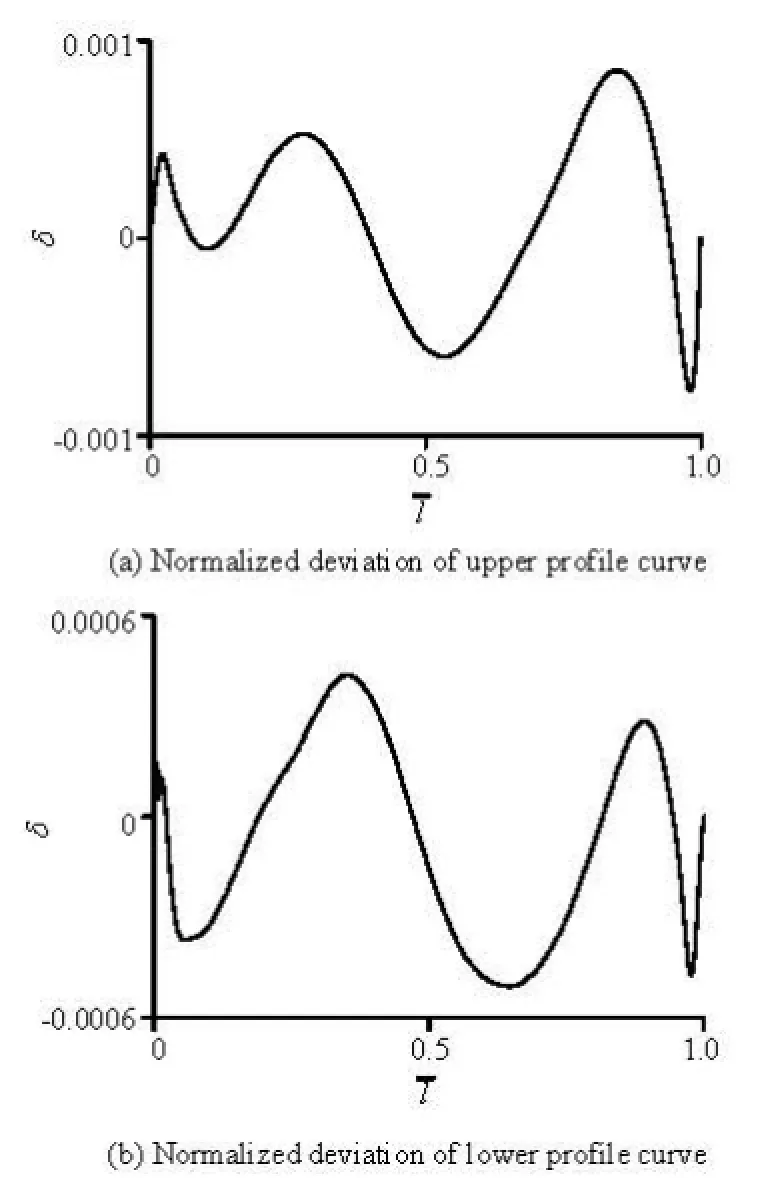
Fig.2 Normalized deviations of fitted profile curves of the original hydrofoil
From Fig.2, it can be seen that this parametric technology is accurate enough to represent the existing hydrofoil.
The number of design variables directly influences the sample sizes that need to be evaluated during the optimization. In order to expand the search space of the optimization, the vertexes U2, U3, U4, U5and the vertexes B2, B3, B4, B5which have significant influences on the hydrofoilʼs performance are chosen as independent control points. They can be varied during the optimization. On the other hand, the vertexes U1, U6, U7and the vertexes B1, B6, B7are fixed. For the purpose of reducing the number of design variables, the y-coordinates of the eight independent control points are chosen as the design variables while keeping their x-coordinates unchanged. Table 1 summarizes the design variables and their variation ranges on the basis of the original design.
In Table 1, UY2ori.-UY5ori.represent the initial y-coordinates of the control vertexes U2-U5, and BY2ori.-BY5ori.represent the initial y-coordinates of the control vertexes B2-B5.
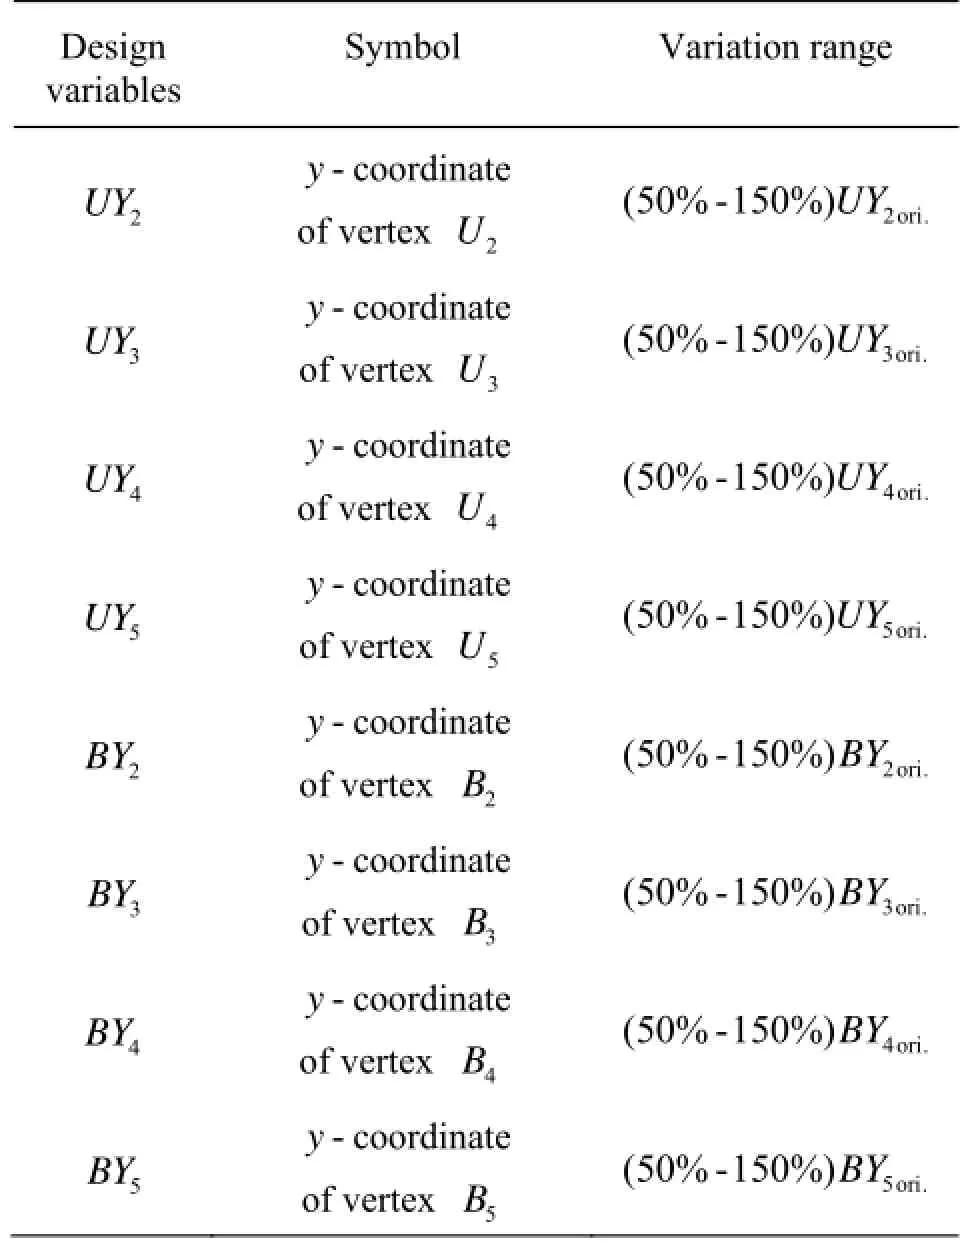
Table 1 Design variables of the hydrofoil
2. CFD Simulation method
The CFD simulation method is used to evaluate the hydrodynamic performance of the samples during the optimization. To simulate the far flow field condition, a semicircle connected with a rectangular region is chosen as the computation domain as shown in Fig.3.
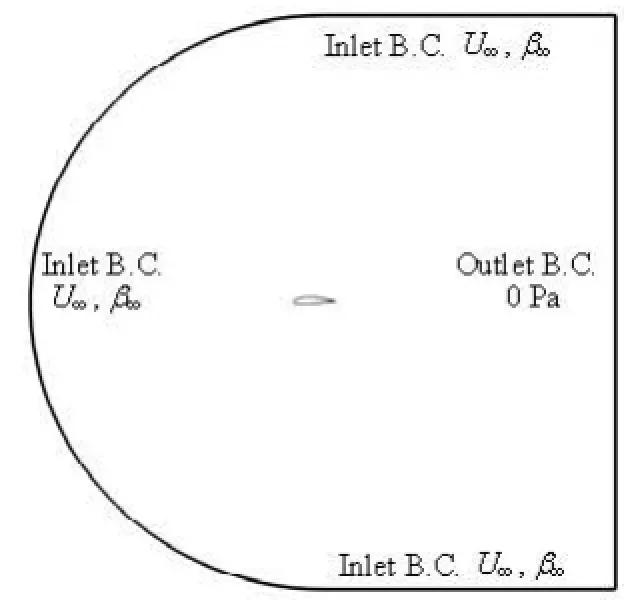
Fig.3 The computation domain
The radius of the semicircle is 10 times of the hydrofoilʼs chord. Both the length and the half width of the rectangular region are also 10 times of the hy-drofoilʼs chord. The boundary condition at the inlet is defined by the flow velocity U∞and the flow angle β∞. And the flow angle β∞is equal to the attack angle α which needs to be calculated. The relative pressure 0 Pa is specified at the outlet, and the nonslip solid boundary condition is adopted on the hydrofoil surface. The reference pressure of the whole computation domain is set to be0P, shown as
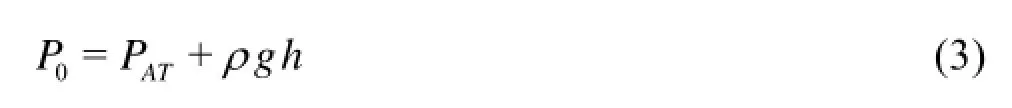
where PATis 1 atm, ρ is the fluid density, h is the ocean depth in which the hydrofoil works. In order to compare with the experimental data in Ref.[8], h is set to 0 m. So the reference pressure P0is equal to PAT, which is 1 atm. For the same purpose, the Reynolds number of the flow field is set to be 0.8×10⁶and the velocity at the inlet is set to be 4 m/s.
In order to obtain accurate details of the flow around the hydrofoil, the SST k-ω turbulence model is imported to close the Navier-Stokes equations. And then the Navier-Stokes equations can be solved by the finite volume method. As the SST k-ω turbulence model has a strict requirement over the grid, the C type grid is generated in the computation domain, and the first layer which is close to the hydrofoil surface is set to be 10-6m. The grids are shown in Fig.4. The total number of grids on the hydrofoil surface is 236 and the total number of grids in the whole computation domain is 46 410.
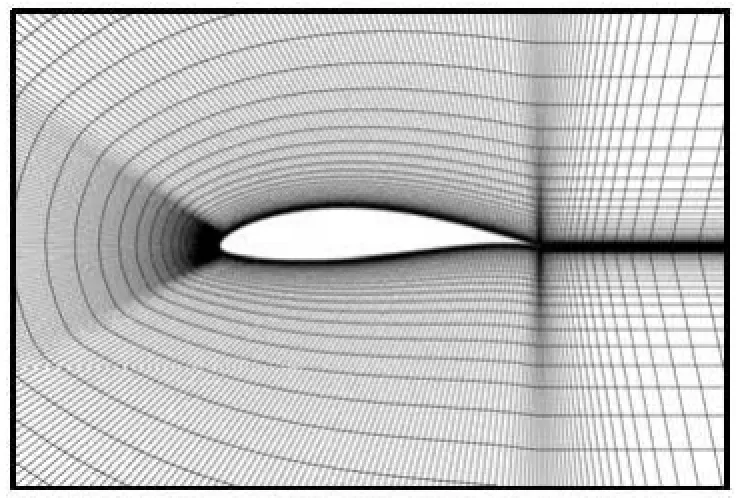
Fig.4 The local grids around the hydrofoil
In the simulation, the convergence criterion is that the maximal residual is less than 10-4. Thus, after the simulation, the maximum value of+y on the hydrofoil surface is 0.767, which is enough to satisfy the requirement of the SST kω- turbulence model. For a further validation of the CFD simulation, the lift and drag coefficients of the original hydrofoil NACA63-815 are calculated by the CFD at a Reynolds number of 0.8×10⁶, and the CFD results are compared with the experiment data as shown in Fig.5. The lift and drag coefficients of the hydrofoil are expressed as
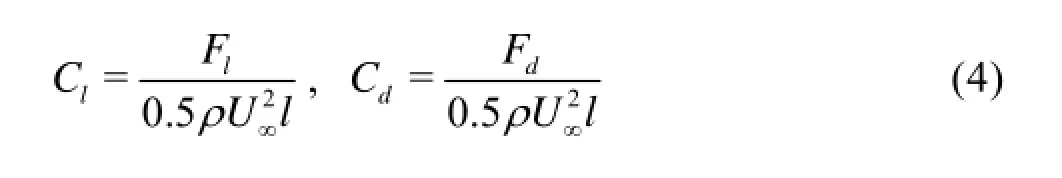
where Flis the lift force, Fdis the drag force.
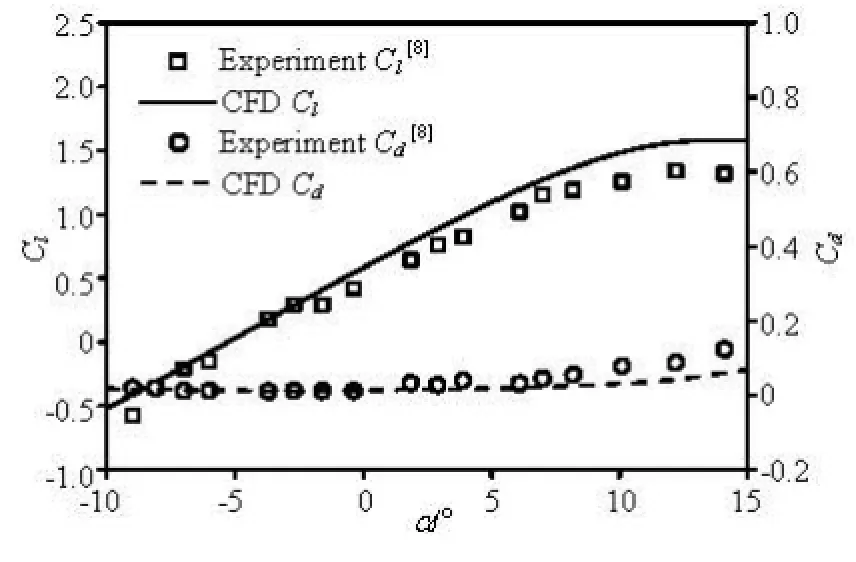
Fig.5 Comparison of the lift and drag coefficients between the CFD and experimental data
As shown in Fig.5, the CFD results of the lift and drag coefficients agree well with the experimental data. Besides, as shown in Fig.6, the pressure coefficient distribution on the hydrofoil surface is also calculated to compare with the experimental data in Ref.[8] to validate the accuracy of the CFD simulation. The pressure coefficient is expressed as

where PLis the absolute pressure on the hydrofoil surface.
From Fig.6, it can be seen that the CFD results of the pressure coefficient distribution also agree well with the experimental data. It also confirms that the CFD simulation enjoys a desired accuracy to satisfy this researchʼs requirements. The topology and the node distribution of grids can be recorded by the Tcl language contained in the ICEM CFD. And then, during the optimization process, for the purpose of generating grids automatically, these Tcl languages can be run according to the calling in the batch files. The CFD simulation can also be implemented automatically in the batch mode according to the calling in the batch files. Therefore, during the optimization process, both the grid generation and the CFD simulation of each sample can be implemented automatically in the batch mode. All of these provide a precondition for the optimization process integration.
3. Multi-point optimization problem

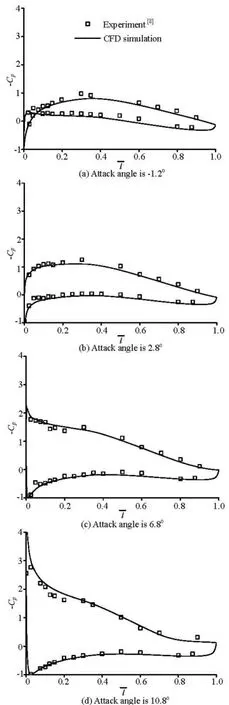
Fig.6 Comparison of the pressure coefficient distribution at different attack angles between the CFD and experimental results
For any individual sample n in the design space X, there correspondingly exists a set of the lift-drag ratios fnand a set of the minimum pressure coefficients gnas follows
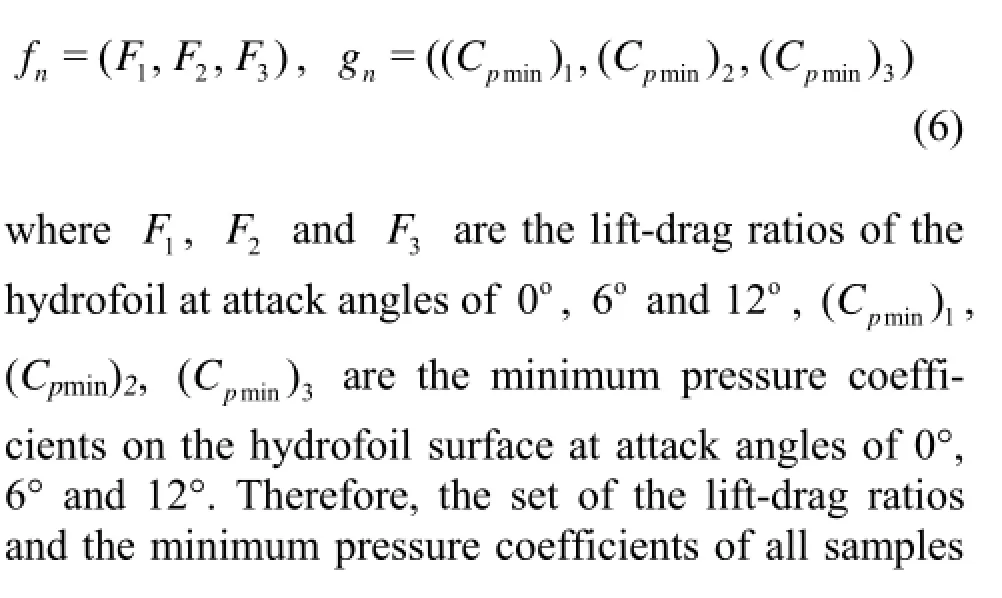
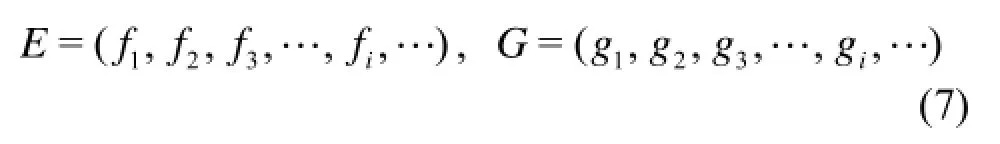
Fig.7 The flowchart of optimization
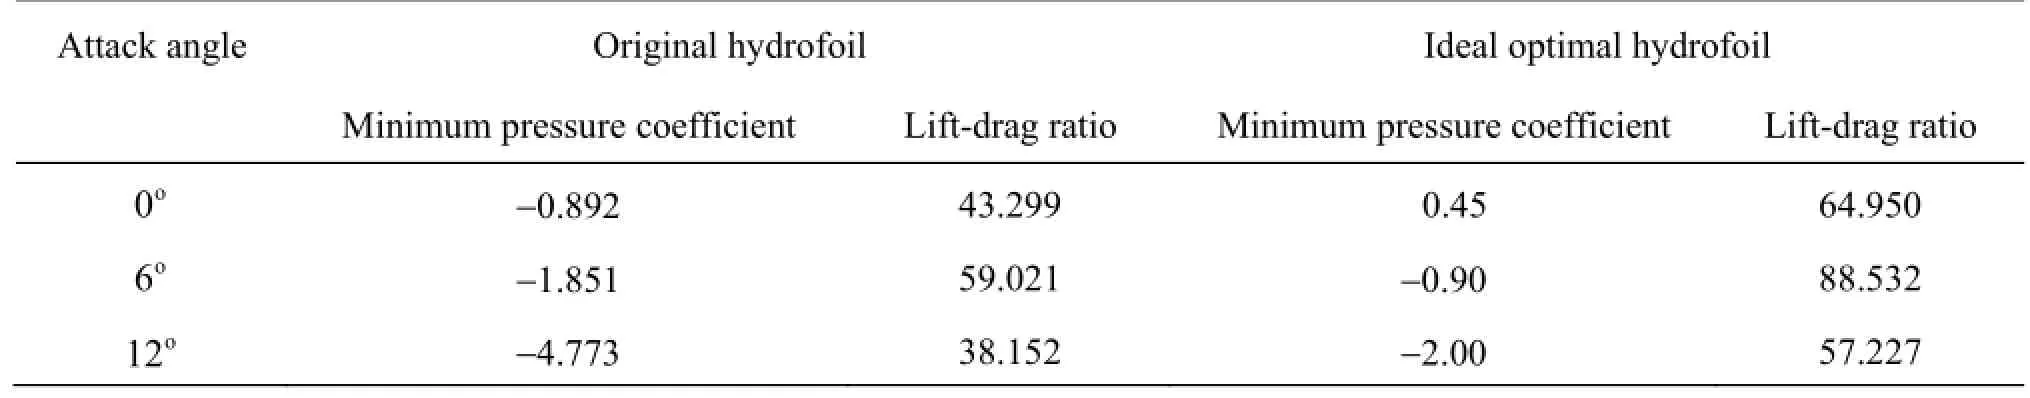
Table 2 The performance parameters of original and ideal optimal hydrofoils
where E is the performance space of the lift-drag ratios, G is the performance space of the minimum pressure coefficients, fiis the set of the lift-drag ratios of sample i, i=(1,2,3…), giis the set of the minimum pressure coefficients of sample i, i=(1,2, 3…). Both fiand giare sets of real numbers. So, the spaces E and G which are established by fiand giare real spaces. That is:
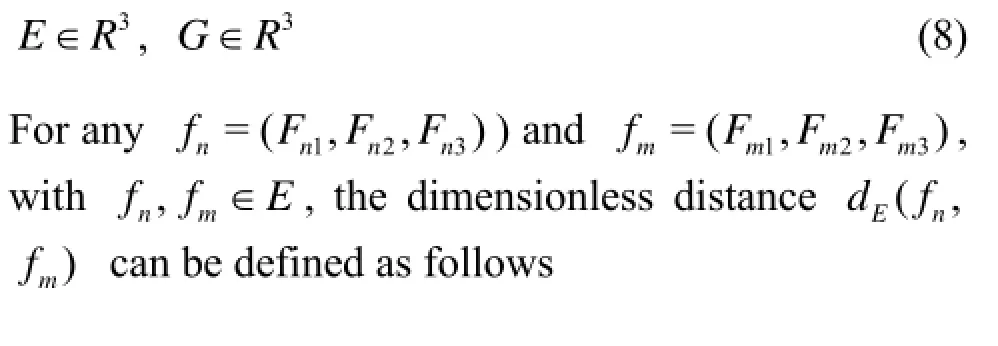
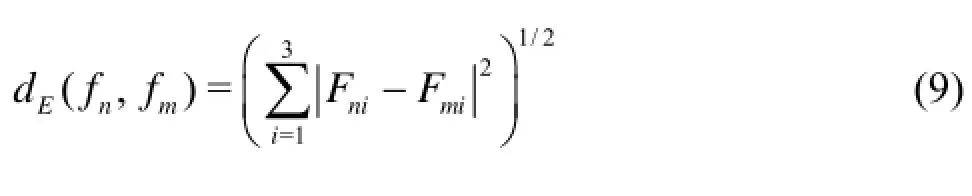
The formula (9) is the standard formula of Euclidean distance[17]. So it certainly satisfies the properties of non-negativity, symmetry and triangle inequality. And then the space E of course can be proved to be a metric space.
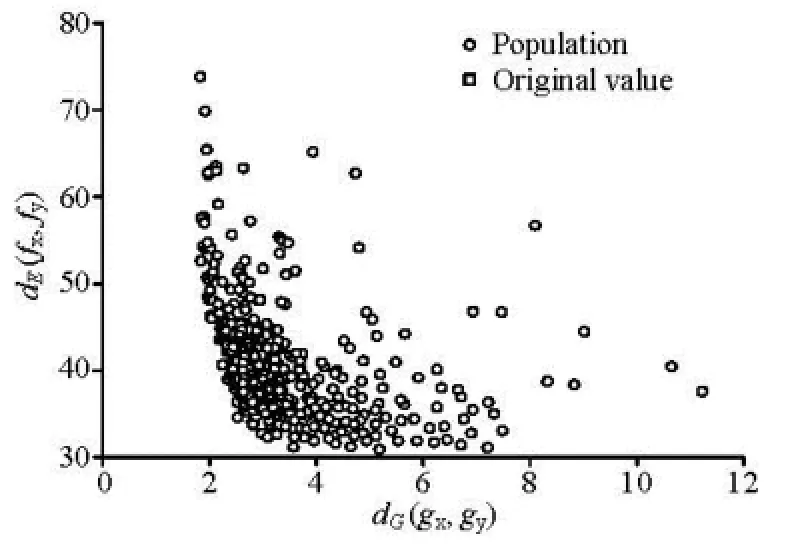
Fig.8 Distribution of population in the objective function space
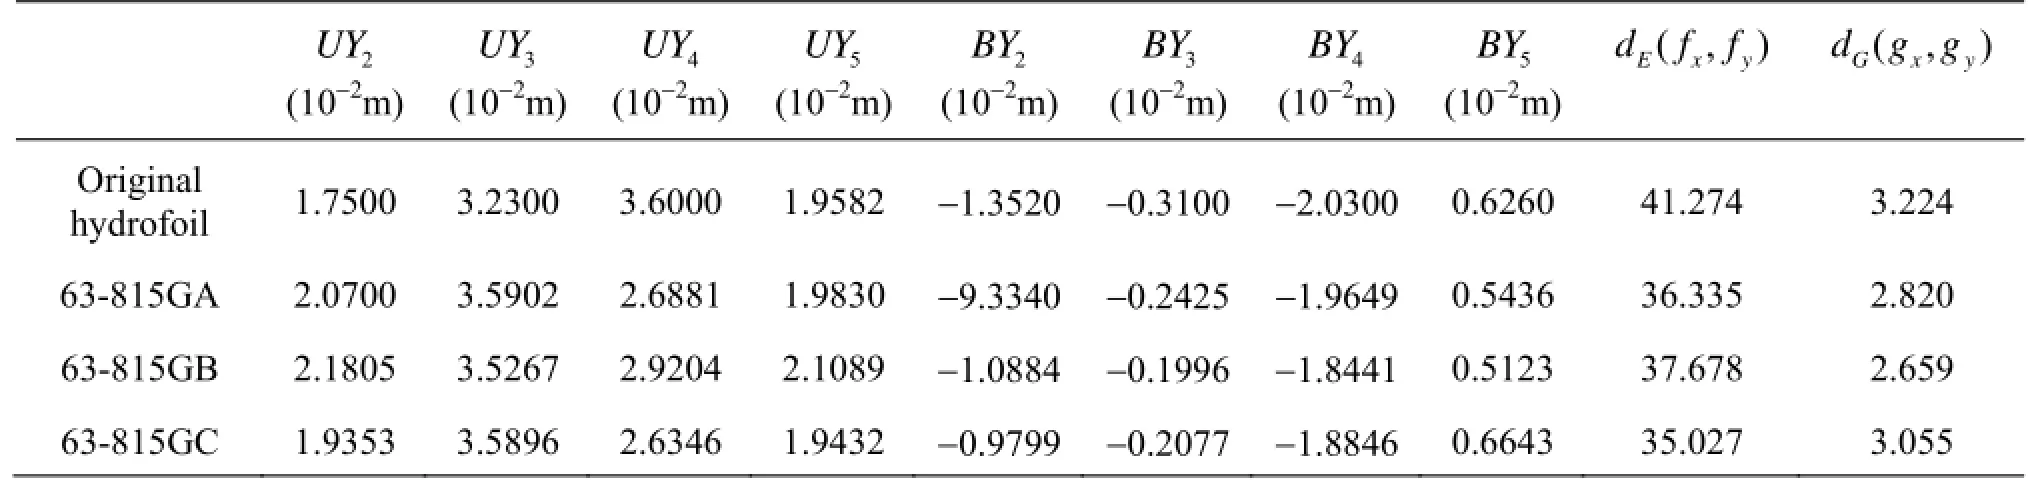
Table 3 Parameters comparison of optimized and original hydrofoil
Similar to the space E, it can be proved that the space G is a metric space.
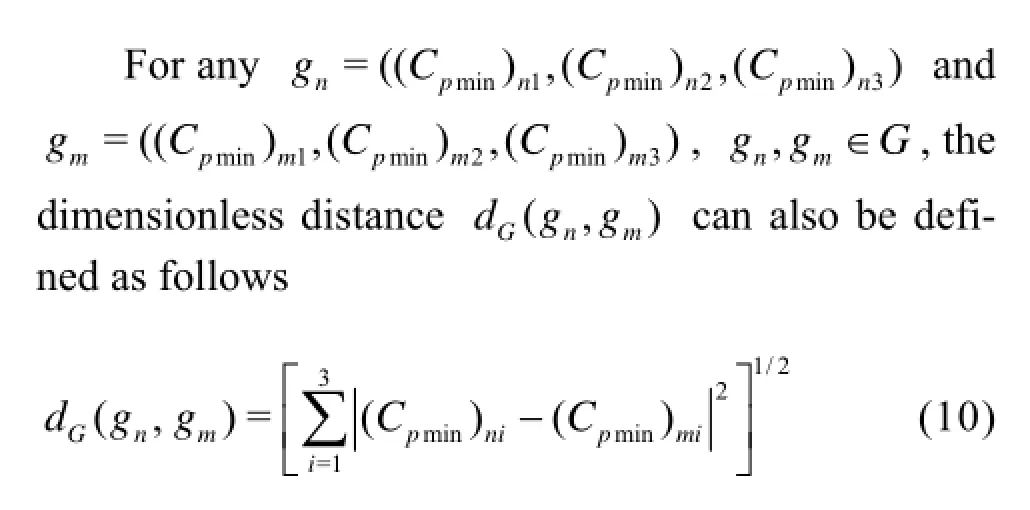
Assume that the ideal optimal solution in the design space X is y. And the sets of the lift-drag ratios and the minimum pressure coefficients of y are fyand gy. Then the multi-point optimization problem of the hydrofoil can be converted to a simple problem, that is, to find a solution x in the design space to make the dimensionless distances dE(fx,fy) and dG(gx,gy) minimum. dE(fx,fy) represents the lift-drag ratio performance gap of solutions x and y. And dG(gx,gy) represents the cavitation performance gap of solutions x and y. Therefore, the smaller the values of dE(fx,fy) and dG(gx,gy), the better the performance of the solution x will be. After the conversion of the optimization problem, the number of objects is changed from 6 to 2, which mitigates the complexity and difficulty of the optimization process considerabaly.
With respects to the structural and strength requirements of the marine current turbine blade, the section area of the hydrofoil is selected as a constraint. In order to comprehensively improve the cavitation performance of the hydrofoil, the minimum pressure coefficient of the hydrofoil must be required to be greater than the initial one in the process of optimization. Meanwhile, the drag coefficient is undesirably higher than the initial one. Then, the optimum proposition can be described as follows:

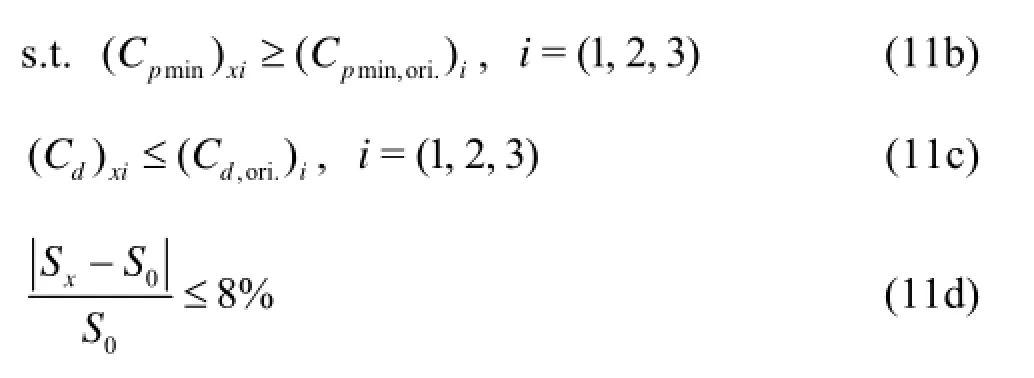
where x is a solution in the design space, y is the ideal optimal solution, fxand fyare the sets of the lift-drag ratios of x and y, gxand gyare the sets of the minimum pressure coefficients of x and y, (Cpmin)xiis the minimum pressure coefficient on the hydrofoil surface of the solution x at the attack angle of 0o, 6oand 12o, (Cpmin,ori.)iis the minimum pressure coefficient on the original hydrofoil surface at the attack angle of 0o, 6oand 12o, (Cd)xiis the drag coefficient of the hydrofoil of the solution x at the attack angle of 0o, 6oand 12o, (Cd,ori.)iis the drag coefficient of the original hydrofoil at the attack angle of 0o, 6oand, Sxand S0are the section areas of the hydrofoil of the solution x and the original one.
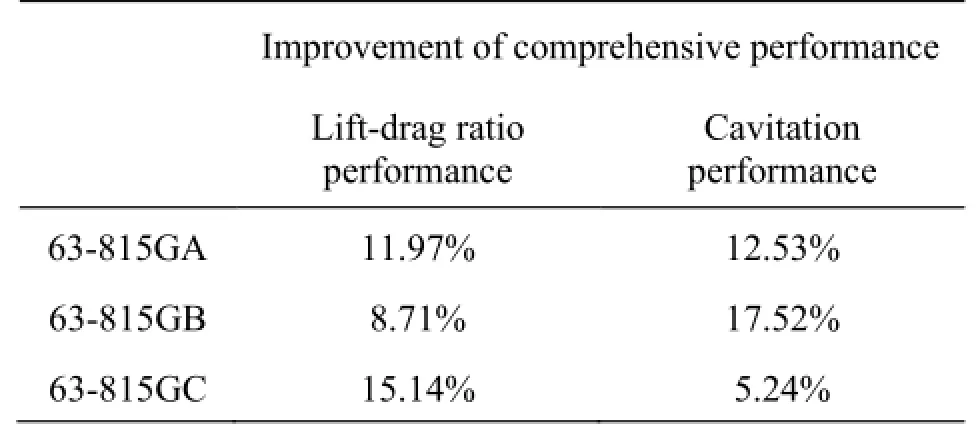
Table 4 The percentage of performance improvement
The parameterization of the hydrofoil and the calculation of the two objects are completed by FORTRAN programs. The grid generation and the CFD simulation are implemented automatically by calling batch files. Then, the FORTRAN programs and the batch files are integrated into the NSGA-II algorithm with the flowchart as shown in Fig.7.
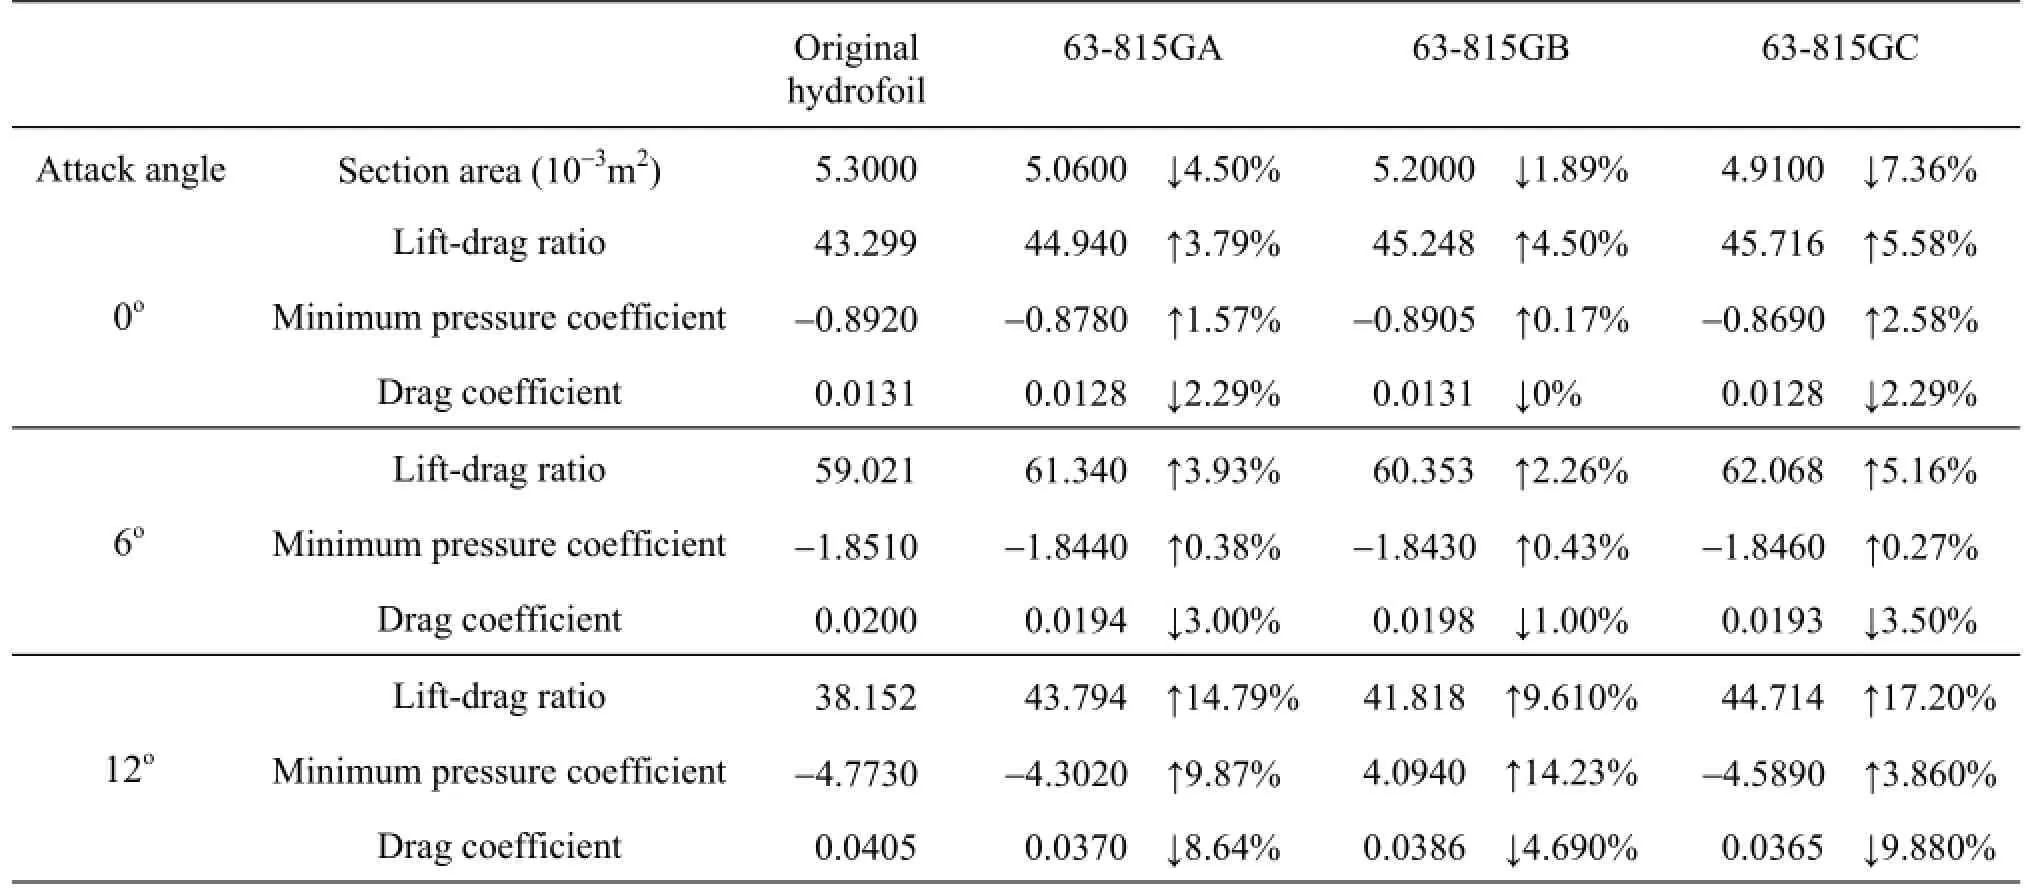
Table 5 Detailed performance comparison of optimized and original hydrofoils
4. Results and discussions
Before optimization, the performance of the original NACA63-815 hydrofoil is determined by the CFD simulation. On this basis, and according to the requirements of the design optimization, the sets of the lift-drag ratios and the minimum pressure coefficients of the ideal optimal hydrofoil can be defined. According to the sets of the lift-drag ratios and the minimum pressure coefficients of the ideal optimal hydrofoil, the design optimization can be directed toward the desired direction. The performance parameters of the original and ideal optimal hydrofoils are shown in Table 2.
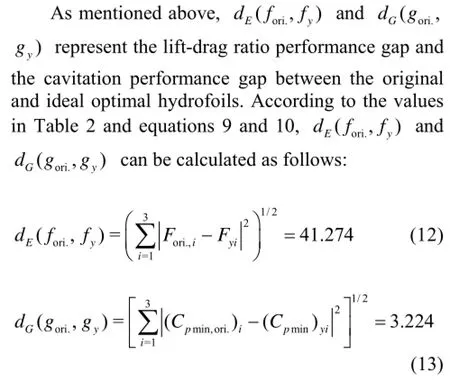
where fori.and gori.are the sets of the lift-drag ratios and the minimum pressure coefficients of the original hydrofoil, fyand gyare the sets of the liftdrag ratios and the minimum pressure coefficients of the ideal optimal hydrofoil, Fori.,iand (Cpmin,ori.)iare the lift-drag ratios and the minimum pressure coefficients of the original hydrofoil at three attack angles, Fyiand (Cpmin)yiare the lift-drag ratios and the minimum pressure coefficients of the ideal optimal hydrofoil at three attack angles. Therefore, dE(fori.,fy) and dG(gori.,gy) are the original values of the optimization problem defined by Eq.(11). In the process of optimization, the population size in the NSGA-II algorithm is set to be 60, and the number of generation is set to be 30. The crossover and mutation probabilities are set to be 0.8. The distribution of population in the objective function space is shown in Fig.8.
As shown in Fig.8, the evolutionary direction of the whole population is clear, and the optimal strategy makes a large portion of the population better than the original one. After the whole process of optimization is completed, a group of Pareto solutions is selected from the feasible solutions by an algorithm. Three typical optimized hydrofoils are selected to compare with the original. These three optimized hydrofoils are named 63-815GA, 63-815GB and 63-815GC, respectively. The geometrical parameters and the objective functions of these three optimized hydrofoils are compared with the original ones in Table 3. As shown in Table 3, the dimensionless distances dE(fx,fy) and dG(gx,gy) of the three optimized hydrofoil are less than the original ones, which means that the comprehensive lift-drag ratio and the cavitation performance of the optimized hydrofoils are better than the original ones. And the decreased extent of the dimensionless distances also represents the extent of the hydrofoilʼs performance improvement.
According to the values in Table 3, the percentage of improvement about the comprehensive liftdrag ratio and cavitation performance can be calculated. And as shown in Table 4, it can be concluded that the performance improvement of 63-815GA is in a manner of balance. The performance improvement of 63-815GB focuses on the cavitation and that of 63-815GC focuses on the lift-drag ratio. Each of these three optimized hydrofoils have their own characteristics. To analyze the cause, all of them should be compared with the original hydrofoil in detail.
In order to compare the optimized hydrofoils with the original one in detail, the detailed performance data of the optimized and original hydrofoils are shown in Table 5, where the percentage of all performance improvement is also shown.
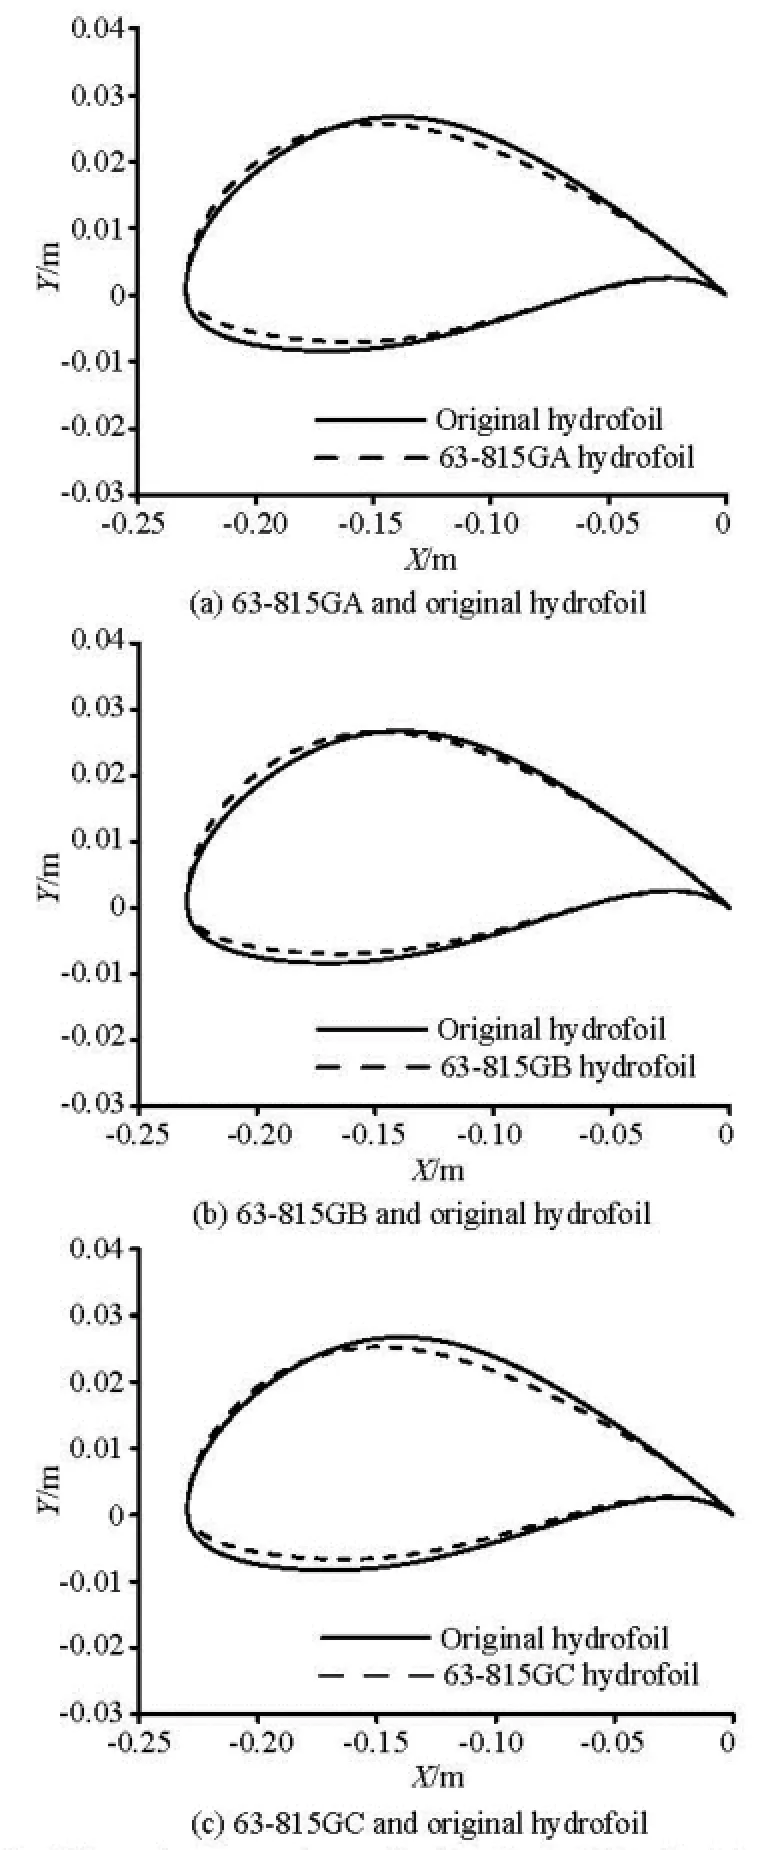
Fig.9 Geometry comparisons of optimal hydrofoil and original hydrofoil
As shown in Table 5, the three optimized hydrofoils have better lift-drag ratio and cavitation performances than the original ones under all three attack angle conditions. And the drag coefficients of the three optimized hydrofoils under the three attack angle conditions are smaller than the original one. These results indicate that all three optimized hydrofoils satisfy the requirements of optimization. Besides, the minimum pressure coefficient on the optimized hydrofoil surface has the maximum improvement at the attack angle ofo12, which is the critical stall angle of attack. And it is of great benefit to expand the hydrofoilʼs stable operation range. The geometry comparison of the three optimized hydrofoils with the original one are shown in Fig.9.
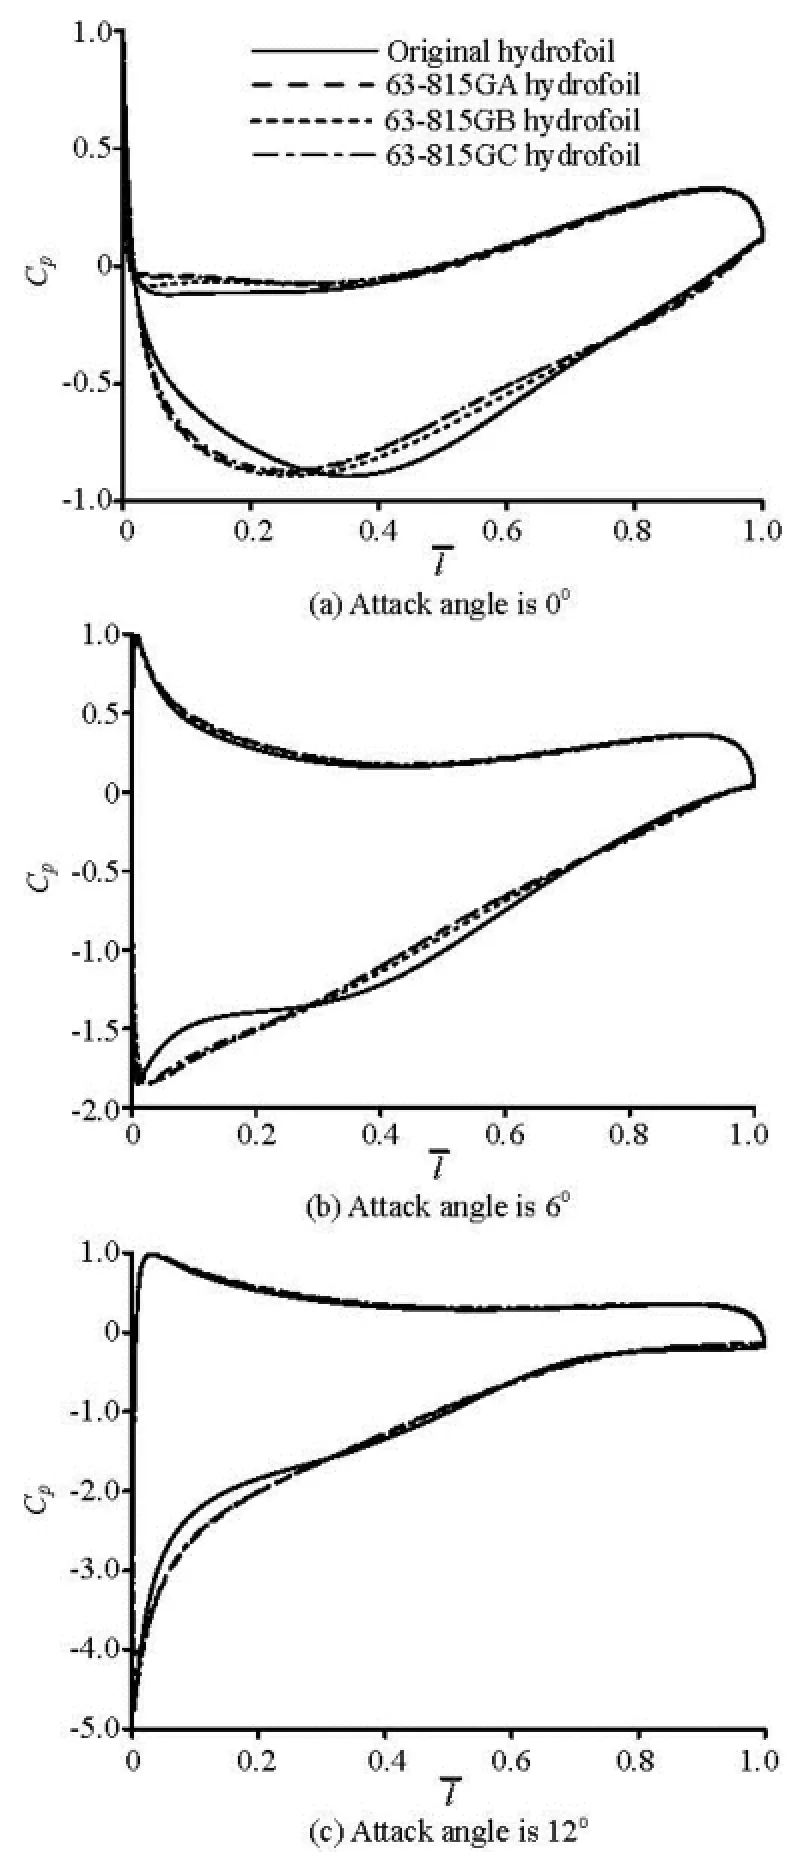
Fig.10 Pressure coefficient comparisons of optimal hydrofoil and original hydrofoil
As shown in Fig.9, the curvature radii near the leading edge of all optimized hydrofoils are increased and the thicknesses of the lower half of all optimized hydrofoils are reduced. Meanwhile, the maximum thickness points of these three optimized hydrofoils are all moved forward. From Table 5, it can be seen that 63-815GC has the minimum section area among the three optimized hydrofoils, and it leads to the minimum drag coefficient of 63-815GC among the three optimized hydrofoils. 63-815GB has the maximum section area which leads to the maximum drag coefficient among the three optimized hydrofoils. For the purpose of analyzing how the geometrical change influences the hydrofoilʼs performance, the comparison of the pressure coefficient on the hydrofoil surface between the optimized and original hydrofoils at three attack angles are shown in Fig.10.
It can be seen from Fig.10 that the increase of curvature radii near the leading edge leads to the increase of the pressure difference in the front part of the optimized hydrofoils, which is of great benefit to the lift coefficient. In the meanwhile, as shown in Fig.10, the pressure distributions around the optimized hydrofoils are more even than the original one, which means that the stress distributions on the optimized hydrofoil section are better than the original one. In the part of 0%-20% of the relative chord length, the adverse pressure gradients on the upper surface of the optimized hydrofoils are smoother than the original one, which is beneficial for delaying the stall. In order to comprehensively compare the optimized hydrofoils with the original one, the lift-drag ratio and the minimum pressure coefficient of the optimized hydrofoils are calculated by the CFD. And the attack angles calculated by the CFD range from 0oto 15o. The results are compared with the original one in Fig.11. As shown in Fig.11(a), the lift-drag ratios of the three optimized hydrofoils are all improved. And the lift-drag ratios of 63-815GC has the maximum improvement among the three optimized hydrofoils.
The criterion of the cavitation performance evaluation is the minimum pressure coefficient on the hydrofoil surface. The higher the minimum pressure coefficient, the better the cavitation performance. As shown in Fig.11(b), the cavitation performance of the three optimized hydrofoils has a slight improvement when the attack angle is in the range of 0oto 6o. It means that when the attack angle is small, the change of the hydrofoilʼs geometry does not have much effect on the cavitation performance of the hydrofoil. But when the attack angle is greater than 6o, the cavitation performance of the three optimized hydrofoils are significantly better than the original one. And 63-815GB has the best cavitation performance among the three optimized hydrofoils.
According to the comprehensive comparison, it can be concluded that all the optimized hydrofoils have better lift-drag ratio and cavitation performance than the original one. Among the optimized hydrofoils, 63-815GC has the best lift-drag ratio performance and 63-815GB has the best cavitation performance. The performance of 63-815GA is in between them.
5. Conclusions
A multi-point optimization method is proposed for the hydrofoil in this paper. In addition to maximizing the lift-drag ratio of the hydrofoil, the minimum pressure coefficient on the hydrofoil surface which represents the cavitation performance is also required in the optimization. According to the analysis of the results, several conclusions can be drawn as follows:
(1) In the optimization, with the introduction of the distance metric in the metric space, the lift-drag ratio and the minimum pressure coefficient under different working conditions are unified, which effectively reduces the number of objective functions and thus reduces the complexity of the optimization. Therefore, this method can be used to resolve the highdimensional multi-objective optimization problem in hydroturbines.
(2) The multi-point optimization method proposed in this paper effectively improves the lift-drag performance of the hydrofoil in the operating range of 0oto 15oof the attack angle. The cavitation perfor-mance is mainly improved in the range of 6oto 15o, with little improvement in the range of 0oto 6o.
(3) The solution of the hydrofoilʼs multi-point optimization problem is not unique. In this paper, three optimized hydrofoils have different performance characteristics, but all of them are better than the original one. Therefore, the designer of the marine current turbine blade can select the final optimized hydrofoil on the basis of specific requirements, such as focusing on the lift-drag ratio or on the cavitation performance. Thus the designer can make the turbine blade design more to his purpose.
[1] XU Chao. Research on hydrodynamics of marine current turbineʼs hydrofoil blades based on lattice Boltzmann method[D]. Master Thesis, Qingdao, China: Ocean University of China, 2010(in Chinese).
[2] WANG Ying-ying, Research on lattice Boltzmann simulation on high Reynolds number flow around marine current turbine[D]. Master Thesis, Qingdao, China: Ocean University of China, 2011(in Chinese).
[3] HYUN B.-S., CHOI D.-H. and HAN J.-S. et al. Performance analysis and design of vertical axis tidal stream turbine[J]. Journal of Shipping and Ocean Engineering, 2012, 4(2): 191-200.
[4] LUZNIK L., FLACK K. A. and LUST E. E. et al. The effect of surface waves on the performance characteristics of a model tidal turbine[J]. Renewable Energy, 2012, 58: 108-114.
[5] ZHAO Guang, YANG Ran-sheng and LIU Yan et al. Hydrodynamic performance of a vertical-axis tidal-current turbine with different preset angles of attack[J]. Journal of Hydrodynamics, 2013, 25(2): 280-287.
[6] MA Sun, LI Wei and LIU Hong-wei et al. Experimental investigation of a horizontal axial tidal current energy conversion system[C]. International Ocean Energy Symposium 2009. Harbin, China, 2009, 32-36.
[7] GOUNDAR J. N., AHMED M. R. and LEE Y.-H. Numerical and experimental studies on hydrofoils for marine current turbines[J]. Renewable Energy, 2012, 42: 173-179.
[8] MOLLAND A. F., BAHAJ A. S. and CHAPLIN J. R. et al. Measurements and predictions of forces, pressures and cavitation on 2-D sections suitable for marine current turbines[J]. Proceedings of the Institution of Mechanical Engineers, Part M: Journal of Engineering for the Maritime Environment, 2004, 218(2): 127-138.
[9] BAHAJ A. S., MOLLAND A. F. and CHAPLIN J. R. et al. Power and thrust measurements of marine current turbines under various hydrodynamic flow conditions in a cavitation tunnel and a towing tank[J]. Renewable Energy, 2007, 32(3): 407-426.
[10] BATTEN W. M. J., BAHAJ A. S. and MOLLAND A. F. et al. The prediction of the hydrodynamic performance of marine current turbines[J]. Renewable Energy, 2008, 33(5): 1085-1096.
[11] BATTEN W. M. J., BAHAJ A. S. and MOLLAND A. F. et al. Experimentally validated numerical method for the hydrodynamic design of horizontal axis tidal turbines[J]. Ocean Energy, 2007, 34(7): 1013-1020.
[12] BAHAJ A. S., BATTEN W. M. J. and MCCANN G. Experimental verifications of numerical predictions for the hydrodynamic performance of horizontal axis marine current turbines[J]. Renewable Energy, 2007, 32(15): 2479-2490.
[13] GRASSO F. Design and optimization of tidal turbine airfoil[C]. 29th AIAA Applied Aerodynamics Conference. Honolulu, Hawaii, USA, 2011.
[14] YANG B., SHU X. W. Hydrofoil optimization and experimental validation in helical vertical axis turbine for power generation from marine current[J]. Ocean Engineering, 2012, 42: 35-46.
[15] COCKE T., MOSCICKI Z. and AGARWAL R. Optimization of hydrofoils using a genetic algorithm[C]. 30th AIAA Applied Aerodynamics Conference. New Orleans, USA, 2012.
[16] GONG Mao-guo, JIAO Li-cheng and YANG Dongdong et al. Research on evolutionary multi-objective optimization algorithms[J]. Journal of Software, 2009, 20(2): 271-289(in Chinese).
[17] XUE Xiao-ping, SUN Li-min and WU Li-zhong. Applied functional analysis[M]. Beijing, China: Publishing House of Electronics Industry, 2006, 42-43(in Chinese).
10.1016/S1001-6058(14)60089-5
* Project supported by the Key Program of National Natural Science Foundation of China (Grant No. 51339005), the National Natural Science Foundation of China (Grant Nos. 51379174, 51279160) and the Doctoral Fund of Ministry of Education of China (Grant No. 20126118130002).
Biography: LUO Xing-qi (1962- ), Male, Ph. D., Professor
猜你喜欢
杂志排行

水动力学研究与进展 B辑的其它文章
- Retard function and ship motions with forward speed in time-domain*
- An iterative Rankine boundary element method for wave diffraction of a ship with forward speed*
- Sediment rarefaction resuspension and contaminant release under tidal currents*
- Stability of fluid flow in a Brinkman porous medium-A numerical study*
- Vadose-zone moisture dynamics under radiation boundary conditions during a drying process*
- Experimental and numerical study on hydrodynamics of riparian vegetation*