AltBOC navigation signal quality assessment and measurement*
2013-11-01MENGQingfeng孟庆丰JIAOGuotai焦国太XUEQiangqiang薛强强
MENG Qing-feng(孟庆丰), JIAO Guo-tai(焦国太), XUE Qiang-qiang(薛强强)
(1. Robotics Research Center, North University of China, Taiyuan 030051, China;2. College of Mechatronics Engineering, North University of China, Taiyuan 030051, China)
AltBOC navigation signal quality assessment and measurement*
MENG Qing-feng(孟庆丰)1,2, JIAO Guo-tai(焦国太)1, XUE Qiang-qiang(薛强强)2
(1. Robotics Research Center, North University of China, Taiyuan 030051, China;2. College of Mechatronics Engineering, North University of China, Taiyuan 030051, China)
In order to ensure that Chinese BeiDou satellite navigation system runs smoothly, the assessment of signal quality has become a significant task. Alternative binary offset carrier (AltBOC) is BeiDou B2 frequency signal. The acquisition of BeiDou signal is processed in off-line mode and the evaluation is performed by taking signal power spectrum, eye diagram, constellation, correlation, loss and s-curve deviation on AltBOC as signal quality evaluation parameters. The results illustrate that the new system signal, namely AltBOC signal, has the best performance in code tracking precision, anti-jamming and anti-multipath.
TN911.7signal quality assessment; alternative binary offset carrier(Alt-BOC); correlation loss;s-curve bias
0 Introduction
With the development of satellite navigation technology, global navigation satellite system (GNSS), a constellation of satellites providing signals from space transmitting, positioning and timing data, is widely used in the fields of military and civil applications. To meet higher and higher demands of users, the navigation system has been greatly improved in navigation signals based on alternative binary offset carrier (AltBOC) modulated signals.
The quality of GNSS signals directly affects the performance of navigation system. Thus signal evaluation method is a predominant consideration than signal validation. Not only for in-orbit test before the commencement of formal system running, but also for long-term monitoring for navigation signals as well as results evaluation after formal system running, it is important to evaluate signal quality and analyze test methods in order to construct an independent signal quality monitoring and evaluation system[1].
1 Scheme of signal quality assessment
This paper mainly uses GNSS baseband signal quality evaluation technique and performs in-orbit satellite signal quality evaluation in off-line way. By using a series of effective parameters, we assess the baseband signal quality and the effects of the designed system hardware and transmission channel process on signal quality. Thus we can evaluate the effect of signal distortion on navigation performance. Signal quality evaluation scheme is shown in Fig.1.
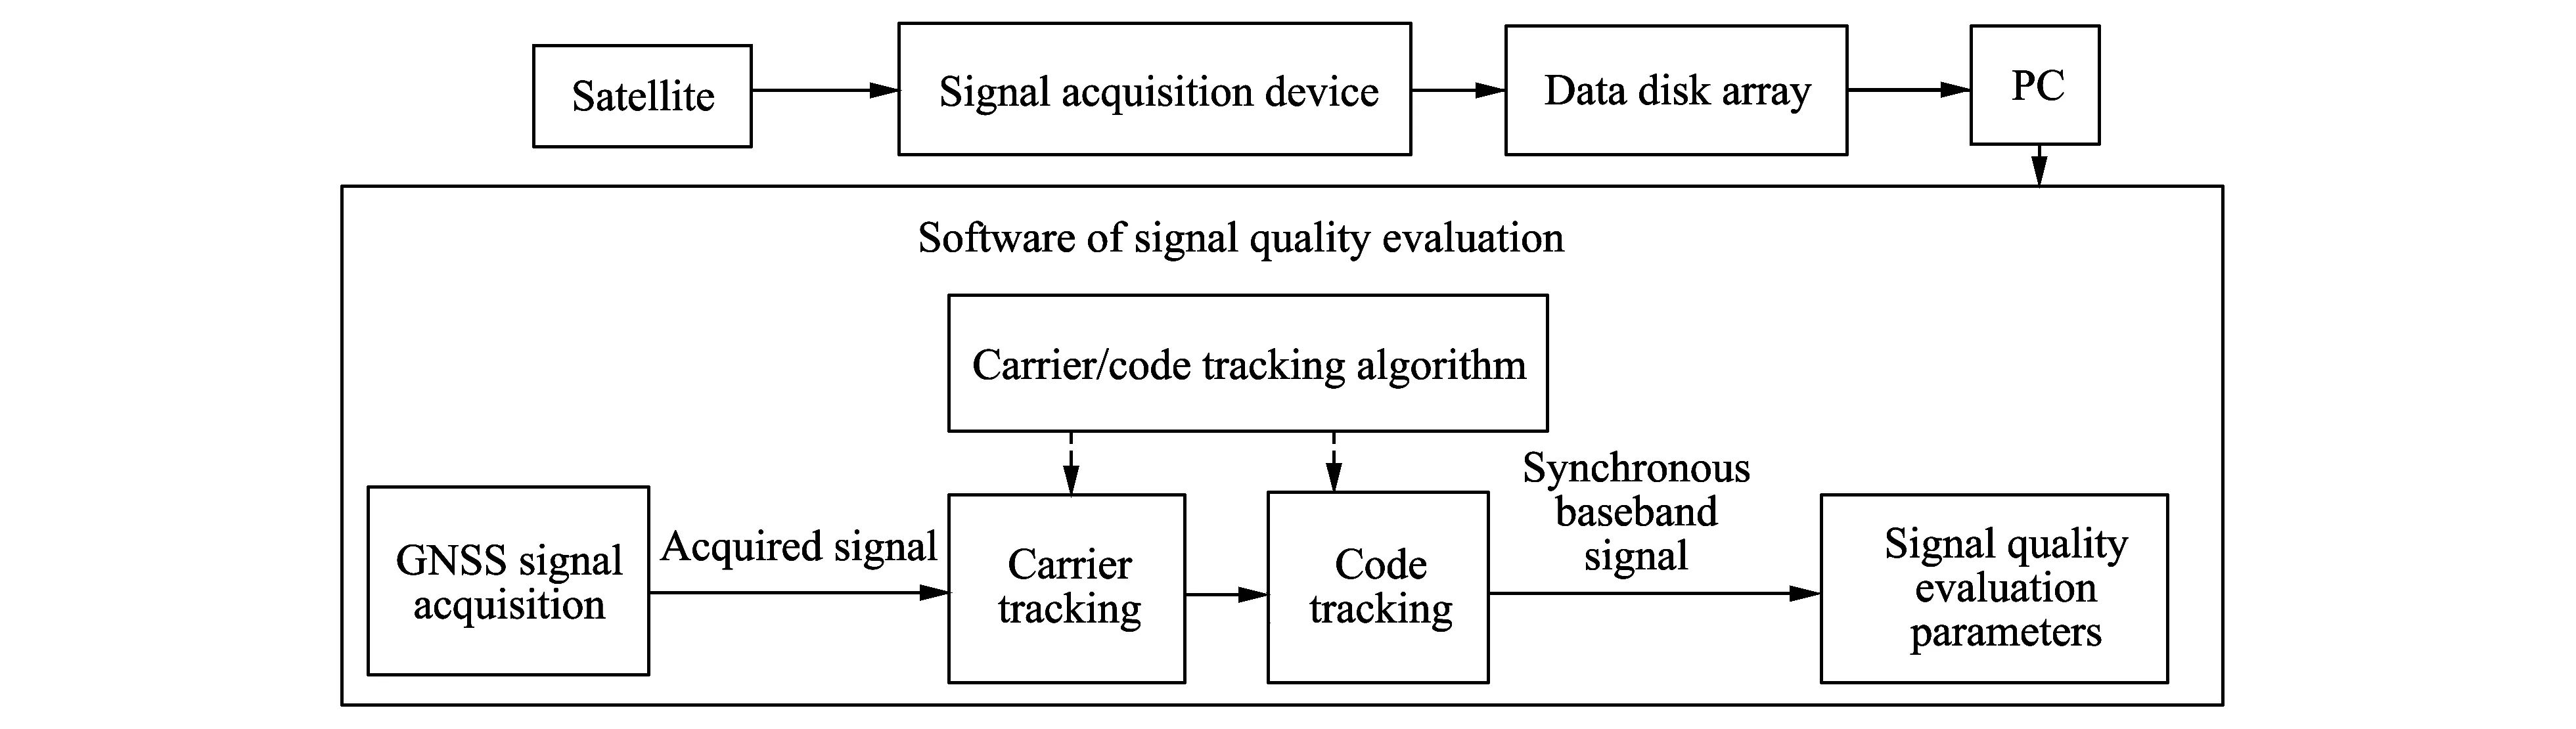
Fig.1 Block diagram of signal quality evaluation system
This paper analyses the B2 frequency band signal, which is analog signal source, collected by signal acquisition device. The sampling rate is 500 MHz, and B2 signal includes B2a of 1 176.45 MHz and B2b of 1 207.14 MHz[1].
2 Signal quality evaluation parameters and test results
2.1 Power spectrum
We use Welch cycle diagram to analysepower spectral density (PSD) of the practical navigation signal. Welch cycle diagram method utilizes the improved average cycle diagram to estimate the power spectrum of the random signal. It uses the signal segments overlap, window, fast Fourier transform (FFT) and other techniques to calculate the power spectrum[2]. The Welch method can contribute to the estimation of the spectral curve smoothness, greatly enhancing the resolution of spectral estimation, so it is commonly used in GNSS signal power spectrum analysis[3].
Fig.2 shows B2 signal PSD. The selected relevant parameters are Hamming window length of 7 ms and FFT points of 10 240. It shows that Welch cycle diagram method can get better spectral envelope. Fig.3 shows the PSD of AltBOC.
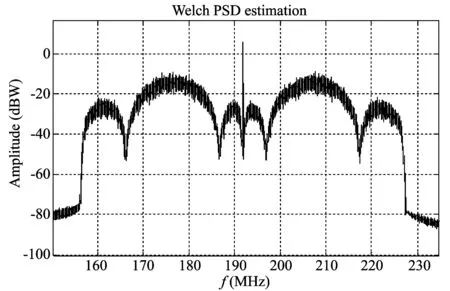
Fig.2 PSD of BeiDou B2 signal
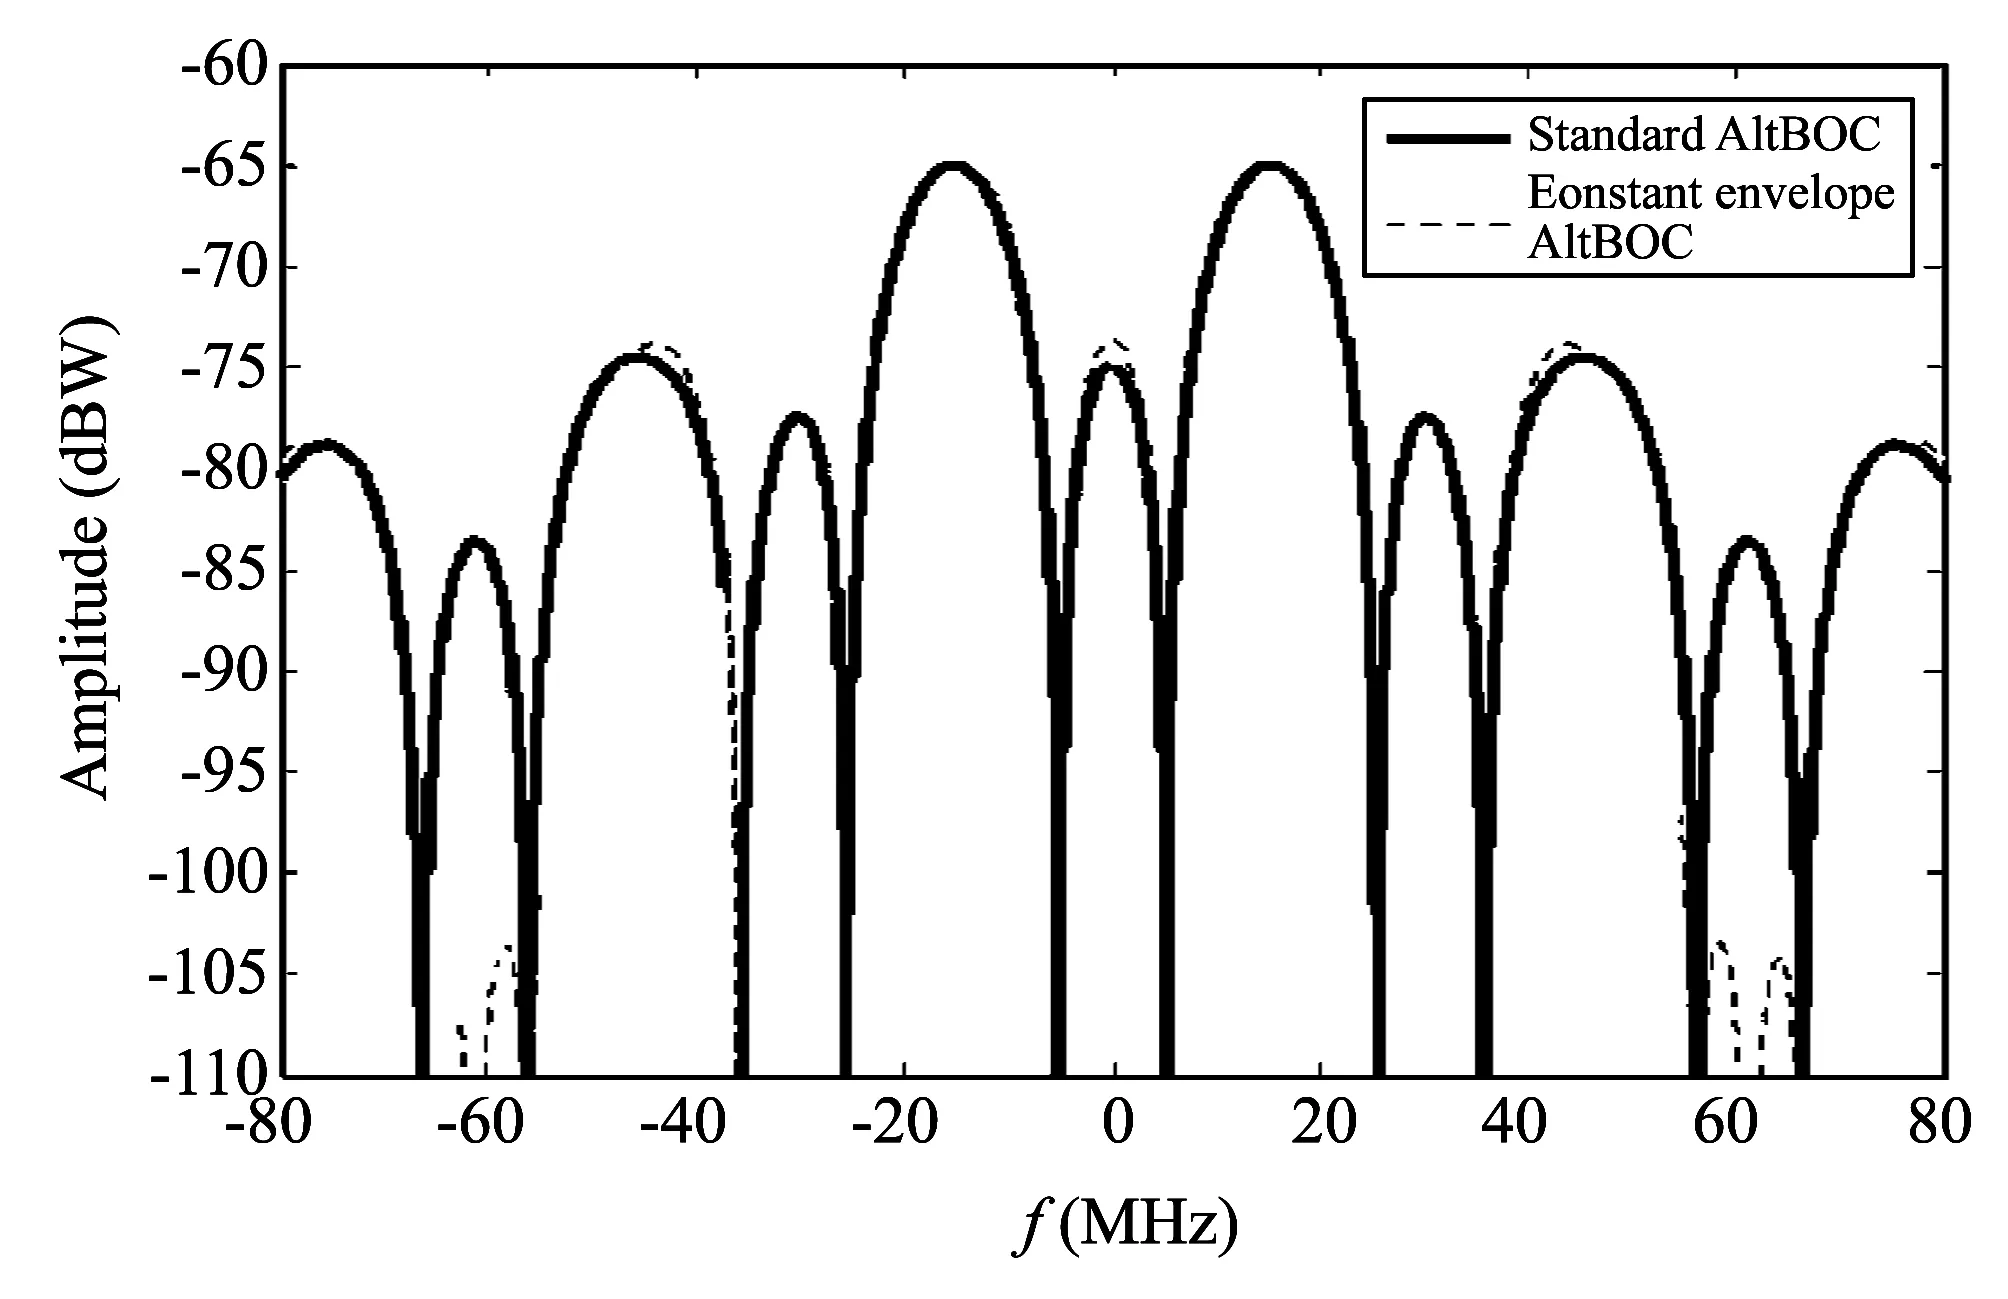
Fig.3 PSDs of AltBOC signals
From Fig.3, it can be seen that the measured PSD is consistent with theoretical PSD. The correlation coefficient reaches 0.983, and the calculated spectrum distortion coefficient is 0.017, which indicates the test power spectrum is of small distortion[4].
2.2 Time domain waveform and eye diagram
The signals to be analyzed can be got through orthogonal carrier stripping and Doppler removing. Then the signal time-domain waveform can be directly drawn. After overlaping a plurality of the time domain waveform, the eye is drawn. Fig.4 is the time-domain waveform of B2 test signal. The chip shape can be clearly seen.
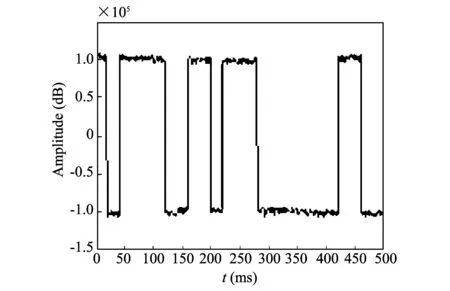
Fig.4 Time domain waveform of B2 test signal
Fig.5 is the measured B2 signal. As we can see, the eyes' open degree of the test signals is better.
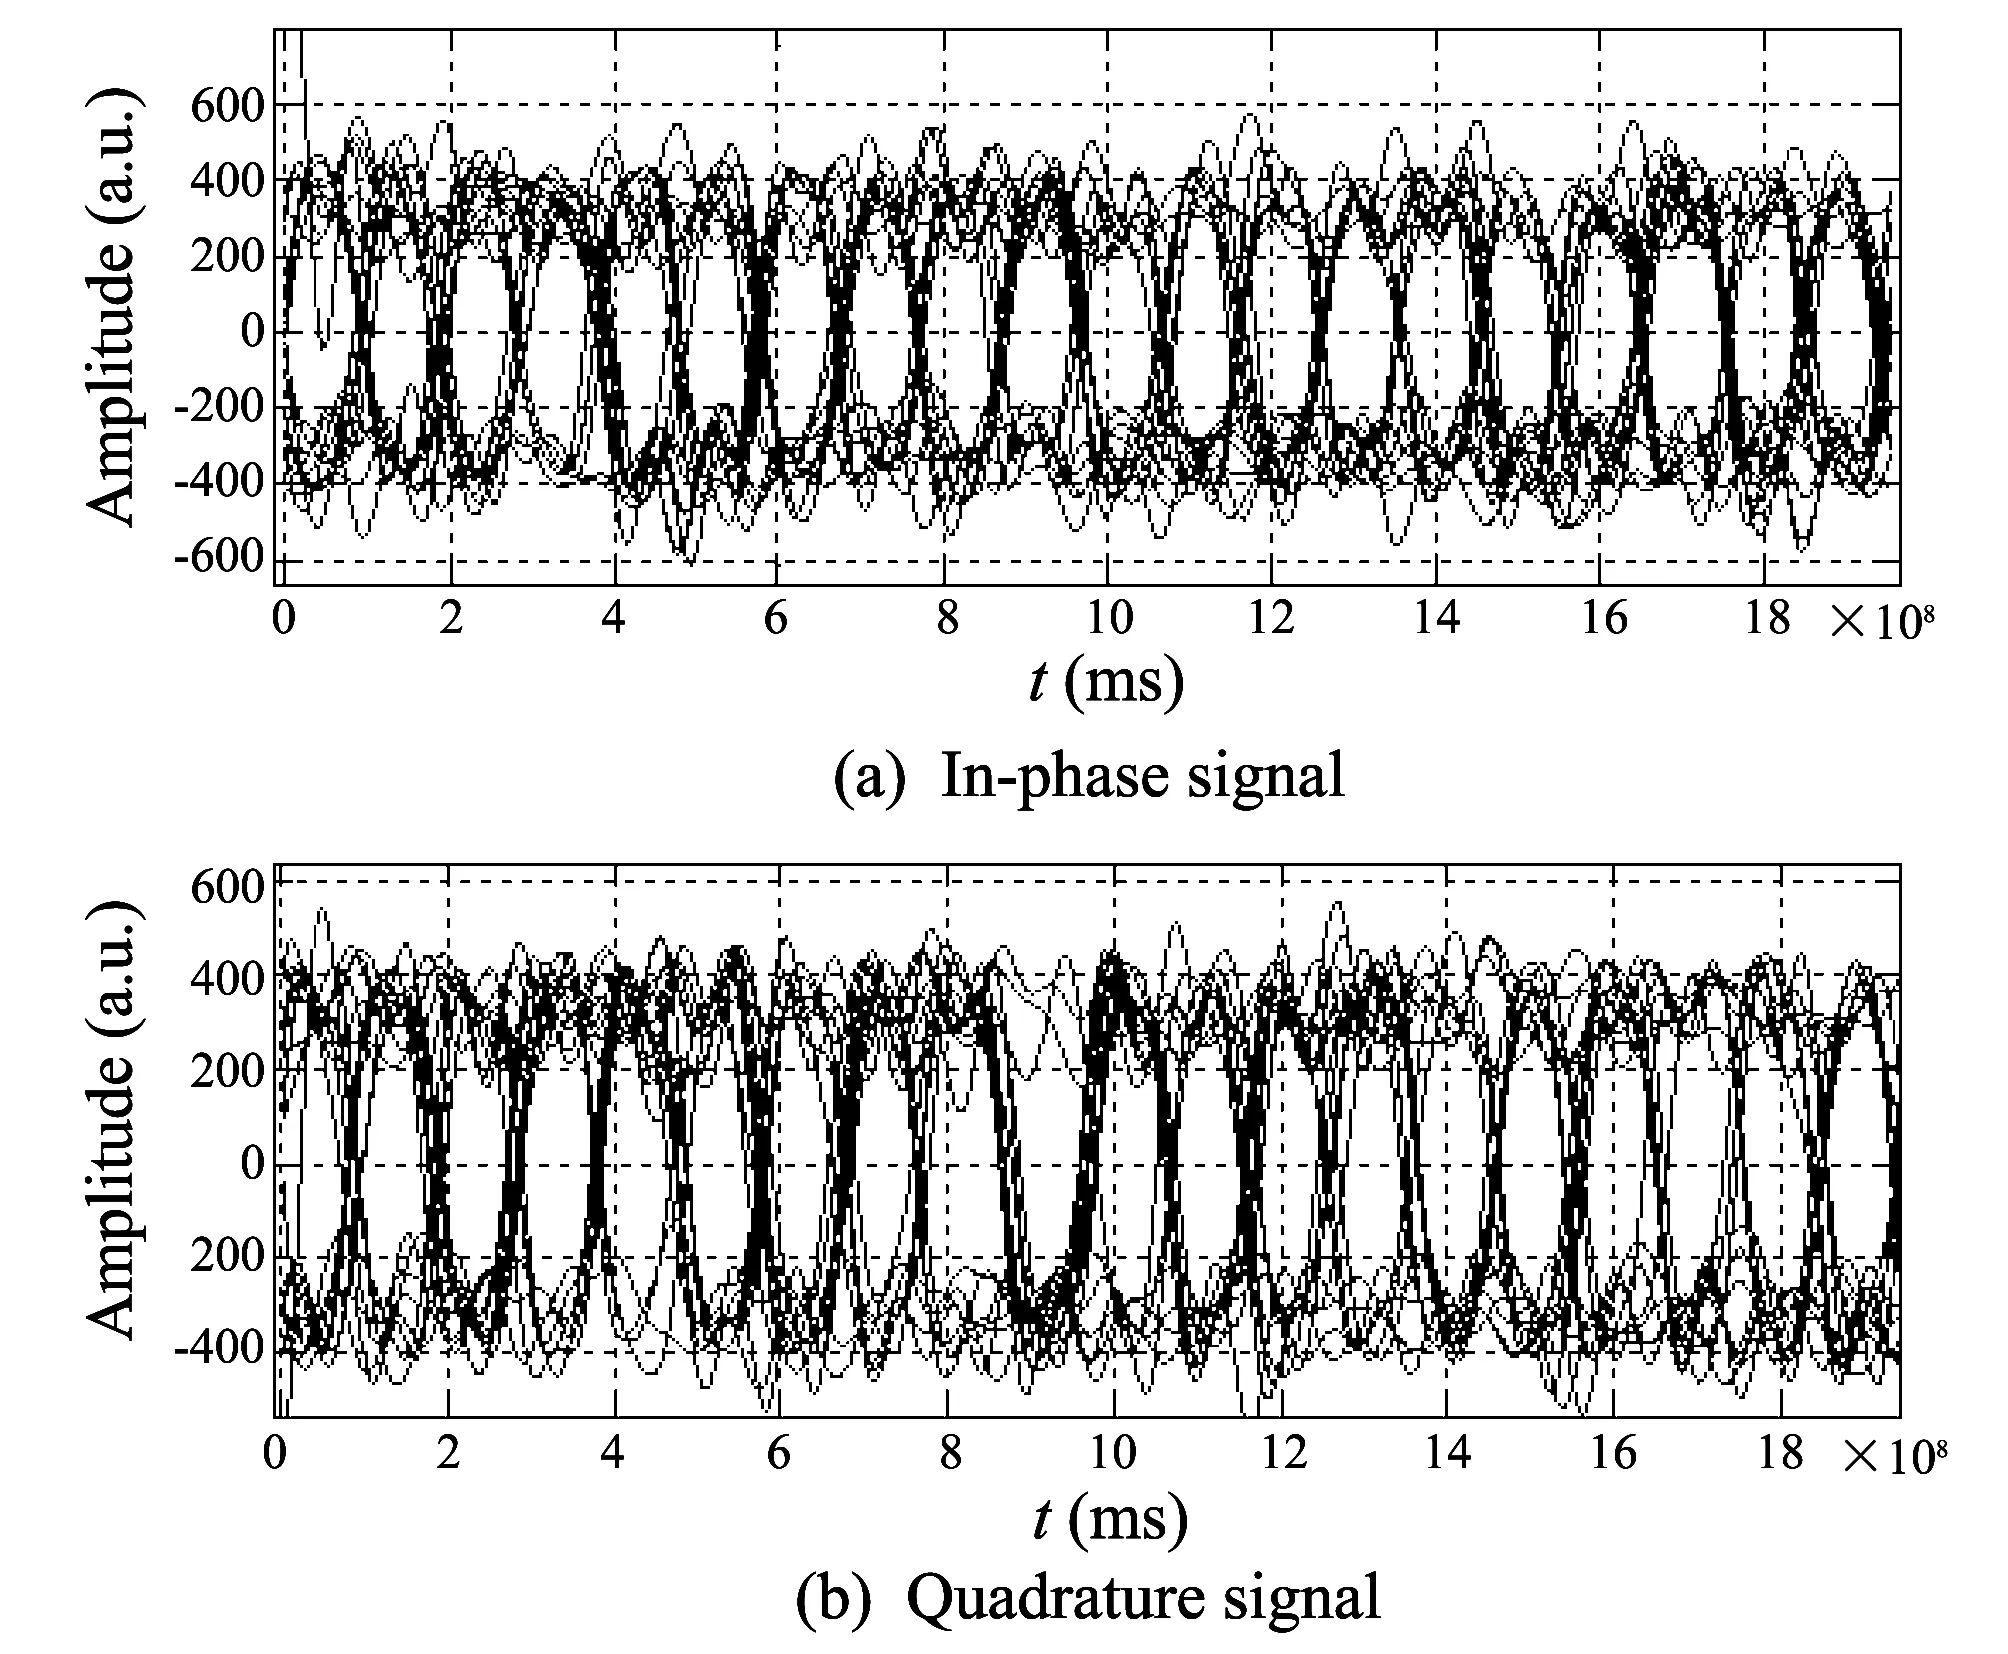
Fig.5 Eye diagram
2.3 Xing block diagram
Using the complex baseband signal can directly show us navigation signal constellation. Constellation can intuitively reflect the effect of I/Q carrier phase non-orthogonality on signal quality. I/Q carrier non-orthogonality can result in the error of signal amplitude and phase. Among them, amplitude error will affect GNSS signal constant envelope characteristics, resulting in greater signal distortion. Fig.6 shows the ideal AltBOC signal constellation. Fig.7 is the actual signal constellation of AltBOC signals. The actual constellation has a slightly offset compared with ideal constellation[5].

Fig.6 Constellation diagram of AltBOC ideal signals

Fig.7 Constellation diagram of AltBOC actual signals
2.4 Related loss
Related loss is a very significant parameter, which can measure the navigation signal quality. Related loss refers to the loss that the useful signal power in the related processing is compared with all available power of all received signals. Related loss concerns the navigation signal crosscorrelation function. Crosscorrelation functions is defined as[6]

(1)
There are two main factors causing loss: ① The same carrier frequency multiplexing a plurality of signal components; ② The channel bandwidth and distortion. Except the receiving treatment effects, the linear/nonlinear distortion introduced in signal generation and transmission process will also cause some loss.
2.5 S-curve bias (SCB)
Ideally, the zero value of receiver chip loop phase curve (s-curve) should be located in the code tracking zero error, but actually channel transmission distortion and other effects of multipath can cause code loop to be locked in native code phase relative to the input signal phase deviation. We will take non-coherent lead reduction power type phase detector as an example, for the correlator lead-pitch lag is δ, the s-curve equation is[7]
(2)
(3)
From Eq.(3), the received signal phase curve locking point deviation εblas(δ) with lead lag distance δ curve is drawn.
Fig.8 is the s-curve of different lead lag distance received by a non coherent ahead reducing power type discriminator. Ideally, the correlation peak symmetry is prominent, and s-curve has a common zero point, which is located in the code tracking error, the locking point deviation εblas(δ) is 0; In fact, the channel transmission distortion and other effects caused by multipath distortion cause the correlation peak distortion, which causes the code loop locked in native code phase relative to the input signal phase local deviations[8].

Fig.8 Correlation function of AltBOC signal
The lock point deviation diagram under different lead lag distance S curve zero is shown in Fig.10i. By lock point deviation calculation, s-curve deviation SCB is 837.5 ps and SCB is smaller, which illustrates that the tracking error difference under different lead lag distance caused by correlation function distortion is not large, and it has little impact on navigation performance.

Fig.9 S-curve with different early-late spacings

Fig.10 Locked point bias in dependency of early-late spacing
2.6 AltBOC(15,10) precision test
Coherent loop code tracking error lower bound is
(4)
where BLis code loop bandwidth and the unit is Hz; C/N0is the carrier to noise ratio and the unit is Hz; Δω is Gabor bandwidth and is definitied as
(5)
and σ2Tis pseudo code tracking mean square error, the unit is S2. The unit is Hz.

(6)
In Eq.(6), f is frequency and the unit is Hz; Gs(f) is equivalent baseband signal of the normalized power spectral density, the unit is 1/Hz; βris the reception of the bandwidth, the unit is Hz. When transmitting bandwidth is more than 30 MHz, AltBOC(15,10) Gabor bandwidth is about thrice the bandwidth of BPSK (10).
In order to quantitatively compare code tracking accuracy of AltBOC(15,10) signal and BPSK(10) signal, code tracking error is shown by simulation in the typical cases and it can be seen from Tables 1 and 2. The assumptions are noise spectrum density of 201.5 dBW/Hz, coherent integration time of 1 ms, loop bandwidth of 0.1 Hz, spread spectrum code of C/A code, correlator interval typical value for code rate and front bandwidth ratio, etc.

Table 1 Simulation result of AltBOC(15,10) and BPSK(10) code tracking error from typical receiwer in open environment

Table 2 Simulation result of AltBOC(15,10) and BPSK(10) code tracking error from typical receiver in serious barrier conditions
From the results, we know that the AltBOC(15,10) signal code tracking accuracy is higher than that of single side band signal about one order of magnitude. In the open receiving environment, even B2a or B2b signal code tracking accuracy also can achieve centimeter level, this advantage is not evident; In the serious barrier conditions(signal attenuation is 20 dB), single side band signal tracking precision is 0.36 m, but AltBOC(15,10) is 0.05 m, which can meet the demand of high precision application.
3 Conclusion
New navigation signal evaluation technique is a remarkable task in the construction of the BeiDou system. This paper takes the satellite navigation signal of B2 frequency point as an example and analyzes the main evaluation parameters of the signal quality as well as describes the test results in detail. In addition, it introduces the test principle and realization scheme based on the power spectrum, eye diagram, constellation, loss, s-curve offset parameters. The new system signal, AltBOC signal, has the best performance in code tracking precision, anti-jamming and anti multipath. In the environment with more barriers such as cities and forests, AltBOC(15,10) performs more outstandingly, which can satisfy the requirements of the urban vehicle precision navigation(such as active cruising mode based on satellite navigation)and high precision positioning in complex environment such as geodetic measurement. The test results have a significant reference value to the actual signal quality evaluation of BeiDou system.
[1] Shivaramaiah N C, Dempster A G. A novel extended tracking range dll for AltBOC signals. In: Proceedings of IEEE 70th Vehicular Technology Conference Fall(VTC 2009-Fall), Anchorage, Alasks, USA, 2009: 1-5.
[2] LU Xiao-chun, ZHOU Hong-wei. Methods of analysis for GNSS signal quality. Scientia Sinica: Physica, Mechanica and Astronomica, 2010, 40(5): 528-533.
[3] Perello G, Malik M, Falcone M. Selected RNSS measurements and analysis. In: Proceedings of ENC-GNSS-2008, Toulouse, France, 2008: 52-53.
[4] Weiler R, Kakarlapudi S. Navigation payloads vs. receivers: sampling frequency effect. In: Proceedings of the 4th European Workshop on GNSS Signals and Signal Processing, Oberpfaffenhofen, Germany, 2009: 123-125.
[5] Soellner M, Kurzhals C, Hechenblaikner G, et al. GNSS offline signal quality assessment. In: Proceedings of the 21st International Technical Meeting of the Satellite Division, 2008, 909-920: 34-37.
[6] Shivaramaiah N C, Dempster A G. An analysis of Galileo E5 signal acquisition strategie. In: Proceedings of ENC-GNSS-2008, Toulouse, France, 2008: 42-43.
[7] DING Jie, HUANG Zhi-gang, GENG Sheng-qun. New system navigation signal quality assement and measurement. In: Proceedings of the 3rd China Satellite Navigation Conference, 2012: 328-333.
[8] Issler J L, Paonni M, Eissfeller B. Toward centimetric positioning thanks to l-and s-band GNSS and to meta-GNSS signals. In: Proceedings of the 5th ESA Workshop on Satellite Navigation Technologies and European Workshop on GNSS Signals and Signal Processing(NAVITEC), Noordwijk, Netherlands, 2010: 1-8.
[9] WU Yi, ZHENG Hui, LIN Xiao-fang. Status of Galileo frequency and signal design. Digital Communicate World, 2006, (10): 55-58.
[10] NIE Jun-wei, LI Zheng-rong, MI Xiao-long, et al. Study of the signal modulation of Galileo satellite navigation system. Global Position System, 2006, 31(6): 1-6.
[11] SONG Di-er, ZHAN Xing-qun. Structure analysis and simulation of Galileo E5 signal. Micro-computer Information, 2006, 22(10-1): 66-68.
date: 2013-01-18
MENG Qing-feng(mengqingfeng1986@126.com)
CLD number: TN911.7 Document code: A
1674-8042(2013)03-0289-05
10.3969/j.issn.1674-8042.2013.03.019
猜你喜欢
杂志排行

Journal of Measurement Science and Instrumentation的其它文章
- Impact of low temperature on smartphone battery consumption*
- Roll angle measurement system based oni triaxial magneto-resistive sensor*
- Dynamic test methods for natural frequency of footbridge*
- High-speed broadband data acquisition system based on FPGA*
- Method of military software security and vulnerability testing based on process mutation*
- Study on denoising filter of underwater vehicle using DWT*