Experimental research on kinematics of breaking waves *
2018-07-06DeWangChiaLongbinTaoXinWangYaliZhangArunKrDev
De Wang Chia , Longbin Tao , Xin Wang , Yali Zhang Arun Kr Dev
1. Lloyd’s Register Singapore Pte Ltd, Singapore
2. Faculty of Science, Agriculture and Engineering, Newcastle University, Newcastle upon Tyne, UK
3. Naval Architecture, Ocean and Marine Engineering, University of Strathclyde, UK
Introduction
Wave breaking may induce a significant slamming load on offshore structures and understanding the kinematics behind this extreme event would be beneficial in many aspects, in areas of offshore structure design, and the physical science of water waves.
Predicting the occurrence of a breaker has generated great interest amongst researchers. One of the commonly used kinematic criteria is the “ /U c”ratio, “U” being the horizontal crest particle velocity and “c” being the phase speed. It is accepted that if the horizontal crest velocity exceeds the wave celerity,the crest will form a jet and would subsequently topple due to gravitational forces. However, recent literature and observations from several researchers have shown contradictory results of this theory.
Kjeldsen[1]created breaking waves via the superposition of 43 regular waves of carrying frequencies.High speed cameras were used for the capturing of the horizontal crest particle velocity. The phase speed was calculated using wave probes, via the zero downcrossing method. He measured a “ /U c” ratio of 1.73 upon breaking.
wheregis the gravitational acceleration,ZTis the zero down-crossing period, the time taken for a successive wavelength, measured at the free surface.
Perlin et al.[2]created breaking waves via dispersive focusing, which involved a range of wave frequencies to generate breaking waves. particle image velocimetry (PIV) and particle tracking velocimetry(PTV) were used to determine the fluid’s particle velocity. The wavelength was post-processed from the obtained images, and this wavelength value was used to estimate the phase celerity via linear wave theory.Perlin et al.[2]found that the PIV and PTV-measured“ /U c” were 0.74 and 1.028 respectively. Perlin et al.[2]concluded that prior to breaking, the crest front becomes nearly vertical and the wave-particle at the crest starts to accelerate horizontally.
Stansell and Macfarlane[3]performed experiments using a focused spectrum to generate plunging breakers and spilling breakers to observe the “ /U c”ratio upon breaking. Wave gauges were used for surface elevation measurements and PIV for the measurement of the surface crest particle velocity. It is found that the “ /U c” recorded for plunging and spilling breakers were 0.81 and 0.95 respectively,which was less than 1. It is further confirmed that the common understanding of “ /U c” ratio > 1, was not a necessary criterion to predict the onset of a breaker.
The above literature reviews showed that the obtained wave kinematics is dependent on the methods used to generate the breaking waves and methodologies for post processing the data. “ /U c”values ranging from 0.74 to 1.73 were obtained.However, the phase speed of a wave, just before undergoing breaking would experience dramatic kinematic changes. It might not be accurate to assume a constant phase speed for the entire phase of the pre-breaking wave. Understanding the kinematics of wave breaking, would be beneficial for understanding the geometry breaking criterion and breaking wave impact loading. Not limiting to kinematic breaking criterion, geometric breaking criterion was one of the most debated topics in recent decades. Traditionally,wave steepness had been used to describe wave breaking parameter. However, in the actual case,non-linear waves behaved asymmetrically. The crest of a near breaking wave would be more than 0.5H(His the wave height), and the crest front length of the wave wouldn’t be exactly 0.25L(Lis the wavelength).
Kjeldsen and Myrhaug[4]separate wave steepness into two geometric parameters. They introduced “ε”and “δ” which were used to describe crest-front and crest-rear steepness respectively. These new geometric breaking parameters took into consideration the asymmetric behaviour of non-linear waves (Fig. 1).

Fig. 1 (Color online) Local wave parameters defined by Kjeldsen and Myhuang[4]
The crest-front steepness can be written as
The crest-rear steepness can be written as
However, for simplicity, researchers using wave probes in their experimental studies had been applying the above equation to calculate both the crest-front and crest-rear steepness. In the above equations, it was noted that a constant phase speed was used for deriving the crest-front and crest-rear length respectively. Breaking wave is a dynamic phenomenon,hence assuming a constant phase speed during the entire phase of the wave might cast a shadow on the accuracy of the applied formulas used above.
In the present research, experimental work would be carried out to generate breaking waves of different intensities. This research aims to establish the dynamic behaviour of the breaking wave kinematics at the point of jet forming and to revisit past literature surveys of the kinematic breaking criterion.
1. Experimental set-up
Breaking waves were generated at Newcastle University, in the wind, wave and Current tank (Fig. 2)measuring 11 m by 1.8 m by 2 m, length, width and height respectively, via the focused spectrum method.This wave tank uses a piston type wave maker, and with the input of the relevant wave parameters, the wave maker’s strokes displacements were calculated by the computer software. The creation of breaking waves used the JONSWAP spectrum.
The JONSWAP spectrum reads as follows

where ω is the angular frequency,Pω is the peak angular frequency,rγ is the peak enhancement factor.

Fig. 2 (Color online) Newcastle University wind wave and current tank
The JONSWAP spectrum describes the irregular sea state with dozens of regular waves with varying frequencies, in this case a frequency range of 0.25 Hz to 2 Hz. The breaking wave intensities were modified by adjusting the peak frequency value. The breaking wave could be intensified by lowering the peak frequency value due to the negative correlation between the peak frequency and the spectrum.
And the surface elevation can be expressed by
whereais the amplitude,kis the wave number,φ is the phase shift,xis the being the spatial distance from the wave maker.
A breaking focal point (χB) was chosen as 9 m.To unleash the full potential of the wave package and to obtain the critical amplitude to aid the generation of a breaker, each of the individual wave phase would be modified to satisfy the below equation

Wave probes having recording frequency of 100 Hz,were placed at =x7.25 m, 7.75 m, 8 m, 8.5 m and 9 m respectively. Camera having a recording capability of 240 fps was placed just before the breaking location.
Breaking waves of 6 different intensities were generated in this study, with the peak frequency ranging from 0.47 Hz to 0.52 Hz. As explained above,lower peak frequencies would equate to stronger breaking intensities. Below figure (Fig. 3) shows a time history of the initial formation of the jet, till the jet overturn and collapsed with the aid of gravitational force.
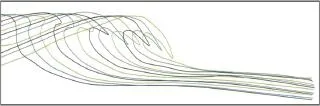
Fig. 3 (Color online) Wave profile time history of F p= 0 .49Hz ,focused JONSWAP spectrum, time step = 0.023 s
The above figure (Fig. 4) clearly illustrates the matured formation of the plunging jet.
The value of the horizontal crest particle velocity and wave celerity was measured by wave probes and high speed cameras respectively. Using both wave probe (Eulerian method) and high speed camera(Lagrangian method) of 240 fps, horizontal crest particle velocity and wave celerity just before breaking were measured and compared.

Fig. 4 (Color online) Jet overtopping

wherex2-x1is the spatial distance traveled between 2 spatial locations,t2-t1is the time taken to travel from1xto2x.
The lagrangian wave celerity measured using this tool was measured by taking a fixed elevation point at free surface. The spatial horizontal distance ropagated by the wave is measured and the celerity is calculated(Eq.(7)). The lagrangian wave crest velocity was measured using the same methodology, with the elevation point of interest being at the crest level.Wave celerity can be measured by the zero downcrossing method via the probes, known as the Eulerian Wave Celerity. The horizontal crest velocities were estimated by the time needed for the crest to travel to the succeeding probes.

whereNxis the spatial distance of a wave probe,xN+1is the spatial distance of a succeeding wave probe,crest,Ntis the time, when crest reaches probeN,crest,+1Ntis the time, when crest reaches successive probe.
However, the above Eulerian method didn’t account for the dynamic changes of the kinematics of the breaking wave, before breaking. This Eulerian method assumed constant wave celerity during the entire breaking wave period, which contributed a level of inaccuracy. The use of the maximum crest values for wave probes with different spatial, wouldn’t necessarily accurately describe the actual horizontal crest velocity, as the jet does not occur at the maximum crest value during collapsing. Hence, high speed camera of 240 fps was used to determine the wave celerity and the jet velocity, simply using d/dx t.
2. Results and discussions
The obtained wave celerity via the Lagrangian method, during the rise of the crest before breaking hereby known as “Lc”
The “cL/cE” ratios range from a value of 1 to 1.24 (Fig. 5), and it also appears that the actual wave celerity “Lc” is slightly higher than “Ec” just before breaking at =8 mx. It is worthwhile to note that a higher “cL/cE” ratio was obtained with increasing breaking wave intensity as compared with decreasing wave celerity readings.

Fig. 5 (Color online) “c L ” ratios for different breaking intensities
The obtained horizontal crest velocity via the Lagrangian method is now known as “LU”. The horizontal crest velocity obtained via the Lagrangian method is higher than the linear eulerian method. The values of both “LU” and“EU” increases with greater breaking intensities (forFp<0.49).
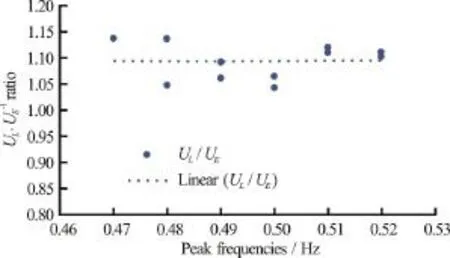
Fig. 6 (Color online) “U L ” values for different breaking intensities at x= 8m
Contrary to the findings of the “cL/cE” ratio, the“UL/UE” ratio (Fig. 6) is not affected by the breaking wave intensities. The “UL/UE” ratio ranges from 1.04 to 1.14.
The wave celerity based on the 3rdorder Strokes theory can be written as


Fig. 7 (Color online) “c L /c” values for different non-dimensional breaking intensities “T Z /TP” at x = 8m, using 3rd order Stokes theory
Comparing the “cL/c” ratio (Fig. 7) against“TZ/TP” ratio, in which a lower “TZ/TP” represents higher breaking intensities (Eq. (4)), a regression analysis of the parameters is shown above. Hence the semi-empirical breaking wave celerity is formulated as below[5]

The maximum “ /U c” tends to occur at =8 mx,just before the formation of the plunging jet.According to the above findings, the value of “U”tends to be different depending on the methodology used. In this study, “LU” tends to be 8% to 14%greater than the horizontal crest velocity measured by the wave probes, and the differential increases with stronger wave breaking intensities. The value of “Lc”also tends to be 7% to 24% greater than the Eulerian wave celerity. As a result, an overall lower value of“UL/cL” ranging from 1.26 to 1.31 was achieved, as breaking criteria, with the “UL/cL” giving a lower maximum value of 1.31 for the strongest breaker in compared with 1.27 to 1.48 using the reading post-process from wave probes. Both methodologies achieved “ /U c” ratio>1, satisfying the kinematics this study.
3. Conclusions
It is convenient to use the Eulerian method to measure wave celerity. However, for strong nonlinear waves, this method proved to be questionable.Breaking waves with varying breaking intensities were generated, and a semi-empirical relation of the breaking wave celerity was established as above.There is a negative correlation between “cL” and“TZ/TP” ratio, meaning that the predicted breaking wave speed increases with increasing wave breaking intensities (lowerTZ/TPratio). The above equation would not hold, for non-breaking waves or waves with higher “TZ/TP” ratios.
This study has explored the dynamic nature of wave leading to breaking. It was found that leading up to wave breaking, the wave celerity decreases and allowing the horizontal crest velocity to exceed,forming a jet which finally leads to breaking. Past literature survey[1,4], assuming a constant wave celerity, would have underestimated the crest-front length and overestimated the geometry breaking criteria by a significant margin depending on the breaking intensities, and also overestimating the kinematic breaking criteria. In past literature survey[6-7], the slamming load formula acting on a cylinder is largely dependent on the breaking wave celerity (Eq. (12)). Chan et al.[8]suggested that breaking wave is shown to be the most destructive, when there is a well-formed jet due to the association of the additional slamming load induced by the jet. Chella et al.[6], further proposed expanding the Morison’s Equation to account for the additional wave breaking force arising from the breaking waveby including an additional slamming force term and into the existing drag and inertia term.
The equation is as follows

where ρ is the density of medium,SCis the slamming force coefficient,BCis the breaking wave celerity, λ is the curling factor of breaking wave,expressed as a ratio of the impact length on cylinder over the breaking wave elevation, η is the surface elevation and λη is the breaking wave impact area on structure per unit length.
Researchers have been proposing wave models[9-11]to predict the value of the slamming load coefficient.Using the above semi-empirical formula to predict the breaking wave celerity, it would benefit future work on analysing the additional slamming load that acts on a structure due to wave breaking. A more accurate slamming coefficient based on the above theory could be modelled. The above semi-empirical formula would give a convenient method for esti- mation of the kinematics of breaking waves just by using wave probes.
Acknowledgements
The authors would like to express their gratitude towards Singapore Economic Development Board(EDB) and Lloyd’s Register Singapore Pte Ltd for funding this project work. Special thanks to the Hydrodynamics Lab Team at Newcastle University who provided assistance throughout the experimental works.
[1] Kjeldsen S. P. The experimental verification of numerical models of plunging breakers [C].19th International Conference on Coastal Engineering, Houston, USA, 1984.
[2] Perlin M., He J. H., Bernal L. P. An experimental study of deep water plunging breakers [J].Physics of fluids,1996,8(9): 2365-2374.
[3] Stansell P., Macfarlane C. Experimental investigation of wave breaking criteria based on wave phase speeds [J].Journal of Physical Oceanography, 2002, 32(5):1269-1283.
[4] Kjeldsen S. P., Myrhaug D. Breaking waves in deep water and resulting wave forces [C].11th Offshore Technology Conference, Houston, USA, 1979.
[5] Cui C., Zhang N. C., Zuo S. H. et al. A study on kinematics characteristic of freak wave [J].China Ocean Engineering, 2013, 27(3): 391-402.
[6] Chella M. A., Tφrum A., Myrhaug D. An overview of wave impact forces on offshore wind turbine substructures[J].Energy Procedia, 2012, 20(5): 217-226.
[7] Det Norske Veritas (DNV). Environmental conditions and environmental loads [S]. PNV-RP-C205, 2010.
[8] Chan E. S., Cheong H. F., Gin K. Y. H. Breaking-wave loads on vertical walls suspended above mean sea level [J].Journal of Waterway, Port, Coastal and Ocean Engineering, 1995, 121(4): 143-147.
[9] Det Norske Veritas (DNV). Design of offshore wind turbine structures [S]. Offshore standard DNV-OS-J101,2004.
[10] Sarpkaya T. Wave impact loads on cylinders [J].Society of Petroleum Engineers Journal, 1979, 19(1): 29-36.
[11] Wienke J., Oumeraci H. Breaking wave impact force on a vertical and inclined slender pile–theoretical and largescale model investigations [J].Coastal Engineering,2005,52(5): 435-462.
杂志排行

水动力学研究与进展 B辑的其它文章
- Numerical simulation of wave-current interaction using the SPH method *
- The coupling between hydrodynamic and purification efficiencies of ecological porous spur-dike in field drainage ditch *
- Simulation of violent free surface flow by AMR method *
- Fundamental problems in hydrodynamics of ellipsoidal forms *
- Case study on wave-current interaction and its effects on ship navigation *
- Numerical simulation of cementing displacement interface stability of extended reach wells *