Emission-Reductive and Multi-Objective Coordinative Optimization of Binary Feed for Atmospheric and Vacuum Distillation Unit
2018-01-19HuangXiaoqiaoZhaoTianlongLiNaMaZhanhuaSongLijuanLiJun
Huang Xiaoqiao; Zhao Tianlong; Li Na; Ma Zhanhua; Song Lijuan; Li Jun
(1. State Key Laboratory of Heavy Oil Processing, China University of Petroleum, Qingdao 266580;2. PetroChina Fuel Oil Company Limited Research Institute, Beijing 100195;3. Liaoning Shihua University, Fushun 113001)
1 Introduction
As a typical unit operation of crude oil processing,the atmospheric and vacuum distillation unit has been subject to persistent research which asserts no sign of reduction. According to statistics, 40% to 70% of the energy consumption in the chemical process is used for separation, and about 95% of which goes to the distillation section[1]. To save energy and increase profit,therefore, optimizing the operating parameters and control scheme of atmospheric and vacuum distillation unit is a measure of great significance. Besides, with the increasingly stringent requirements for environmental protection, energy conservation and emission reduction of the international situation[2], developing the green economy has become a top priority[3-4]. Meanwhile, under the situation of increased oil imports, diversification of crude slate and fluctuations in price of crude and oil products, refineries are facing the dilemma of processing mixtures of different kinds of crude oils[5].In recent years, the efficient use of heavy and inferior oil resources has been the research hotspot attracting the attention of petroleum refining enterprises[6]. The petrochemical industry urgently needs to solve the following problems: It is necessary on the basis of the existing equipment and actual production data to develop a systematic simulation and optimization method[7]for determining the blending ratio of different types of crude oils and other appropriate operating conditions in an attempt to improve the economic efficiency and market competitiveness, and to meet the requirements for energy conservation and emission reduction in enterprises[8].Under this circumstance, several researchers and scholars have made some efforts to solve problems related with the feed blending ratio of different kinds of crude oils by conducting a sensitivity analysis and an optimizationstudy. By taking More’s work[9]for instance, the impact of binary crude composition on design parameters and product flow rates was studied, and the trade-off between economic profit and energy cost was investigated,while the evaluation results indicated a strong influence of binary crude composition on the profit and energy consumption. More’s work[9]emphasized the effect of binary feed selection on the gross-root design, and,however, the environmental factor of CO2emission was not reported. Besides, Aires, et al.[10]studied the petroleum allocation scheme of Petrobras involving 11 crude oils from the standpoint of the enterprise.
Optimization methodologies for crude distillation units currently rely on three frequently used algorithms, i.e.the genetic algorithm, the artificial neural networks and the mixed-integer non-linear programming. For example,Huang, et al.[11]developed a genetic algorithm-based scheme to optimize the operation of an atmospheric and vacuum distillation unit and obtained considerable improvements in profit. Ochoa-Estopier, et al.[12]proposed a strategy employing the artificial neural network to optimize the operating conditions of crude oil systems,while Lemos, et al.[13]employed the mixed integer nonlinear programming method to optimize the schedule for cleaning the fired heaters of atmospheric distillation column, and a practical case study showed a notable reduction (about 40%) of costs as compared with the nonoptimized condition. Furthermore, Ochoa-Estopier, et al.have also made some efforts in design optimization and retrofit of crude oil distillation systems, as referred to in the literature[14-16].
Coordinative optimization of distillation systems and heat exchanger networks always leads to far better results. Psaltis, et al.[17]developed a systematic methodology to study and optimize the interaction between the fractionation system and its related heat exchanger network, and the evaluation results obtained were proved to be more economical. Luo,et al.[18]optimized the crude oil distillation columns and heat recovery system simultaneously based on the stochastic method, and a case study in their work indicated to the positive results in economic benefit.These previous work efforts mentioned above provided several optimization strategies for reference, however,most of them took almost no environmental index into consideration. Moreover, M. Gadalla, et al. have also proposed many classical theories in the optimization and retrofit design of crude oil distillation systems, as referred to in the literature[19-21].
Upon considering the economic profit of refineries, the fuel expenditure, and the greenhouse gas emissions,this paper develops an optimization strategy based on the Elitist Non-dominated Sorting Genetic Algorithm(NSGA-II), in which three objective functions are adopted. Besides, as a key operating parameter, the effect of blending ratio of two different oils is also investigated during the computing procedure.
2 Problem Definition
The methodology proposed in this paper will be illustrated through a practical case, i. e. the operation of a 4.5 Mt/a atmospheric and vacuum distillation unit, which mainly includes a preflash column, an atmospheric column and a vacuum column, is studied as an example. The raw material to be processed is a mixture of heavy and light crude oils, and the blending ratio of which is 7:3. On the basis of process flow scheme and calibration data of the whole equipment,a modelling by Aspen Plus is established to simulate the existing working conditions. Figure 1 shows the modelling of the crude distillation unit, with the TBP data of crude oils presented in Table 1.
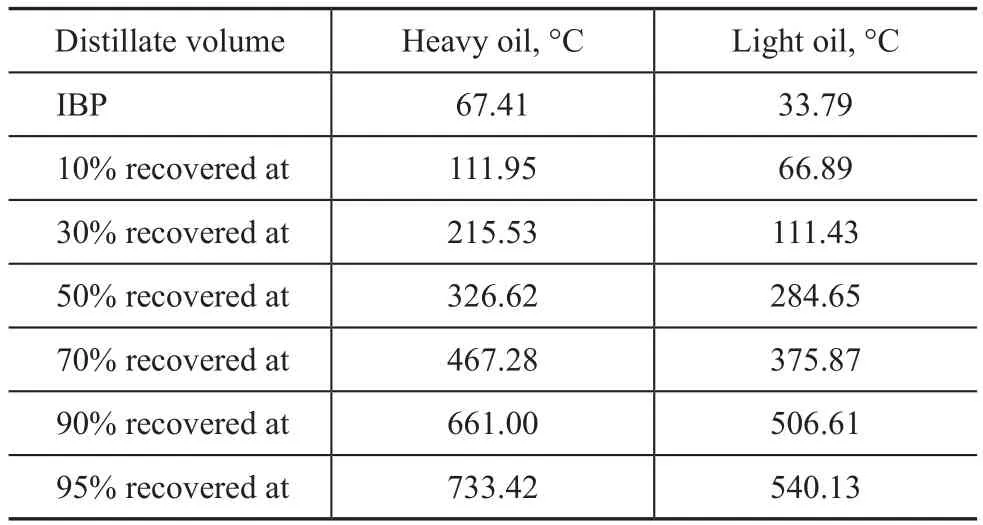
Table 1 TBP data of crude oils
In order to verify the accuracy of the model constructed above, the simulation results of some key operating parameters and product properties are compared with the actual production values. Thereby, Table 2 displays the details on comparison of the operating parameters, and Figure 2 demonstrates the details on comparison of the distillate curves.
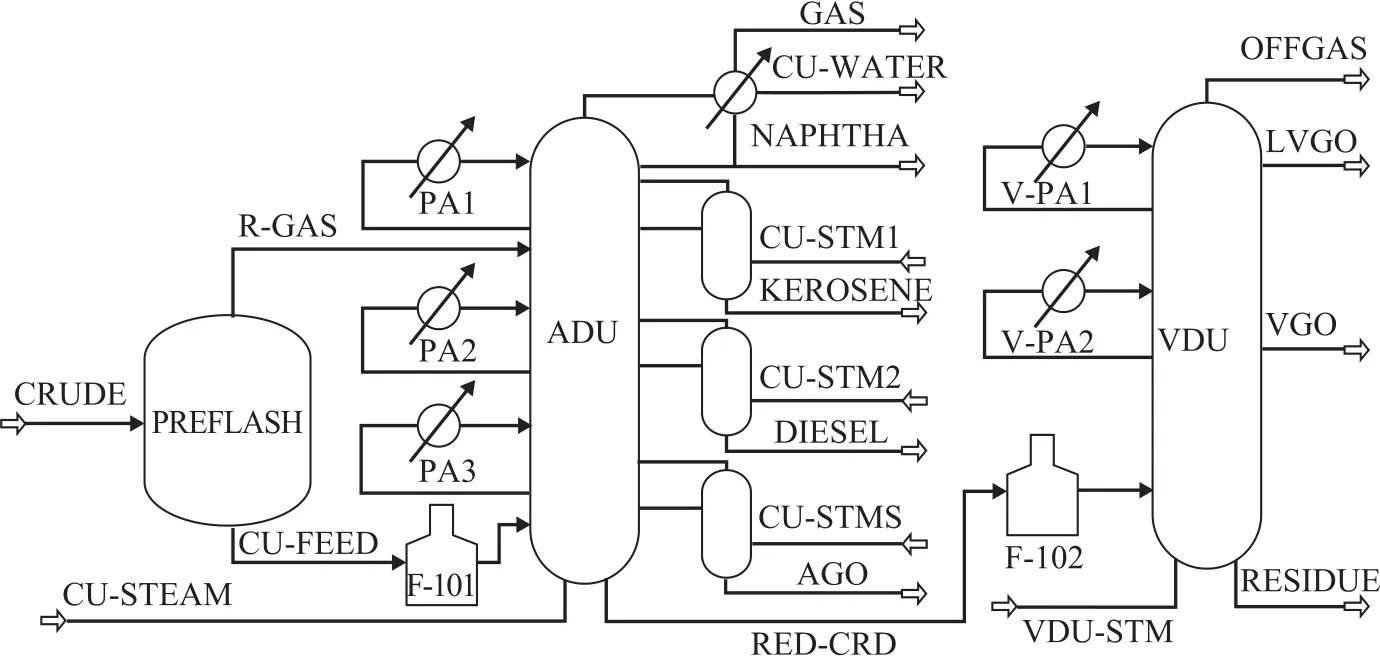
Figure 1 Modelling of the crude oil distillation unit
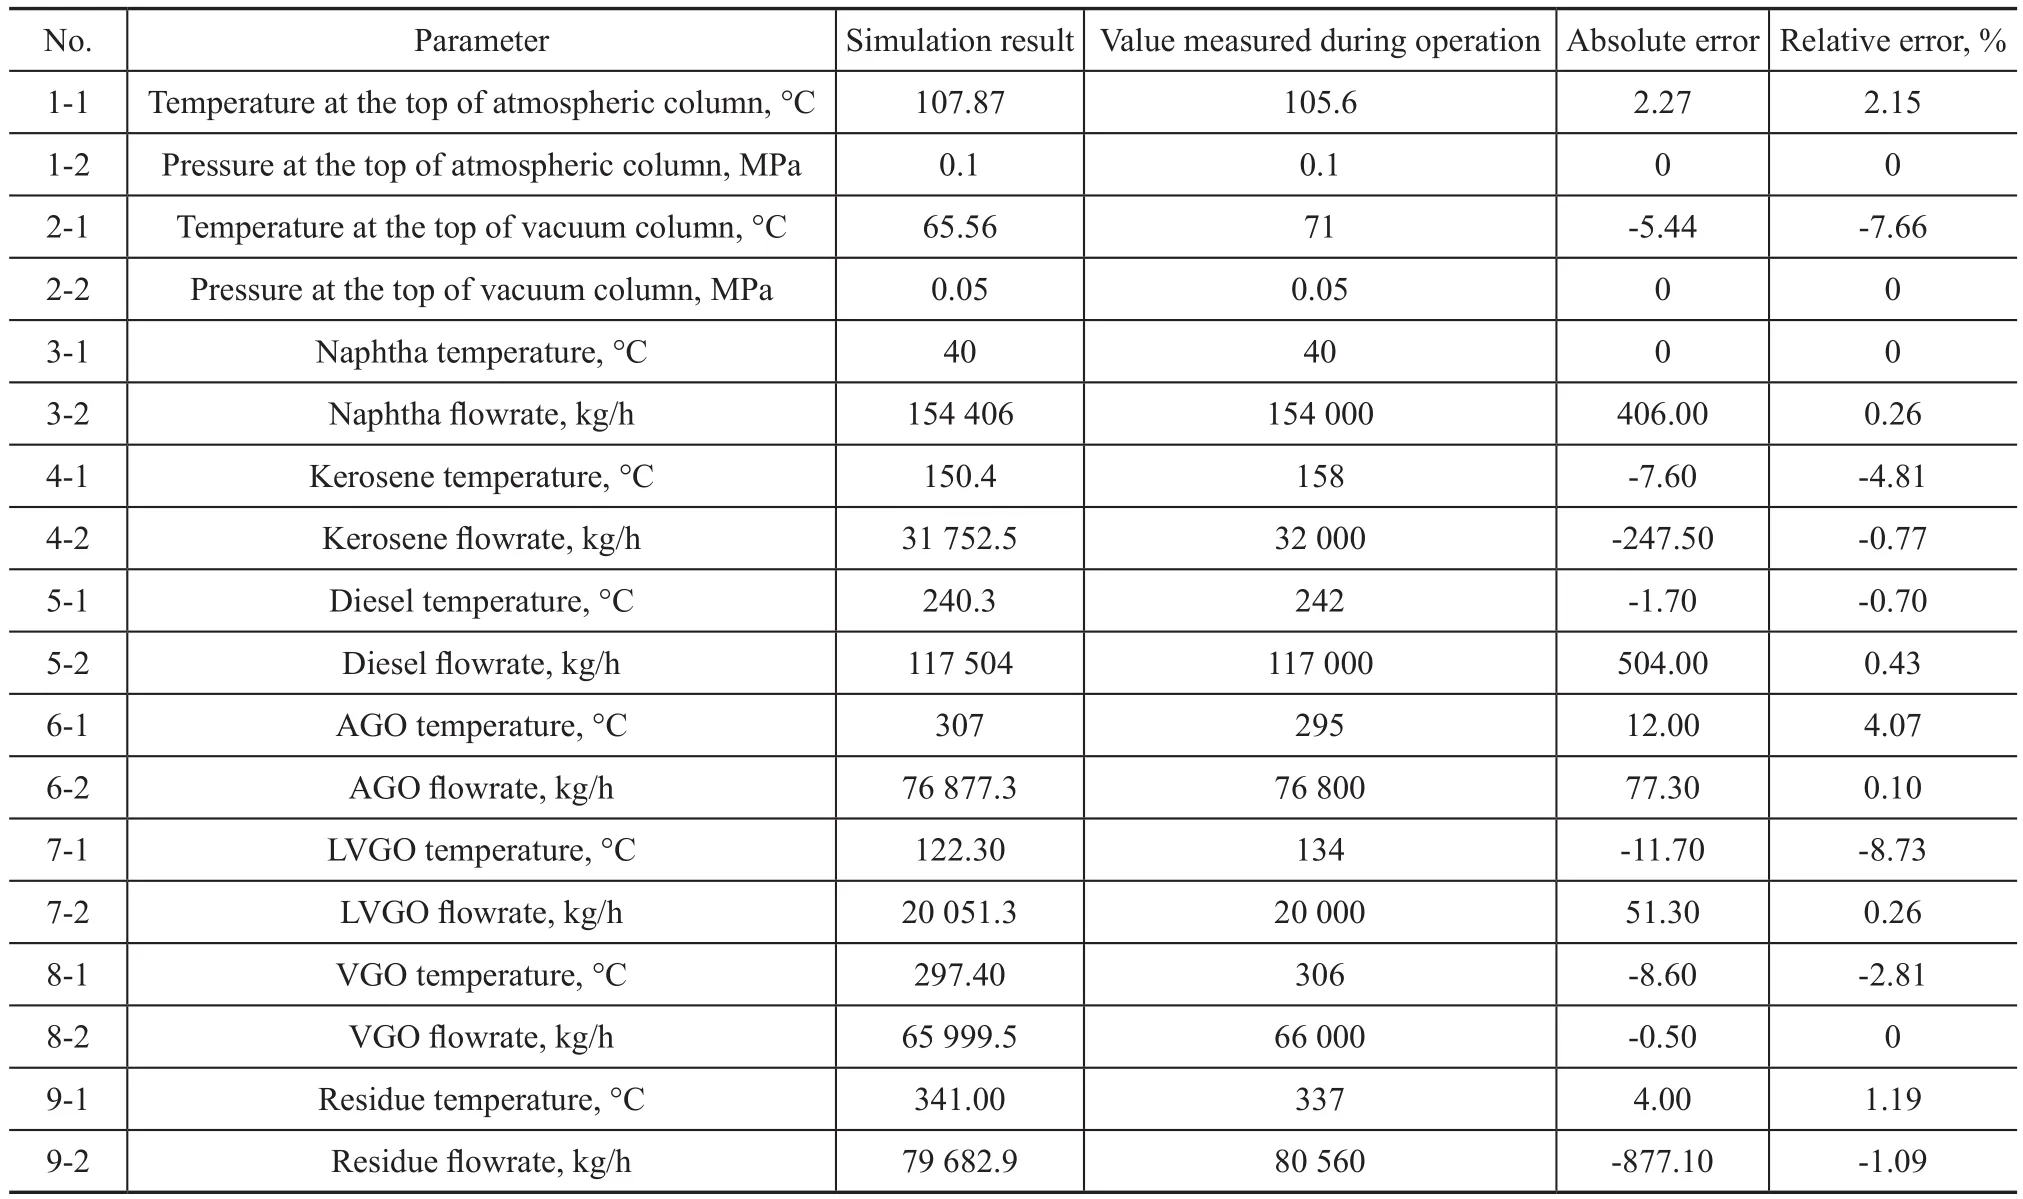
Table 2 Comparison between the simulation results and operating conditions
It can be seen from Table 2 and Figure 2 that the simulation results are fairly close to the operating parameters of the crude distillation unit, and there is little difference between the distillate curves in both columns.These results all lead to the conclusion that the Aspen Plus model is accurate enough to be used as a substitute for the operation of crude processing unit to conduct the multi-objective optimization.
3 Methods
3.1 Integration of software
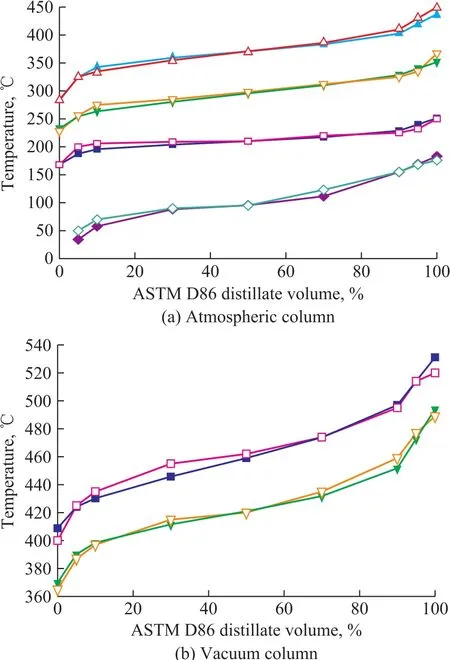
Figure 2 Distillation curves of products in (a) atmospheric column and (b) vacuum column
Once the accurate Aspen Plus model is ascertained, the NAGA-II will be employed to compute the optimal blending ratio and other operating parameters, and then to optimize the objectives, i.e. the energy consumption, the economic benefits and the CO2emissions. The interface tool Map which is developed based on the technologies of COM (Component Object Model) and ActiveX is utilized to connect Matlab to Aspen Plus. The computational platform Matlab assumes the obligation of creating/returning the Aspen Plus handles and moreover calling the NAGA-II to calculate the objective functions. The integration of software referred to in this work is shown in Figure 3(a), and the computational framework is illustrated in Figure 3(b).
3.2 Selection of decision variables
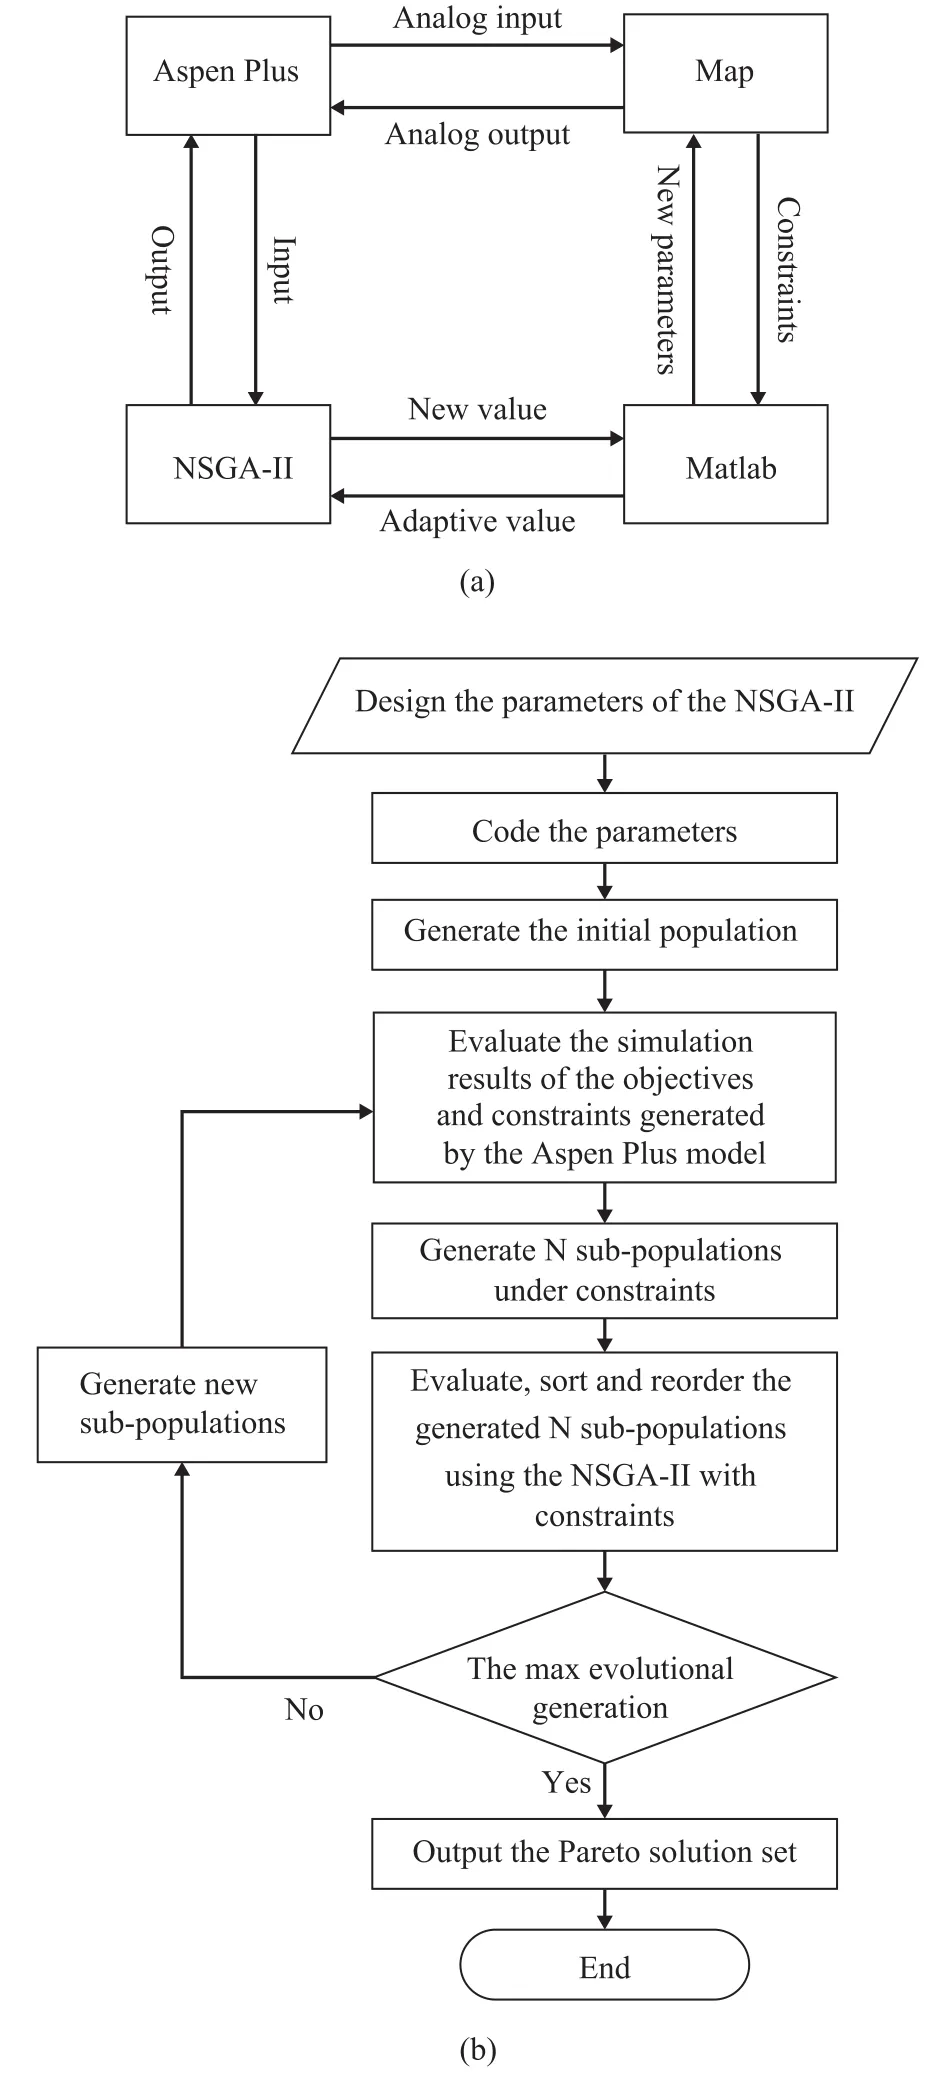
Figure 3 (a) Integration of software, and (b) computational framework
Decision variables play a non-negligible part in optimization procedure, because they not only can influence the computing results of the objectives, but also can affect the arrangement of the whole process fl ow of the crude unit. There are usually a couple of principles in selecting the decision variables, which respectively are as follows: (1) The decision variables need to be selected among the operating conditions; (2) The decision variables should be the control variables of the process; (3)The selected variables should be fluctuant and sensitive to turbulences. In this section of work, the sensitivity analysis of several operating variables is carried out to ascertain the appropriate decision variables, and some of the results are presented as graphs that are shown below.Therefore, Figure 4(a)-4(b) displays the influences of crude blending ratio and atmospheric furnace temperature on total product yield, respectively. Figure 5 reveals the effects of stripping steams on the quantities and properties of side-draw products. Figure 6 demonstrates the changes in quantities and properties of side-draw products along with the variation of heat transfer duty of the intermediate section of atmospheric tower.
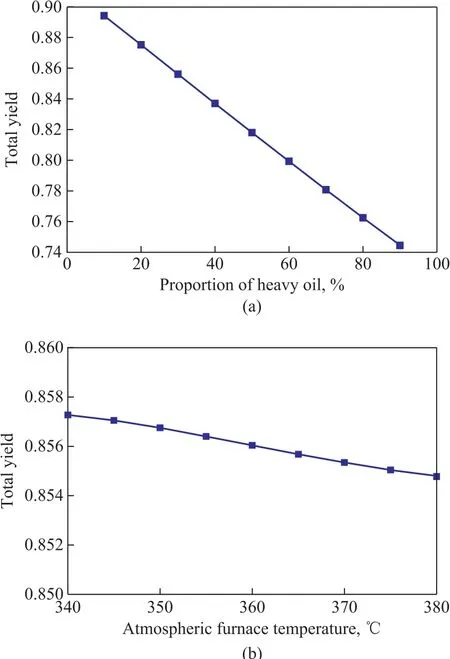
Figure 4 Effect of (a) blending ratio; (b) atmospheric furnace temperature on total yield
As shown in Figure 4(a), the wide change of the total product yield caused by the variation of heavy oil proportion signifies an important impact of blending ratio on yields of products, besides, the wide range of blending ratio itself means a high operating flexibility,and therefore the binary feed composition should be counted as the most important decision variable in this optimization strategy. As to the atmospheric furnace temperature, Figure 4(b) reveals an approximately inversely-proportional relationship between the total product yield and the atmospheric furnace temperature,and it can be inferred that the increase in the atmospheric furnace temperature will enhance the extraction ratio of the atmospheric column, but it will affect the yield and the quality of product extracted from the vacuum column. Thereupon, the atmospheric furnace temperature should be included in the decision variables array.Figure 5 demonstrates the effects of stripping steam on fl owrates and properties of side-draw products. In regard to the property aspect, the ASTM D86 temperature at 5%-recovery of each side-draw product is investigatedunder the premise of the design specification for keeping a constant ASTM D86 temperature for 95%-recovery of the relevant product. It can be seen from Figure 5 that the stripping steam flowrates have significant influences on the side-draw products and thus should be counted as the decision variables. And according to Figure 6, the pumparound duty of atmospheric tower can also influence the flowrates and properties of the side-draw products,and thereby the heat transfer of atmospheric column is a type of decision variable.
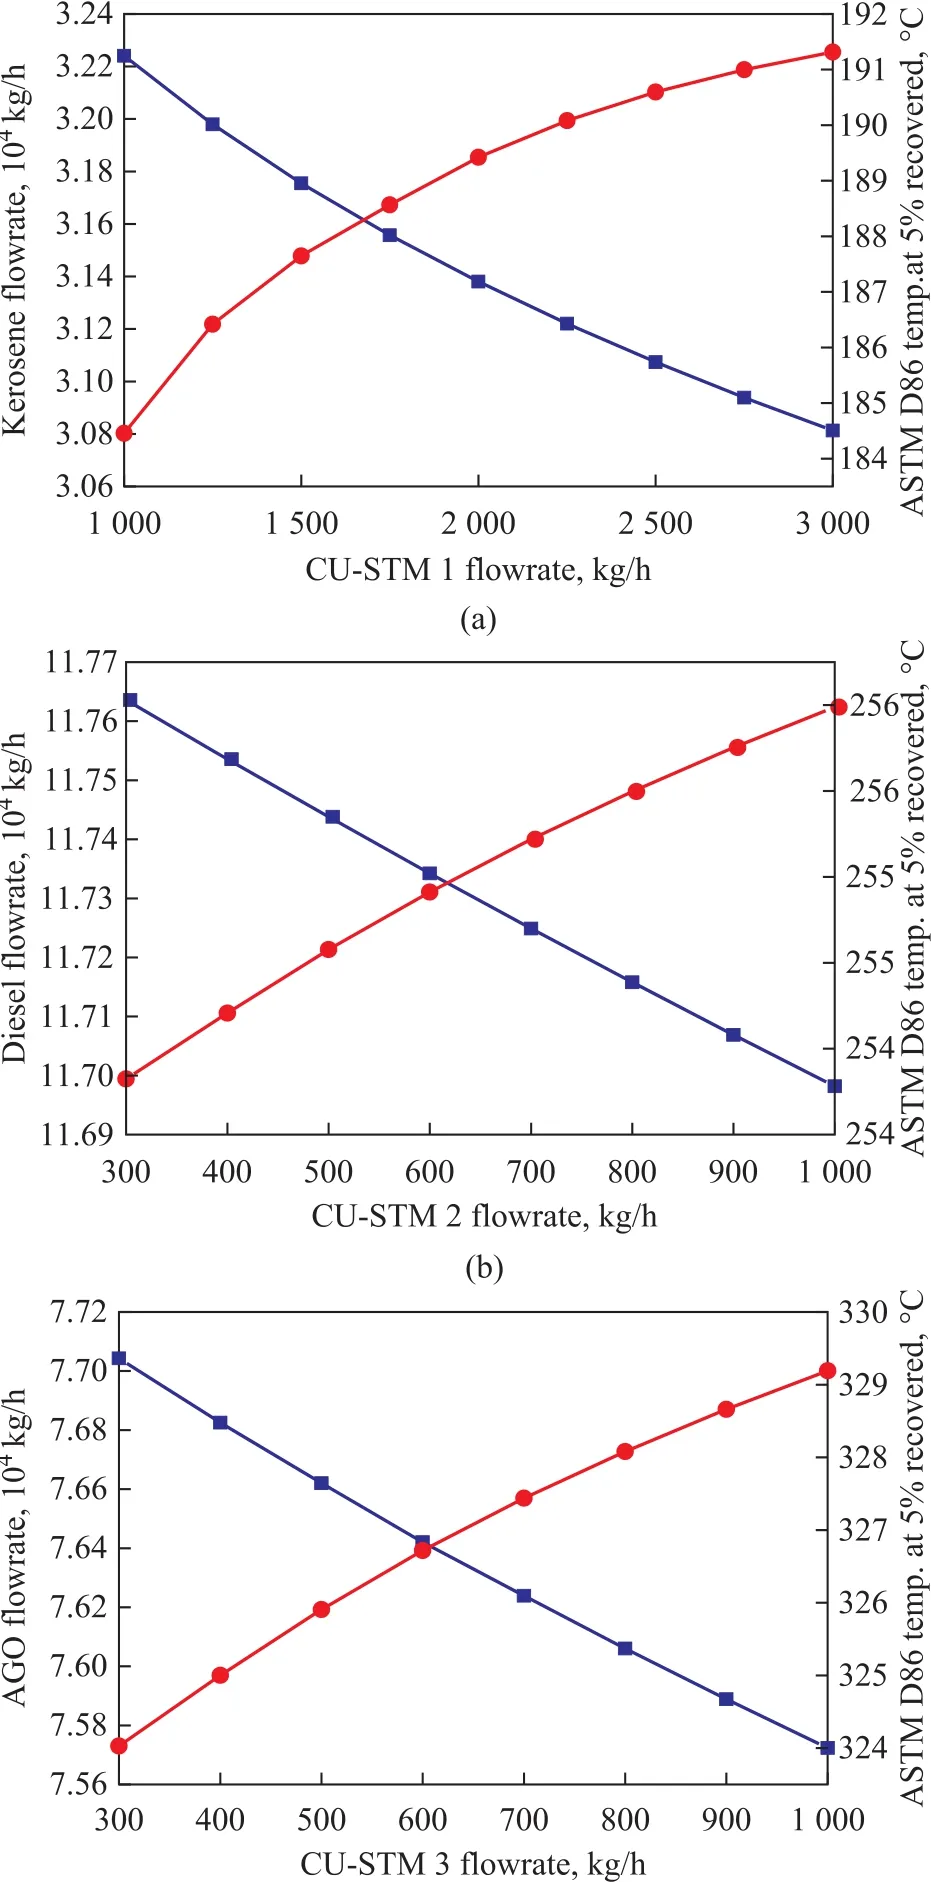
Figure 5 (a) Effect of CU-STM 1 flowrate on kerosene property; (b) Effect of CU-STM 2 flowrate on diesel property; (c) Effect of CU-STM 3 flowrate on AGO property■—Distillate flowrate; ●—ASTM D86 temp. at 5% recovery
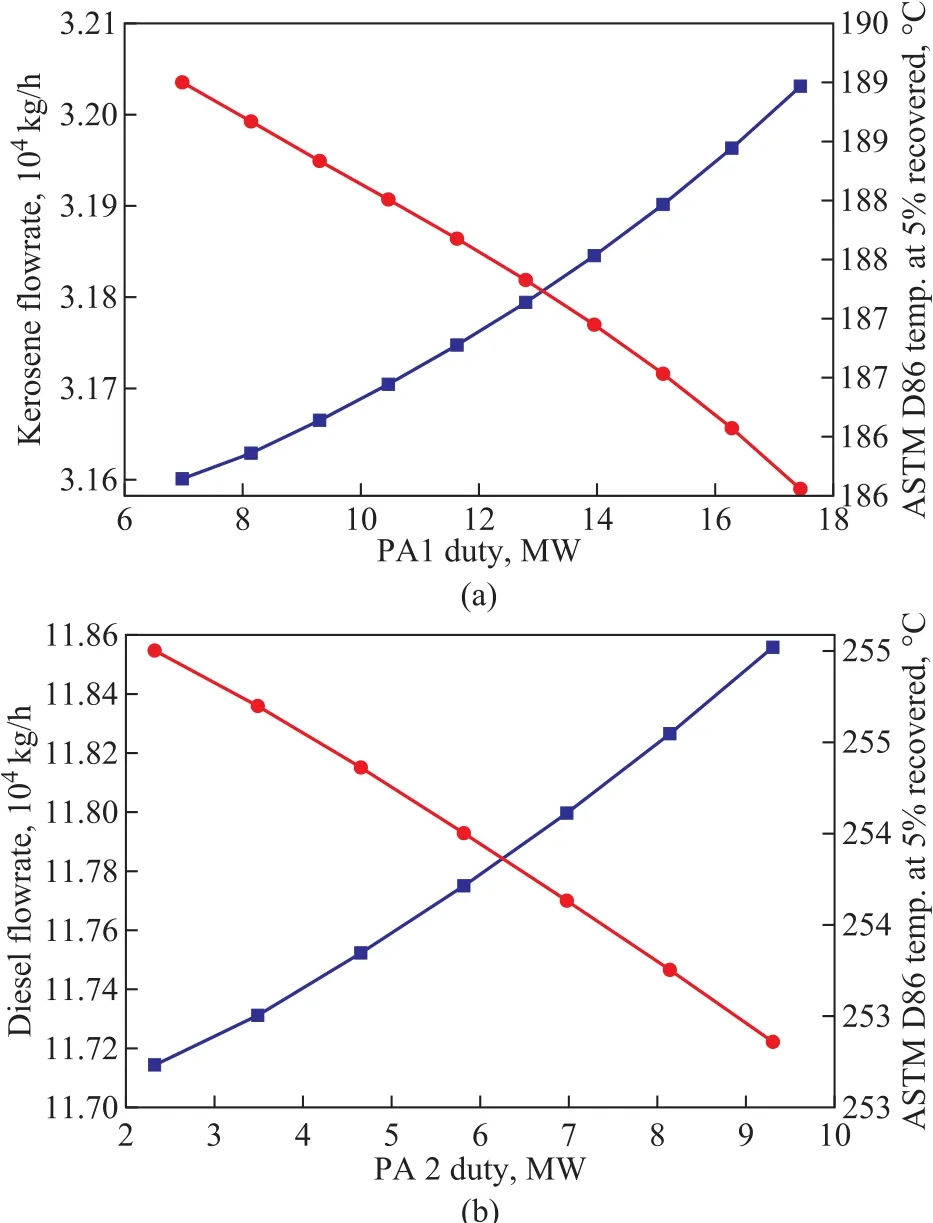
Figure 6 (a) Effect of PA1 duty on kerosene property; and(b) Effect of PA2 duty on diesel property■—Distillate flowrate; ●—ASTM D86 temp. at 5% recovery
Upon combining the analysis results mentioned above,the decision variable array for optimization shall comprise the blending ratio, the atmospheric furnace temperature,the stripping steam flowrates, and the heat transfer duty of pumparound of atmospheric column. Besides, the bottom stripping steam flowrate of atmospheric column and the vacuum column pumparound duty should also be included.
3.3 Objective functions
By taking into consideration the equipment operation,the energy utilization, the environmental protection and the economic benefit, three optimization objective functions will be investigated simultaneously, i.e. the furnace energy consumption, the CO2emissions and the economic benefit. Before optimization, the selected objective functions are calculated under nine conditions of different binary feed compositions so as to summarize the relationships between the objectives and the blending ratio, and furthermore to provide the comparable data for the multi-objective optimization.
3.3.1 Furnace energy consumption
The crude distillation system studied in this work has typically two furnaces without reboilers, and hence the total energy consumption is the sum of energy consumption of the atmospheric furnace and the vacuum furnace. To provide the comparable data for optimization results in following sections, Table 3 illustrates the changes of the total furnace energy consumption along with the different blending ratios for mixing feed oil.
Table 3 reveals a positive proportional relationship between the total energy consumption and the proportion of heavy oil in this crude distillation unit. Typically, the influence of crude oil gravity on energy consumption also relates to the composition of crude oil, the process fl ow and the product plan. The results presented in Table 3 will provide a guidance on the collaborative optimization in the following sections.
3.3.2 CO2emissions
The CO2emissions mainly come from the natural gas consumption, which is not related with the influence of the heat exchanger network. The objective function of CO2emissions can be calculated by means of Equation (1)[22]under the assumption that excess oxygen is supplied during the burning process.

in which FCO2stands for the CO2emissions (kg/h), QFuelrepresents the total energy consumption (kJ/h), and both of them can be imported from the results of computation by Aspen Plus. α is the CO2/C mass ratio, which is equal to 3.67, while σ and w represent the density (0.672 8 kg/m3)and the mass fraction of C (76%) of the natural gas,respectively. Here NHV is the heat value of the natural gas(34 200 kJ/m3). For purpose of obtaining the comparable database for the following optimization, Table 4 calculates the CO2emissions under different blending ratios in the crude oil feedstock.
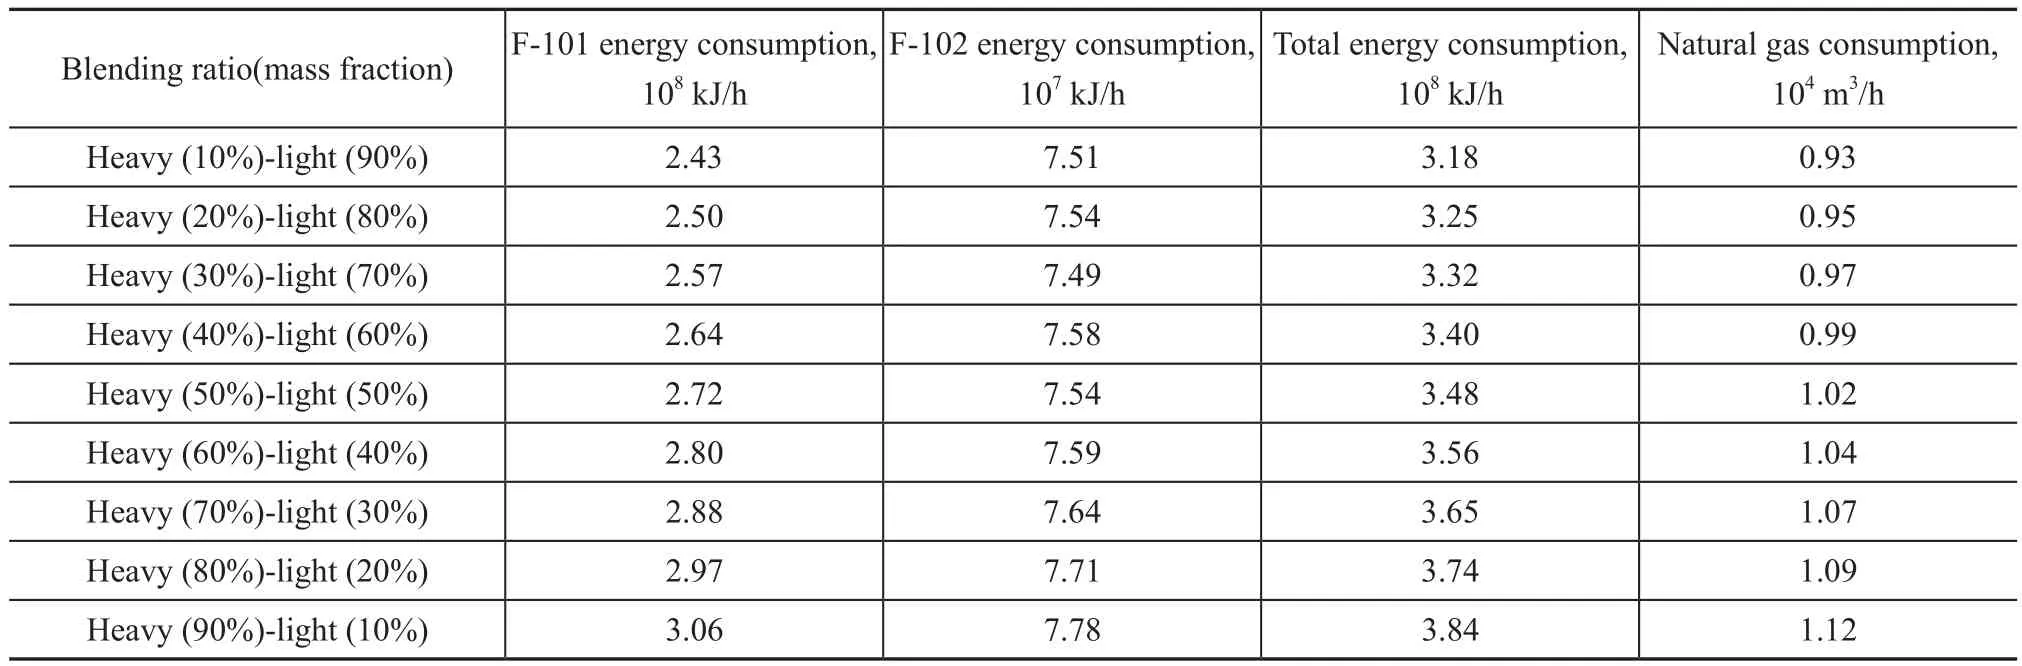
Table 3 Furnace energy consumption and fuel amount requirements under different blending ratios

Table 4 Total CO2 emissions under different blending ratios in the feedstock
Table 4 shows a significant change of the total CO2emissions depending upon the variation of blending ratio in the crude feedstock, and it can be inferred that the feed binary composition and operating parameters can influence the CO2emissions evidently.
3.3.3 Economic benefit
Besides the cost of the raw materials and fuel expenditure,the cooling water, the stripping steam, the electricity and other utilities also account for a considerable proportion of the total cost, and therefore, the total economic benefit should take all these expenses into consideration.Consequently, the economic benefit can be calculated by the following equations.
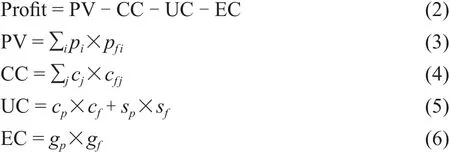
wherePV,CC,UCandECrepresent the product value,crude cost, utility cost and energy cost, respectively.piandpfistand for the price and flowrate of the producti,cjandcfjdenote the unit cost and flowrate of the oil typej,cpandcfrepresent the unit cost and flowrate of the cooling water,andspandsfdenote the price and flowrate of the superheated steam, whilegpandgfare the price and flowrate of the fuel gas. Table 5 shows the price/cost details of each item, which are collected from ICIS (an information company of RELX Group). The objective function of economic benefit is also calculated under nine different blending ratios to provide comparative figures necessary for the optimization, with the results depicted in Table 5.
According to Table 3 and Table 5, by combining the flowrates and prices of products and the material costs, the furnace energy consumption is tending to grow with an increasing heavy oil proportion in the crude oil feedstock,and favorably the total economic benefit also rises.
3.4 Constraints
In order to make the computed optimal solution set meet all the requirements of the actual devices, constraints are needed to limit the optimization process. In this work, the ASTM D86 temperature at 95% recovery of each product is selected as a constraint of the objective functions, and this is realized by configuring the design specifications in the Aspen Plus model. Table 6 demonstrates the details of the constraints of product specifications.
3.5 Selection of parameters of NSGA-II
The integration of software developed in this work fully combines the analog capability of Aspen Plus and the computational performance of Matlab, together with theoptimization strategy of the elitist state non-dominated sorting Genetic Algorithm, and this optimization framework can greatly improve the computational efficiency. During the computing procedure, the NSGA-II will assign the worst fitness to the individual, which represents the unreasonable working condition, and this individual will not participate in the next generation of genetic process of the optimization methodology, so that in this way the unreasonable working conditions will be correspondingly removed and the optimization results will be more practical and feasible.
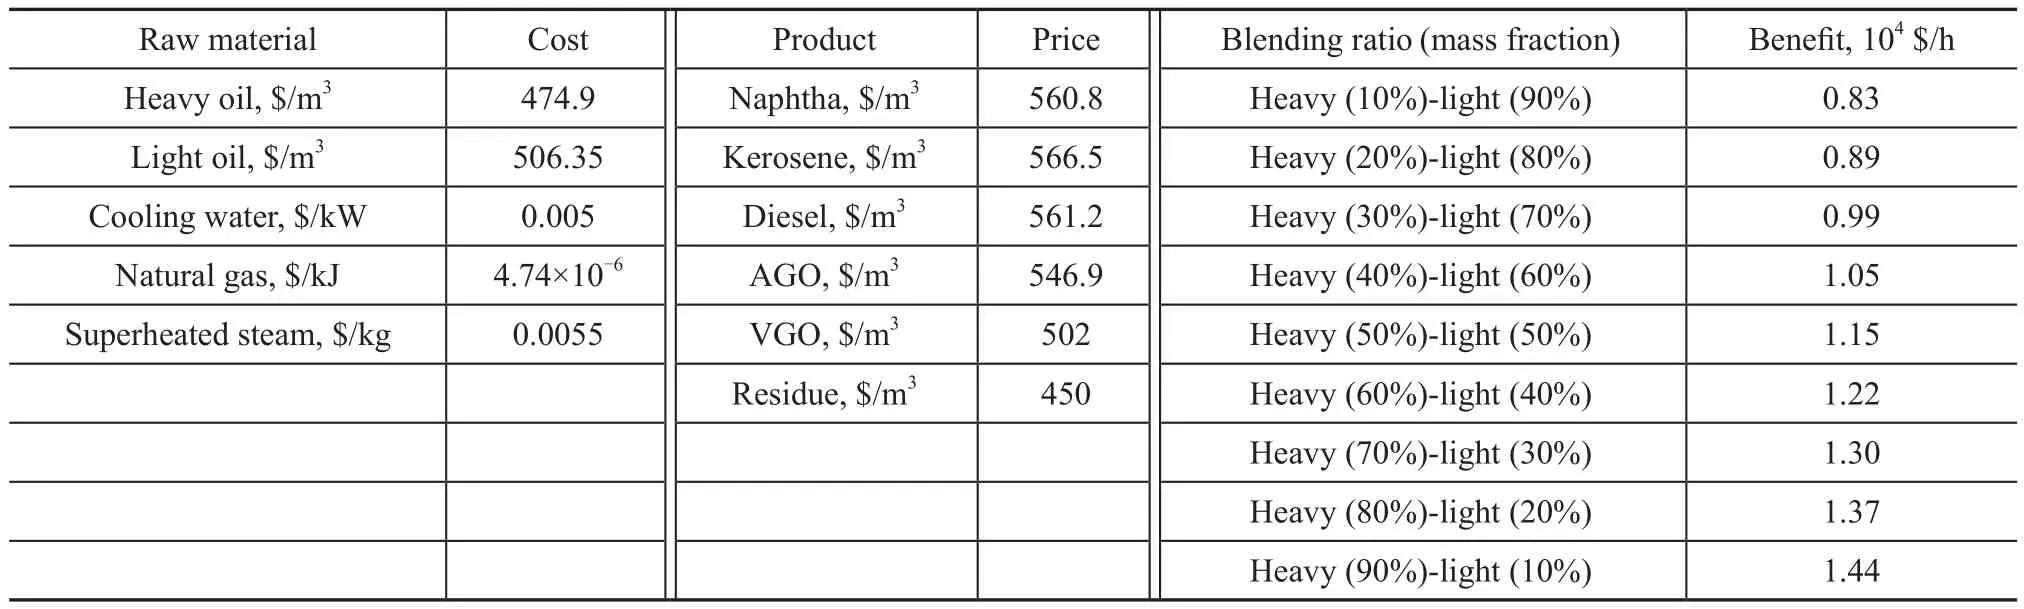
Table 5 Price and cost of raw materials, products, and utilities
Table 6 Constraints of product specifications
Typically, the main parameters of NSGA-II refer to the population size, the evolutional generation, the selection method, the crossover method and its probability as well as the mutation method and its probability. Before the multi-objective optimization, some double-objective computations are conducted to determine the appropriate mutation probability and the max evolutional generation, in which the objective functions of economic benefit and CO2emissions are employed. Figure 7 reveals the changes of the Pareto solution set along with the increment of the mutation probability.
According to Figure 7, the effect of the mutation probability on Pareto solution set is studied under constant evolutional generation and crossover probability,the value of which is 50 and 0.8, respectively. Judging from Figure 7(a) to 7(b) and then to 7(c), along with the increment of mutation probability from 0.001 to 0.01 and then to 0.05, the solution set range tends to expand,and the point density of the Pareto front gradually increases. When the mutation probability increases to 0.08 as demonstrated in Figure 7(d), the number of the optimal solutions is reduced. In the light of these changes,the optimal mutation probability is set to 0.05 in the following optimization procedure.
Figure 8 displays the effect of the evolutional generation on the Pareto solution set under constant mutation probability and crossover probability, the value of which is 0.05 and 0.8, respectively.
According to Figure 8 (a) to 8(c), the evolutional generation increases from 15 to 90, the Pareto solution set tends to concentrate gradually and the Pareto front is gradually forming, and till the 100thgeneration is demonstrated in Figure 8(d), the Pareto solution set and its front seem to have no obvious change as compared with the 90thgeneration. Therefore, the max evolutional generation of this optimization strategy is set to be 100.
In summary, the details of the optimization strategy proposed in this work are listed in Table 7.
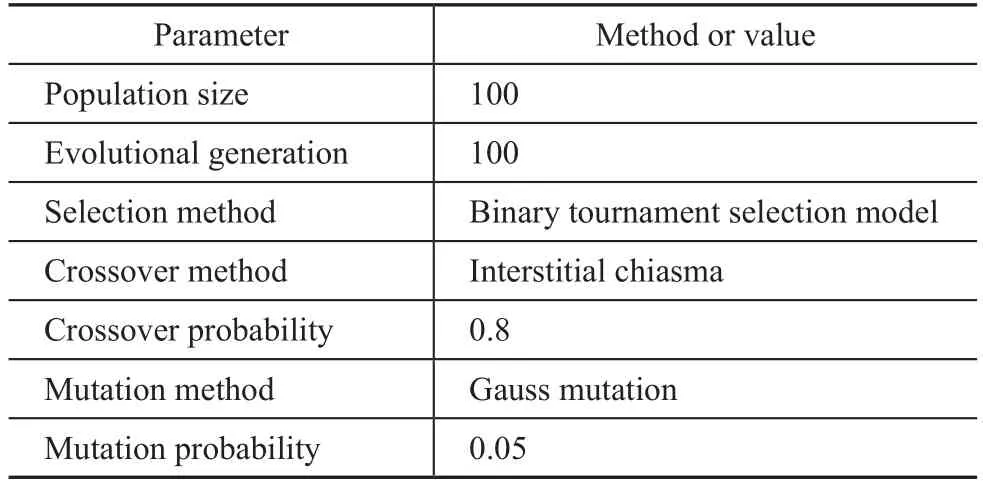
Table 7 Parameters of genetic algorithm
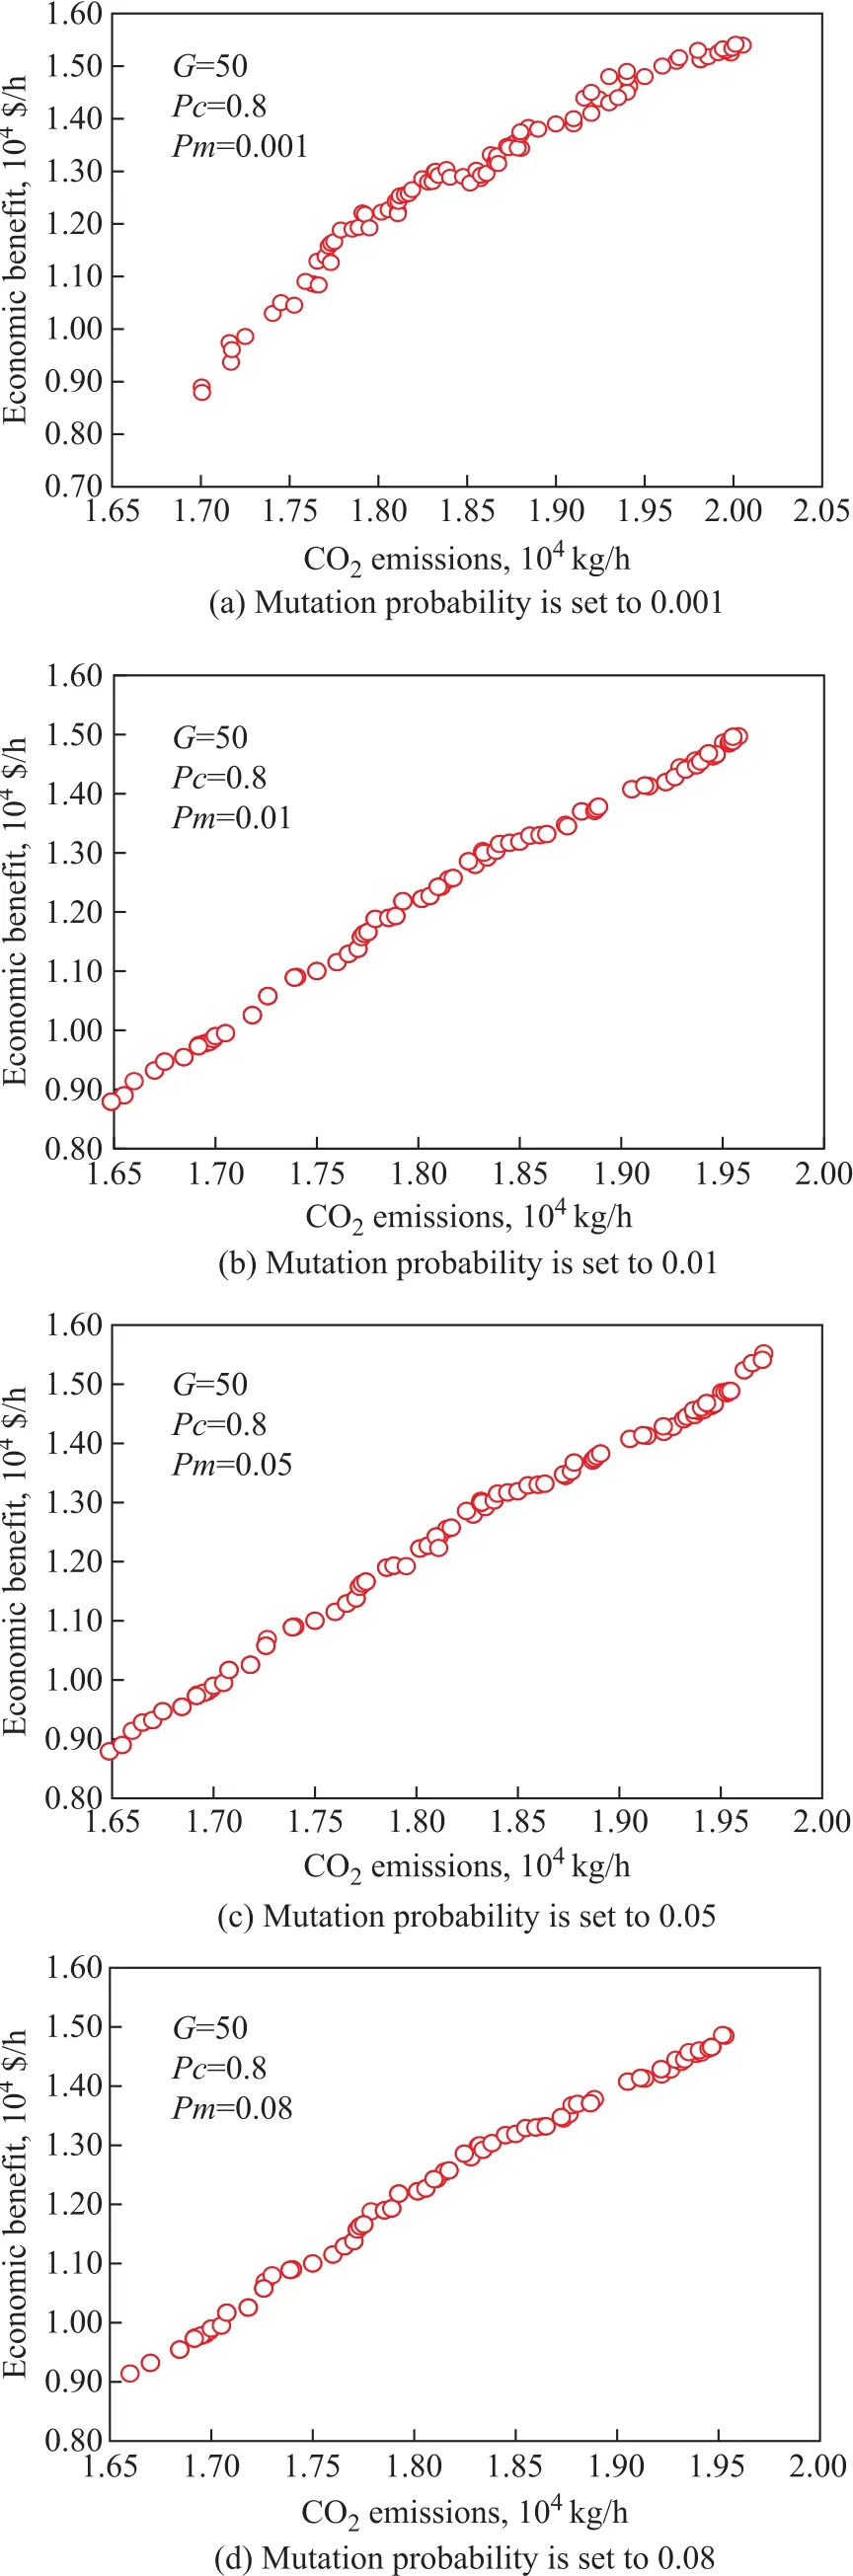
Figure 7 Effect of Gauss mutation probability on Pareto solution set
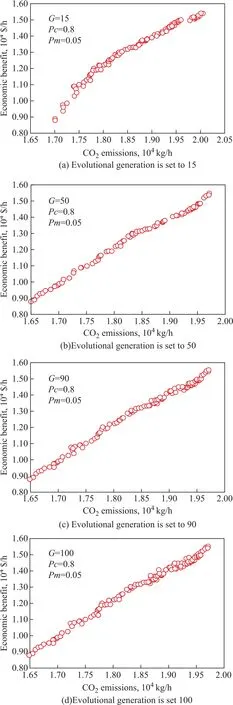
Figure 8 Effect of evolutional generation on Pareto solution set
4 Results and Discussion
After all the parameters are ascertained (i. e. the configuration of software, the selection of decision variables, the selection of objectives and constraints, and the selection of parameters of the optimization algorithm),the multi-objective coordinative optimization is carried out. Figure 9 illustrates the relationships between the objective functions under the constraints on keeping a constant 95%-recovery temperature of products.
In Figure 9, the square icon represents the minimum economic benefit (0.879×10⁴$/h) after optimization,which corresponds to the minimum CO2emissions(1.649×10⁴kg/h), the minimum energy consumption(3.005×10⁸kJ/h) and the heavy oil proportion of 0.1,while the triangle icon stands for the maximum economic benefit (1.552×10⁴$/h) after optimization, with the CO2emissions, the energy consumption, and the heavy oil proportion equating to 1.971×10⁴kg/h, 3.592×10⁸kJ/h,and 0.9, respectively. Upon comparing these two situations, the economic benefit of the latter has an advantage of 76.56% more than the former, the energy consumption and the CO2emissions, however, increase by 19.534% and 19.527% than the former, respectively.These all lead to the conclusion that the improvement of economic benefit will inevitably increase the energy consumption and CO2emissions. The optimization results of 9 different cases mentioned above are also computed and demonstrated in Table 8. Moreover, the comparative data before optimization are collected in Table 3, Table 4,and Table 5.
Based on the conclusion mentioned above, in order to increase the profit under the same energy consumption and the CO2emissions specified by the initial working condition, the optimal strategy is to adjust the blending ratio and other operating parameters. Figure 10 displays the final optimization results of the initial working condition (for purpose of improving the economic befit under the constant energy consumption and CO2emissions), with the optimal parameters after optimization depicted in Table 9.
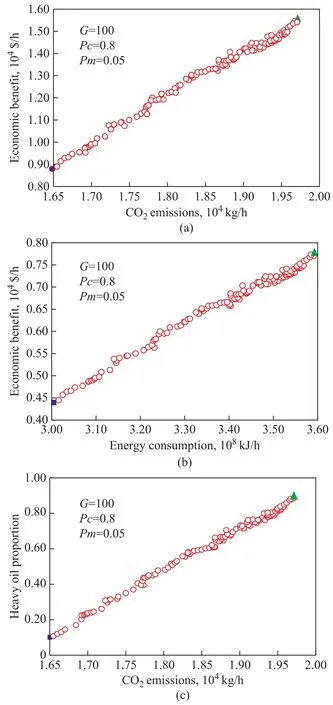
Figure 9 Relationship between (a) economic benefit and CO2 emissions; (b) economic benefit and energy consumption; and (c) heavy oil proportion and CO2 emissions
In Figure 10, the star icon represents the initial working condition, which specifies the energy consumption, CO2emissions, economic benefit and heavy oil proportion to be 3.4×10⁸kJ/h, 1.87×10⁴kg/h, 1.05×10⁴$/h and 0.3,respectively. It can be seen obviously that the initial working condition has a significant potential for profit improvement under the same energy consumption and CO2emissions. It can be learned from Table 9 that by adjusting the blending ratio (the heavy oil proportion is changed from 0.3 to 0.61) and other operating parameters,the economic benefit can be increased to 1.32×10⁴$/h without increasing the energy expenditure and CO2emissions, which means a 25.71% increase of profit forthe refinery. Thus, the optimization strategy proposed in this paper is proved more economical and feasible in solving the practical problems of refineries.
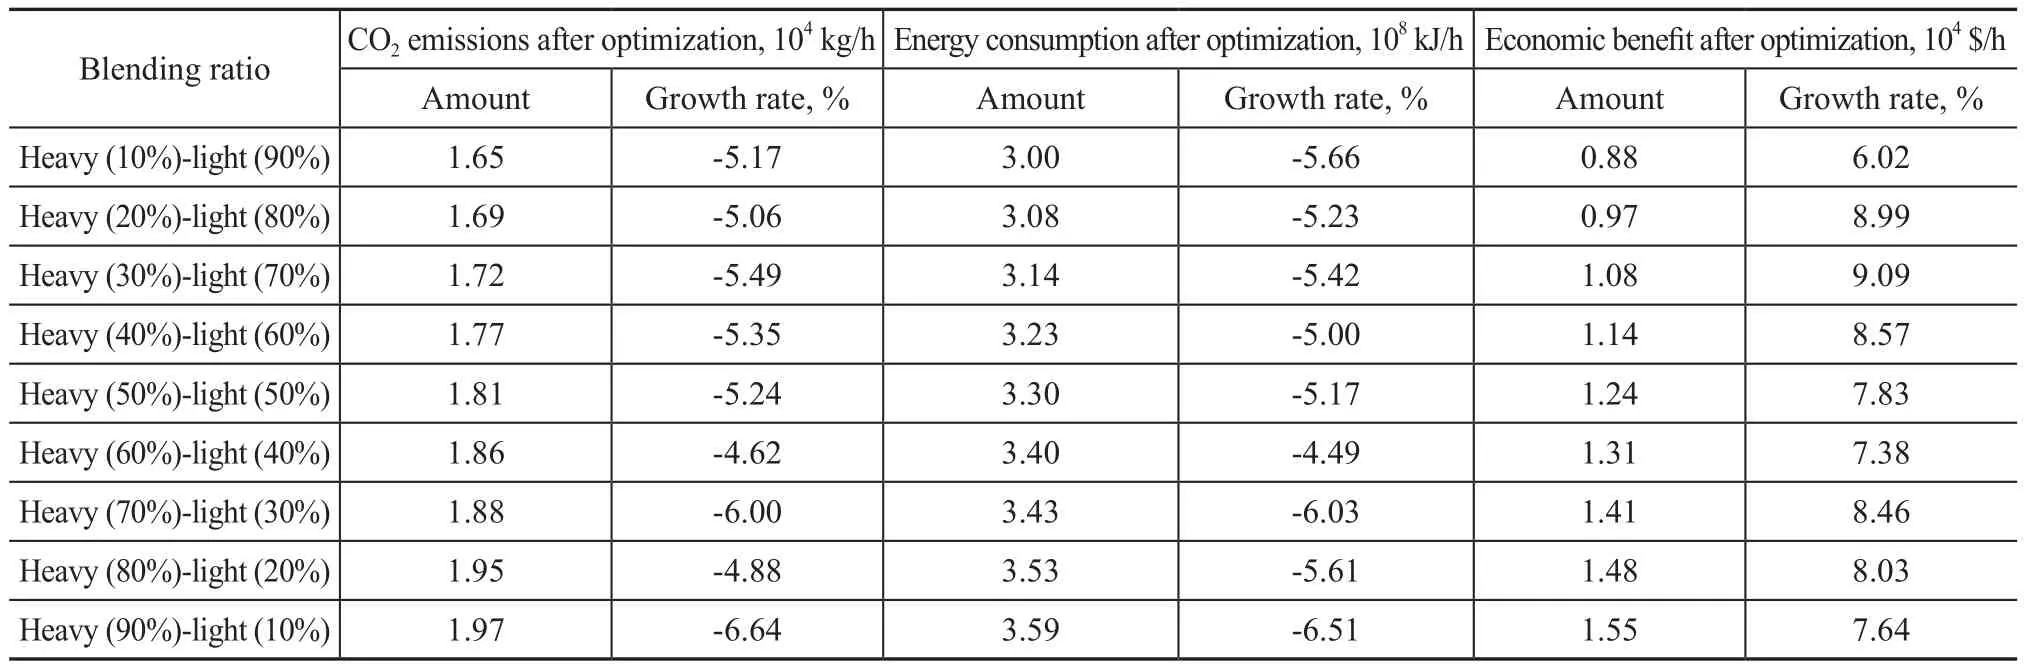
Table 8 Optimization results under different blending ratios of crude oils
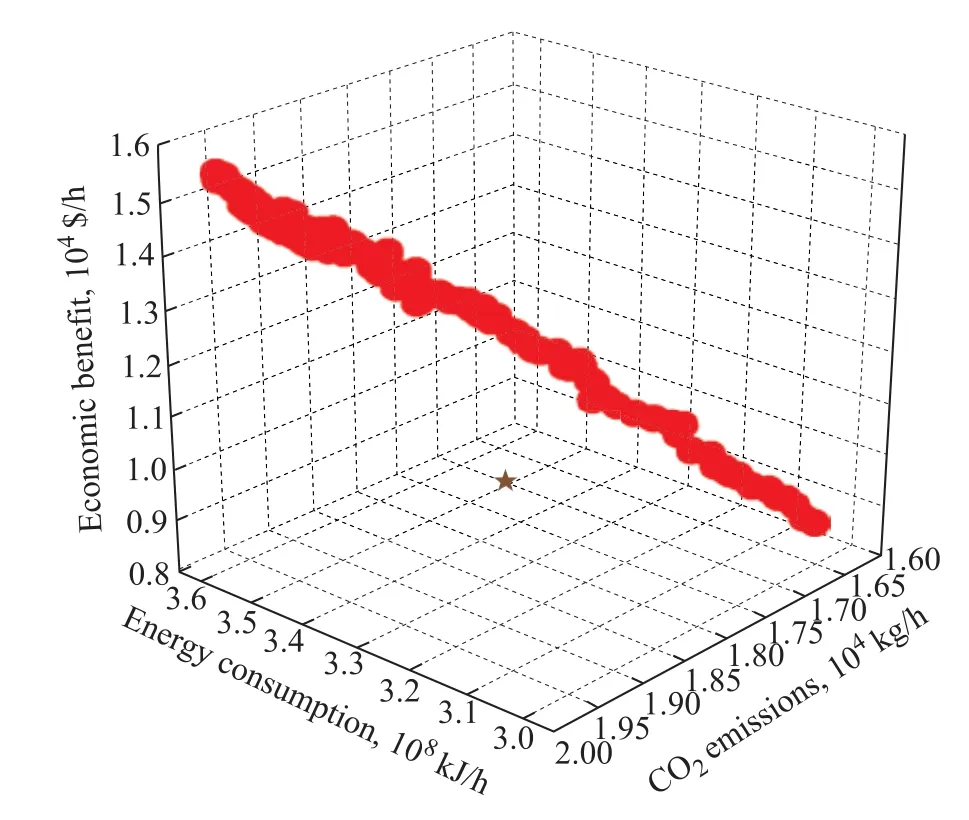
Figure 10 Results after optimization of the initial working condition
5 Conclusions
In this paper, the NSGA-II based multi-objective optimization is implemented by illustrating an example of an operating atmospheric and vacuum distillation unit. The relationships between the objective functions are studied and the results show that the increment of economic benefit will inevitably lead to the surge of energy consumption and CO2emissions. However, the initial working condition can be optimized to obtain a 25.71% increment of profit without increasing the energy consumption and CO2emissions by changing the heavy oil proportion to 0.61 from the initial value of 0.3, and the optimal operating parameters also change with thevariation of heavy oil proportion as well.
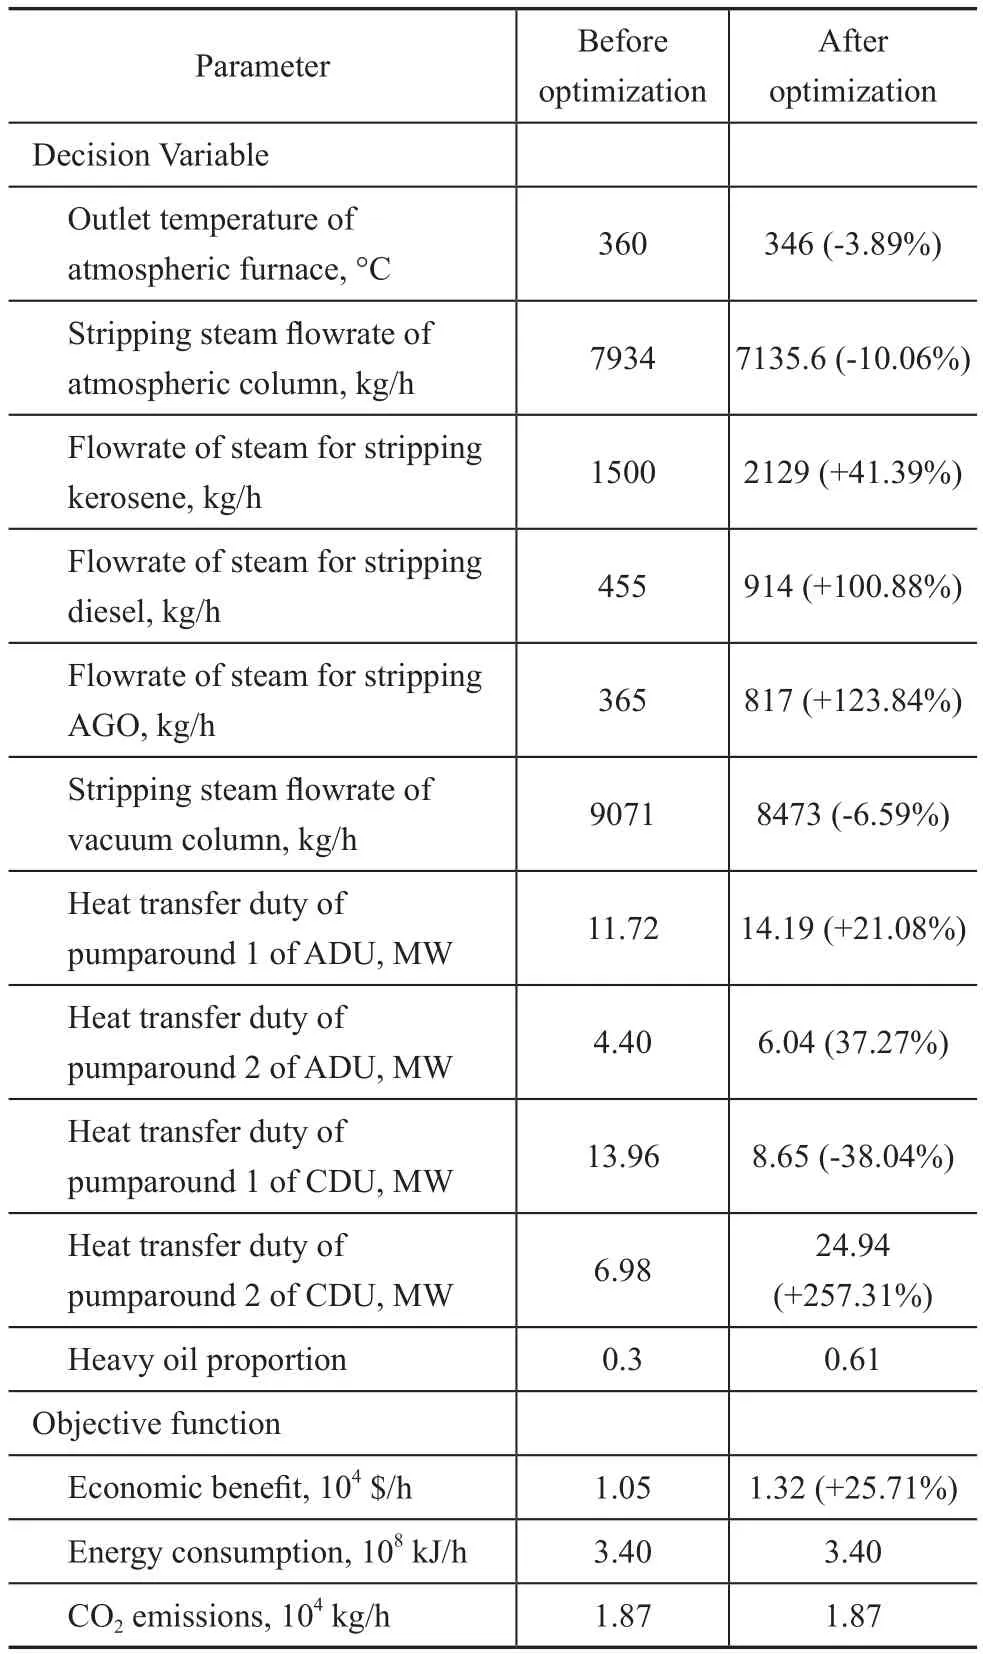
Table 9 Parameters resulted from optimizing the initial working condition
Overall, the comparison results indicate that the optimization strategy proposed in this paper can optimize the fractionation system with sufficient accuracy, thus making it possible to be employed in refineries.
Acknowledgement: This work is supported financially by the Promotive Research Fund for Excellent Young and Middle-aged Scientists of Shandong Province (Grant No. BS2014NJ010) and the National Natural Science Foundation of China (Grant No.21506255).
[1]Bravo J L, Fair J R, Humphrey J L. Fluid mixture separation technologies for cost reduction and process improvement[M]. Noyes Publications, New York, 1986
[2]Majuri P. Ground source heat pumps and environmental policy - the Finnish practitioner's point of view[J]. J Clean Prod, 2016, 139: 740–749
[3]Romani A, Pinelli P, Ieri F, et al. Sustainability, innovation,and green chemistry in the production and valorization of phenolic extracts from Olea europaea L[J]. Sustainability,2016, 8(10): 1002
[4]Tolaymat T, Abdelraheem W, Badawy A E, et al. The path towards healthier societies, environments, and economies:a broader perspective for sustainable engineered nanomaterials[J]. Clean Technol Environ Policy, 2016,18(7): 2279–2291
[5]Mittal V, Zhang J, Yang X, et al. E3 Analysis for crude and vacuum distillation system[J]. Chem Eng Technol, 2011,34(11): 1854–1863
[6]Chen M. Techno-economic analysis on processing of heavy and poor residual oil[J]. Chemical Industry & Engineering Progress, 2010, 29(9): 1781–1784
[7]Waheed M A, Oni A O. Thermoeconomic and environmental assessment of a crude oil distillation unit of a Nigerian refinery[J]. App Therm Eng, 2014, 66(1/2):191–205
[8]Wang Y, Hou Y, Gao H, et al. Selecting the optimum predistillation scheme for heavy crude oils[J]. Ind Eng Chem Res, 2011, 50(18): 10549–10556
[9]More R K, Bulasara V K, Uppaluri R, et al. Optimization of crude distillation system using Aspen Plus: effect of binary feed selection on grass-root design[J]. Chem Eng Res Des, 2010, 88(2): 121–134
[10]Aires M, Lucena A, Rocha R, et al. Optimizing the petroleum supply chain at Petrobras[J]. Aided Chem Eng,2004, 18(04): 871–876
[11]Huang X, Li N, Li J, et al. Multi-objective optimization of crude and vacuum distillation system based on genetic algorithm[J]. Journal of China University of Petroleum(Edition of Natural Science), 2016, 40(2): 163–168 (in Chinese)
[12]Ochoa-Estopier L M, Jobson M, Smith R. Operational optimization of crude oil distillation systems using artificial neural networks[J]. Comput Chem Eng, 2013, 59(5): 178–185
[13]Lemos J C, Assis B C G, Costa A L H, et al. A sliding mixed-integer linear programming approach for the optimization of the cleaning schedule of crude preheat trains[J]. Heat Transfer Engineering, 2015, 36(7/8): 642–651
[14]Ochoa-Estopier L M, Jobson M, Smith R. Retrofit of heat exchanger networks for optimising crude oil distillation operation[J]. Chem Eng Trans, 2013, 35: 133–138
[15]Smith R, Ochoa-Estopier L M, Jobson M. The use of reduced models in the optimization of energy integrated processes[J]. Chem Eng Trans, 2013, 35: 139–144
[16]Ochoa-Estopier L M, Jobson M, Smith R. The use of reduced models for design and optimisation of heatintegrated crude oil distillation systems[J]. Energy, 2014,75: 5–13
[17]Psaltis A, Sinoquet D, Pagot A. Systematic optimization methodology for heat exchanger network and simultaneous process design[J]. Comput Chem Eng, 2016, 95: 146–160
[18]Luo Y, Wang L, Wang H, et al. Simultaneous optimization of heat-integrated crude oil distillation systems[J]. Chinese J Chem Eng, 2015, 23(9): 1518–1522
[19]Gadalla M, Jobson M, Smith R. Optimization of existing heat-integrated refinery distillation systems[J]. Chem Eng Res Des, 2003, 81(1): 147–152
[20]Gadalla M, Jobson M, Smith R. Shortcut models for retrofit design of distillation columns[J]. Chem Eng Res Des, 2003, 81(8): 971–986
[21]Gadalla M, Olujic Z, Jobson M, et al. Estimation and reduction of CO emissions from crude oil distillation units[J]. Energy, 2006, 31(13): 2398–2408
[22]Gadalla M, Olujic Z, Jansens P, et al. Reducing CO2emissions and energy consumption of heat-integrated distillation systems[J]. Environ Sci Technol, 2005, 39(17):6860–6870
杂志排行

中国炼油与石油化工的其它文章
- Influence of Initial Water Content on Synthesis of Silicalite-1 Zeolite
- Study on Catalytic Alkylation of Benzene with Methanol over ZSM-22 and ZSM-35
- Preparation of Novel Dechlorination Adsorbent and Study on Its Adsorption Mechanism
- The Function of β Zeolite for Enhancing the Propylene Yield in FCC Process
- Synthesis and Tribological Properties of Graphene-Copper Nanoparticle Composites as Lithium Grease Additive
- Preparation of AgCeY Zeolite Using Microwave Irradiation and Its Adsorptive Desulfurization Performance