Preparation of AgCeY Zeolite Using Microwave Irradiation and Its Adsorptive Desulfurization Performance
2018-01-19QuChenSongHuaSongHualinGaoHuijieYangGangLiXiaojuan
Qu Chen; Song Hua; Song Hualin; Gao Huijie; Yang Gang; Li Xiaojuan
(1. Provincial Key Laboratory of Oil & Gas Chemical Technology, College of Chemistry & Chemical Engineering,Northeast Petroleum University, Daqing 163318; 2. Key Laboratory of Cancer Prevention and Treatment of Heilongjiang Province, Mudanjiang Medical University, Mudanjiang 157001)
1 Introduction
With the growing awareness of environmental protection and the great needs for making ultralow sulfur fuels used in fuel cells and other devices, the deep and ultra-deep removal of sulfur from transportation fuels has become more and more important[1-2]. It is well known that adsorptive desulfurization (ADS) is one of the promising methods for deep desulfurization, because this approach has some advantages, such as being able to obtain zerosulfur fuels, while operating under ambient conditions without causing the loss of octane value[3]. The adsorption techniques are highly dependent on the properties of adsorbents. The NaY zeolite is regarded as a promising catalytic material for adsorptive desulfurization (ADS)[4]. The conventional liquid-phase ion-exchange method is commonly adopted for the preparation of metals modified NaY zeolite[5]. Tajbakhsh, et al.[6]had successfully prepared the nano-Fe/NaY zeolite via the ion-exchange procedure. Qin, et al.[7]have prepared Cu(II)Y zeolite through the liquid phase ion exchange of NaY with Cu(NO3)2aqueous solution at 90 °C for 48 h. However,the conventional liquid-phase ion-exchange method is quite time-consuming.
The microwave irradiation method, which can provide a significant amount of energy within a few seconds,is usually adopted in the synthesis of materials. The microwave assisted processes are fast, easy and energyefficient[8]. Bukhari, et al.[9]have prepared the Na-A zeolite via microwave irradiation, and found that the time of zeolitization process was reduced from several hours to several minutes by using the microwave irradiation. Hasan, et al.[10]had prepared the mesoporous ZSM-5 zeolite by desilication in alkaline solution under microwave irradiation. They found that the microwave irradiation method was more efficient than the conventional electric heating method under hydrothermal conditions. Meanwhile in our previous studies[11], theAgY zeolite was prepared via the microwave irradiation.The results indicated that the ion-exchange time could be reduced from 2 h to 20 min by using the microwave irradiation method. In addition, compared to the AgY zeolite prepared by the conventional ion-exchange method, the AgY zeolite sample, which was prepared by microwave irradiation, exhibited a higher adsorptive desulfurization activity. Our group[12-13]had prepared the Ag-Ce bimetal ion-exchanged NaY zeolite via the conventional ion exchange method. The obtained AgCeY zeolite possessed high sulfur removal capacity and selectivity. However, the preparation process needs two ion-exchange steps, each of which proceeds for 24 h at moderate temperature, which is quite timeconsuming. Therefore, it is of interest to investigate the possible route for reducing the time for preparation of AgCeY zeolite.
In this paper, the AgCeY zeolite was successfully prepared via the microwave-assisted liquid ion exchange method, and the effects of microwave preparation conditions on desulfurization were investigated. In addition, the adsorption kinetics and thermodynamics were also studied.
2 Experimental
2.1 Materials
Thiophene (TP, 99% pure) and benzothiophene (BT,98% pure) were purchased from the J&K Chemical Ltd.,China. The NaY zeolite (with a Si/Al ratio of 5.3) in powder form was purchased from the catalyst factory of the Nankai University. AgNO3·3H2O, Ce(NO3)3·6H2O,and toluene were obtained as commercial analytical grade reagents without further puri fi cation.
2.2 Model oil sample
The model oil with a total sulfur concentration of 200 mg/L was made by adding TP (100 mg/L) and BT (100 mg/L)with toluene (500 mg/L) into n-octane serving as the solvent.
2.3 Adsorbent preparation
NaY zeolite with a Si/Al ratio of 5.3 was used as the parent material. Firstly, the AgY zeolite was prepared by microwave-assisted liquid ion exchange of NaY zeolite with the 0.1 mol/L of AgNO3aqueous solution[11]. Then 1.0 g of AgY zeolite was suspended in a 0.25 mol/L of Ce(NO3)3aqueous solution. After microwave treatment at different temperature and microwave power, the adsorbent was filtered out, washed thoroughly with deionized water, and then dried at 110 °C, and calcined at 500 °C successively. The obtained adsorbent was denoted as AgCeY–X–Y–T, where the letter X, Y, and T was the irradiation power (W), time (min), and temperature (°C),respectively. For comparison, the AgCeY zeolite was also prepared by conventional ion exchange method labeled as AgCeY–I. The preparation steps were same as those for AgCeY–X–Y–T except for the ion exchange step, which was performed at room temperature for 24 h without microwave irradiation.
2.4 Adsorbent characterization
The X-ray diffraction (XRD) analysis of the samples was carried out on a D/max-2200PC X-ray diffractometer. The typical physico-chemical properties were analyzed by the N2-adsorption for specific surface area measurement using a Micromeritics NOVA 2000e adsorption equipment.The Fourier transform infrared spectra of pyridine (Py-FTIR) adsorption were obtained on a Nicolet Avatar 360 spectrometer. The X-ray photoelectron spectroscopy(XPS) spectra were acquired using an ESCALAB MKII spectrometer.
2.5 Static adsorptive desulfurization experiment
For each experimental run, 0.2 g of zeolite was added into a conical flask containing 20 mL of model oil at 50 °C, which was kept under magnetic stirring for 1 h.The reactant was centrifuged and the oil was analyzed for residual sulfur concentration with a flame photometric detector-gas chromatograph (PerkinElmer Clarus 680 GC).
3 Results and Discussion
3.1 Adsorbent characterization
3.1.1 X-ray diffraction (XRD) analysis
The XRD patterns of NaY, AgCeY–I and AgCeY–400–20–70 zeolites are presented in Figure 1. It can be seen that the AgCeY–400–20–70 zeolite displayed a similar XRD pattern as the parent NaY zeolite, especially in the 2θrange of 20°—35°, indicating that the structure of zeolites was well retained[14]. When the AgCeY–400–20–70 zeolite had been loaded with Ag or Ce metals, no obviously new diffraction peaks were detected, which might be attributed to the trace amount of new generated AgOx, CeOx, or pure metal phase. In comparison with the original NaY zeolite, the intensity of the diffraction peaks of the AgCeY–400–20–70 zeolite declined significantly. This may occur due to local overheating of the zeolite by microwave irradiation, which can lead to partial collapse of the lattice structure, which may also be resulted from the excessive ion exchange and calcination[15]. Meanwhile the color of zeolite changed from white to yellow after calcination at 500 °C in air atmosphere, suggesting that Ce3+ions had been oxidized to Ce4+ions[16]. The XRD pattern of AgCeY–I zeolite was similar to that of AgCeY–400–20–70 zeolite, showing that the original adsorbent structure was also retained in the AgCeY–I zeolite.
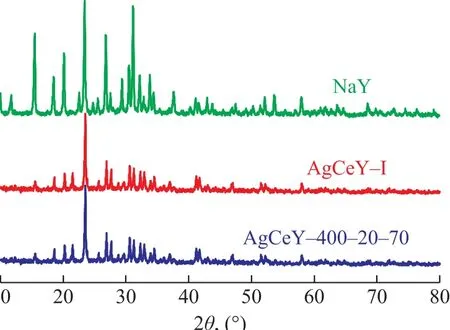
Figure 1 XRD patterns of metal ion-exchanged Y zeolites
3.1.2 Brunauer–Emmett–Teller (BET) analysis
The textural parameters of NaY and AgCeY zeolites are shown in Table 1. It can be seen that the AgCeY–400–20–70 zeolite showed a specific surface area of 534 m2/g with a pore volume of 0.30 cm3/g. The AgCeY–I zeolite showed similar results. The surface area(620 m2/g) and pore volume (0.36 cm3/g) of NaY zeolite decreased obviously with the decrease in pore diameter after ion exchange, indicating that ion exchange and calcination caused the decrease of zeolite crystallinity,which was consistent with the XRD analysis.
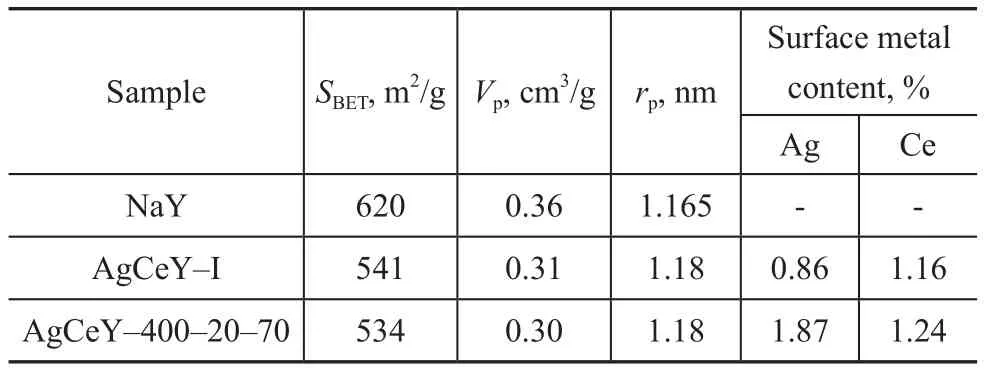
Table 1 Textural properties of NaY, AgCeY–I and AgCeY–400–20–70 zeolites
3.1.3 X-ray photoelectron spectroscopy (XPS)
The XPS spectra of zeolites are shown in Figure 2. The Ag 3d spectra of zeolites (Figure 2(a)) illustrated that the binding energy (BE) value of Ag 3d5/2was close to 368.9 eV, while that of Ag 3d3/2was approximately 347.9 eV,and therefore the valence of Ag ion was confirmed to be+1, indicating that the loaded silver element existed as Ag+ion on the surface of the AgCeY zeolites[17]. Similarly, the Ce 3d5/2and Ce 3d3/2spectra of the zeolites are shown in Figure 2(b). As the data reported, the BE value of Ce 3d5/2in CeO2was 905.9 eV and that of Ce 3d3/2in CeO2was 883.5 eV, which could be assigned to Ce4+[18]. This fact indicated that the ion-exchanged Ce3+ions on zeolites were oxidized to Ce4+ions through calcination. Furthermore,the peak intensity for Ag+and Ce4+of AgCeY–400–20–70 zeolite in the Ag 3d and Ce 3d spectra was both higher than that of AgCeY–I zeolite, indicating to the existence of more Ag+and Ce4+ions in the AgCeY–400–20–70 zeolite as compared to the AgCeY–I zeolite. The contents of different elements on surface of the zeolites are shown in Figure 2(c). There are Ag, Ce, Si, and Al elements on the surface of the zeolites, along with oxygen and a small amount of carbon. The C 1s was composed of C–C bond,indicating that the carbon was primarily emanated from the atmospheric pollutants. The content of elements on the surface of zeolites is listed in Table 2. The content of Ag+and Ce4+on the surface of the AgCeY–I zeolite is 1.54%and 1.07%, respectively. However, on the surface of the AgCeY–400–20–70 zeolite, prepared by the microwaveassisted liquid ion exchange, the content of Ag+and Ce4+is 1.87% and 1.24%, respectively. This result shows that the microwave-assisted liquid ion exchange method is beneficial to loading more active Ag+and Ce4+ions on zeolites, which could improve the adsorption performance of zeolites.
3.1.4 Py-infrared (Py-IR) analysis
The Py-infrared (IR) spectra of the pyridine adsorbed on the AgCeY–I and the AgCeY–400–20–70 zeolites at 150 °C and 350 °C are shown in Figure 3. The Lewis and Brønsted acidity values are listed in Table 3[19]. It can be seen clearly from Figure 3 that the band at 1 486 cm-1could be ascribed to the contribution of both Lewis and Brønsted acid sites.The bands at 1 445 cm-1and 1 596 cm-1are characteristic of the Lewis acid sites, whereas the bands at 1 540 cm-1and 1 631 cm-1are characteristic of the Brønsted acid sites. Obviously, the amount of Brønsted acid sites of AgCeY–400–20–70 zeolite at the desorption temperature of 150 °C and 350 °C is 82.0 μmol/g and 31.3 μmol/g,respectively. While the amount of Lewis acid sites of the AgCeY–400–20–70 zeolite at the desorption temperature of 150 °C and 300 °C is 444.9 μmol/g and 58.7 μmol/g,respectively. It is clear that the amount of Lewis acid is more than that of Brønsted acid (Table 3) on both zeolites,and the amount of weak Lewis acid is much higher than that of strong acid, showing that the weak Lewis acidic sites were predominant[20]. The AgCeY–400–20–70 zeolite exhibited much higher Lewis acidity but lower Brønsted acidity than the case of AgCeY–I zeolite. Since the Ag+and Ce4+ions functioned as electron acceptors and could form–O–Ag and –O–Ce structures on the NaY zeolite, Lewis acid sites were formed[21]. Therefore, the higher Lewis acidity of AgCeY–400–20–70 zeolite can be attributed to its high Ag+and Ce4+contents on the surface, as it has been discussed previously (Table 2).
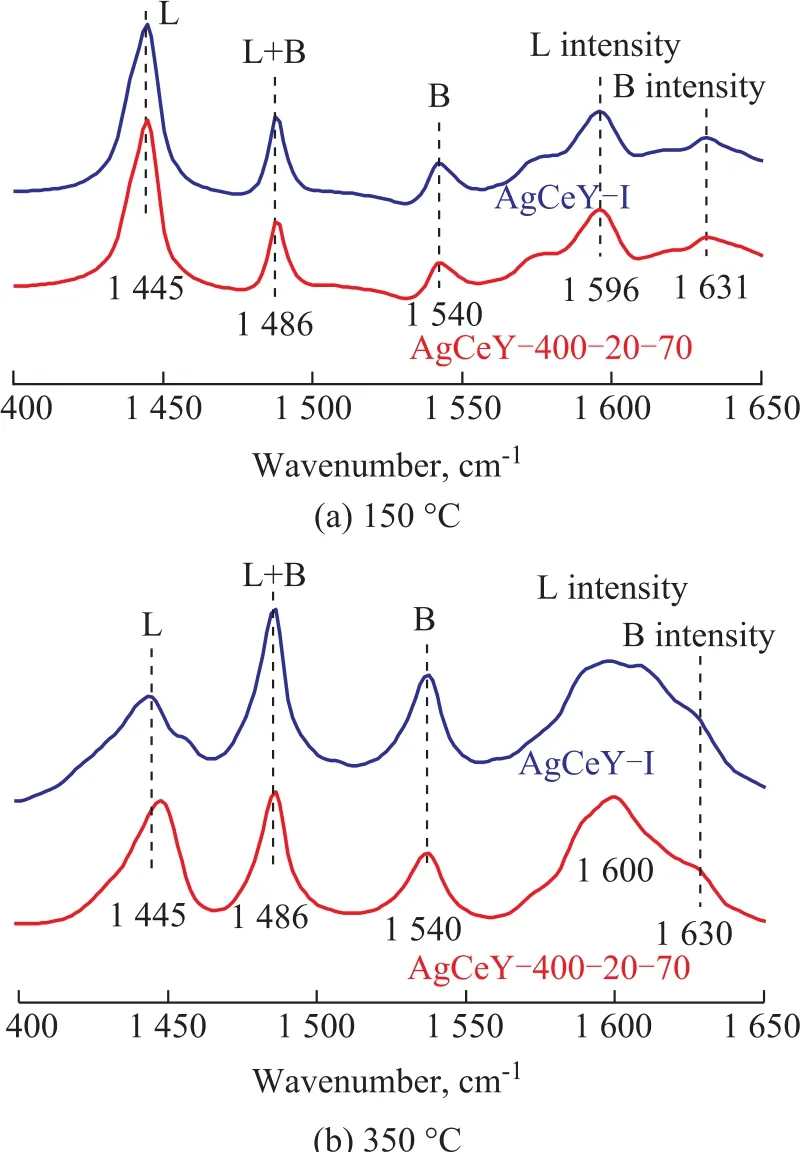
Figure 3 Py-IR pyridine thermo-desorption spectra of AgCeY zeolite at 150 °C and 350 °C
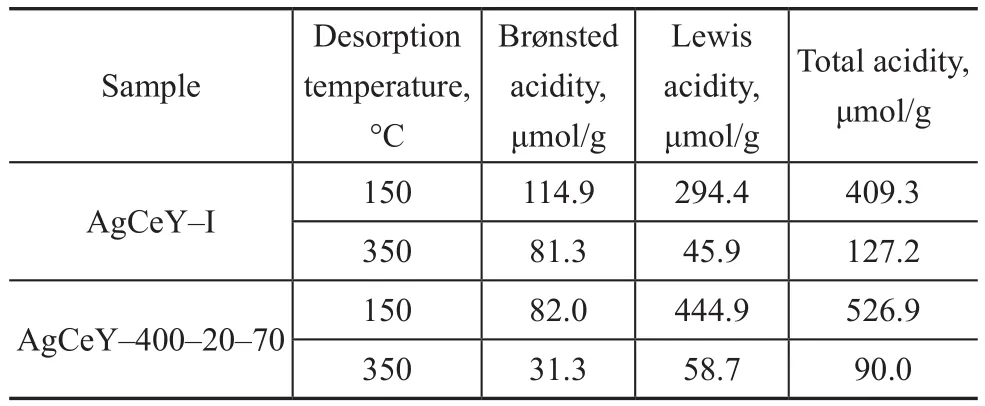
Table 3 Distribution of Brønsted and Lewis acidity in AgCeY–I and AgCeY–400–20–70 zeolites
3.2 Effect of the zeolite preparation conditions on desulfurization performance
3.2.1 Effect of microwave irradiation power
The effect of microwave irradiation power on the desulfurization performance of the zeolite is shown in Figure 4. It is observed that the removal of TP increased with an increasing microwave irradiation power, and then decreased slightly when microwave irradiation power was higher than 400 W. At a microwave irradiation power of 400 W, which was the optimal power for preparing the microwave promoted metal ion-exchanged zeolite, the TP removal reached 68.8%.
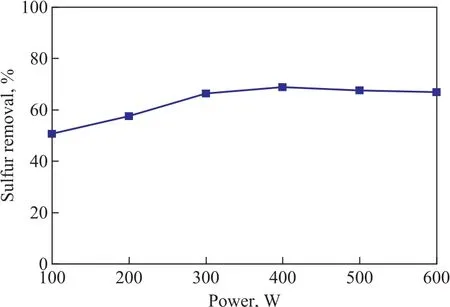
Figure 4 Effect of microwave power on desulfurization performance of the zeolite
3.2.2 Effect of microwave irradiation time
The effect of microwave irradiation time on the desulfurization performance of the zeolite is shown in Figure 5. The TP removal of the adsorbent was found to increase with the increase in irradiation time. It reached 75.2% at an irradiation time of 20 min, and then slightly decreased when the irradiation time exceeded 20 min.This could occur probably because at first increasing the irradiation time would promote the dispersion of active Ag and Ce species on the zeolite and thus could result in more active sites of Ag and Ce on the zeolite. However,when the irradiation time was longer than 20 min, the increase in desulfurization performance became slower,which was consistent with the results reported in the literature[22].
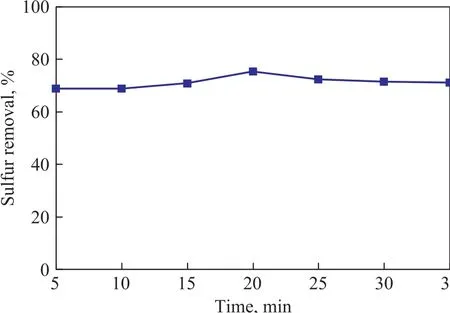
Figure 5 Effect of microwave irradiation time on desulfurization performance of the zeolite
3.2.3 Effect of microwave irradiation temperature
The effect of microwave irradiation temperature on the desulfurization performance of the zeolite is shown in Figure 6. It can be seen expressly that the TP removal performance of the adsorbent was improved with an increasing irradiation temperature, and then decreased slightly when the irradiation temperature was higher than 70 °C. It is clear that the optimum microwave irradiation temperature should be 70 °C. Under the optimal conditions, the TP removal rate is above 84.8%.Therefore, the appropriate microwave ion exchange conditions should cover an irradiation power of 400 W, an irradiation time of 20 min, and an irradiation temperature of 70 °C.
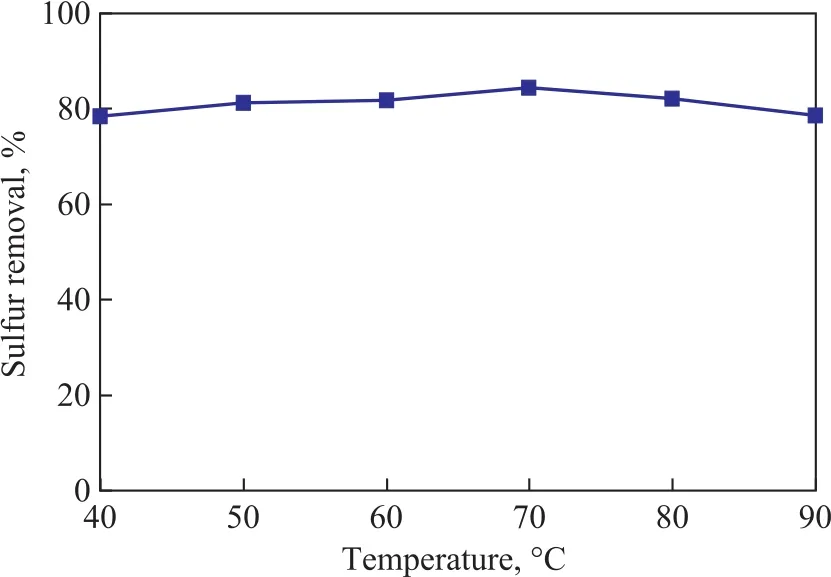
Figure 6 Effect of microwave irradiation temperature on desulfurization performance of the zeolite
3.3 Adsorptive desulfurization results and discussion
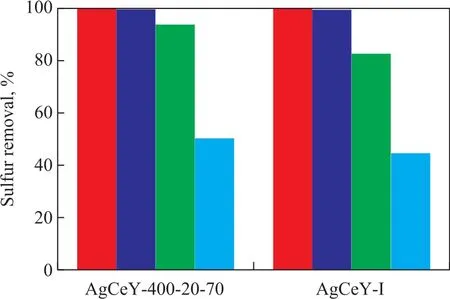
Figure 7 shows the sulfur removal by the AgCeY–I and the AgCeY–400–20–70 zeolites with different amount of model oil. The BT and TP removal rate by the two zeolites with 20 mL of model oil was above 99.8%. The BT removal by the AgCeY–400–20–70 zeolite with 60 mL of model oil was 93.8%, while the BT removal by the AgCeY–I zeolite was 82.3%. The TP removal by the AgCeY–400–20–70 zeolite with 60 mL of model oil was 50.4%, and that by the AgCeY–I zeolite was 44.9%. With the amount of model oil increasing from 20 mL to 60 mL, the TP removal rate decreased more rapidly than the BT removal rate, indicating that the selectivity for the removal of sulfur compounds decreases in the following order: BT > TP. This result is consistent with results obtained by Zhou, et al[23]. They studied the desulfurization of different sulfur compounds over AgY, and found that the adsorptive desulfurization selectivity of the sulfur compounds on the zeolite decreased in the following order: BT > TP > DBT > 4,6-DMDBT,which was consistent with the bond order obtained by using the method of natural bond orbital (NBO) analysis. Both the BT and TP removal rate on the AgCeY–400–20–70 zeolite was higher than that achieved by the AgCeY–I zeolite,showing that the AgCeY–400–20–70 zeolite prepared by microwave irradiation possessed better desulfurization performance than the AgCeY–I zeolite. In the light of the Lewis acid–base theory, thiophene and its derivatives belong to Lewis bases which are easier to be adsorbed onto the Lewis acid sites[24]. As it has been discussed in Section 3.1.3,the AgCeY–400–20–70 zeolite exhibited much higher Lewis acidity than the AgCeY–I zeolite. Therefore, it is reasonable to attribute the enhanced desulfurization performance of the AgCeY–400–20–70 zeolite to its high Lewis acidity.
3.4 Equilibrium isothermal adsorption

The equilibrium adsorption isotherm is an important basis for the design of adsorption devices. The well-known Langmuir adsorption isotherms were used to analyze the adsorption properties of the AgCeY–400–20–70 zeolite.It may be represented as the following linearized form:where ceis the concentration of sulfide in solution at equilibrium (mmol/L), qeis the equilibrium sorption uptake (mmol/g), qmis the maximum adsorption capacity(mmol/g), and KLis the Langmuir adsorption equilibriumconstant (L/mg) which represents the affinity between the adsorbents and adsorbates. Here kdis the Langmuir desorption rate constant (mmol-1·min-1).
Figure 8 shows the relationship of qeagainst cefor adsorption of TP and BT on the AgCeY–400–20–70 zeolite. As Figure 8 (a) shows primitively, qeincreases sharply with an increase of ce, then slightly levels off when ce> 2 mmol/L and tends to reach a balance. It can be estimated from Figure 8 (a) that the qmat 30 °C,40 °C and 50 °C is 0.442 mmol/g, 0.488 mmol/g and 0.517 mmol/g, respectively.
The results in Figure 8(b) indicate that at fi rst qeincreases sharply with an increase of ce, then changes slightly, and when ce> 6 mmol/L the curve tends to reach a balance.It can be estimated from Figure 8 (b) that the value of qmat 30°C, 40°C and 50 °C is 0.673 mmol/g, 0.713 mmol/g and 0.746 mmol/g, respectively.
The plots of ce/qeagainst ceat different temperatures exhibit a good linear relationship (Figure 9). And the regression coefficients at different temperatures are larger than 0.997(Table 4), indicating that the Langmuir isothermal equation can well describe the adsorption process of TP and BT on the AgCeY–400–20–70 zeolite. This confirms that the adsorption of TP and BT on the AgCeY–400–20–70 zeolite is a monolayer adsorption. The values of KLand qmcan be acquired from the slopes and intercepts of the straight lines (Table 4). It can be seen from Table 4 that the slope of the line reduces slightly with the increase in temperature.This means that qmincreases slightly with an increasing temperature. The Langmuir constant KLdecreases with an increasing temperature, indicating that the adsorption process is exothermic.
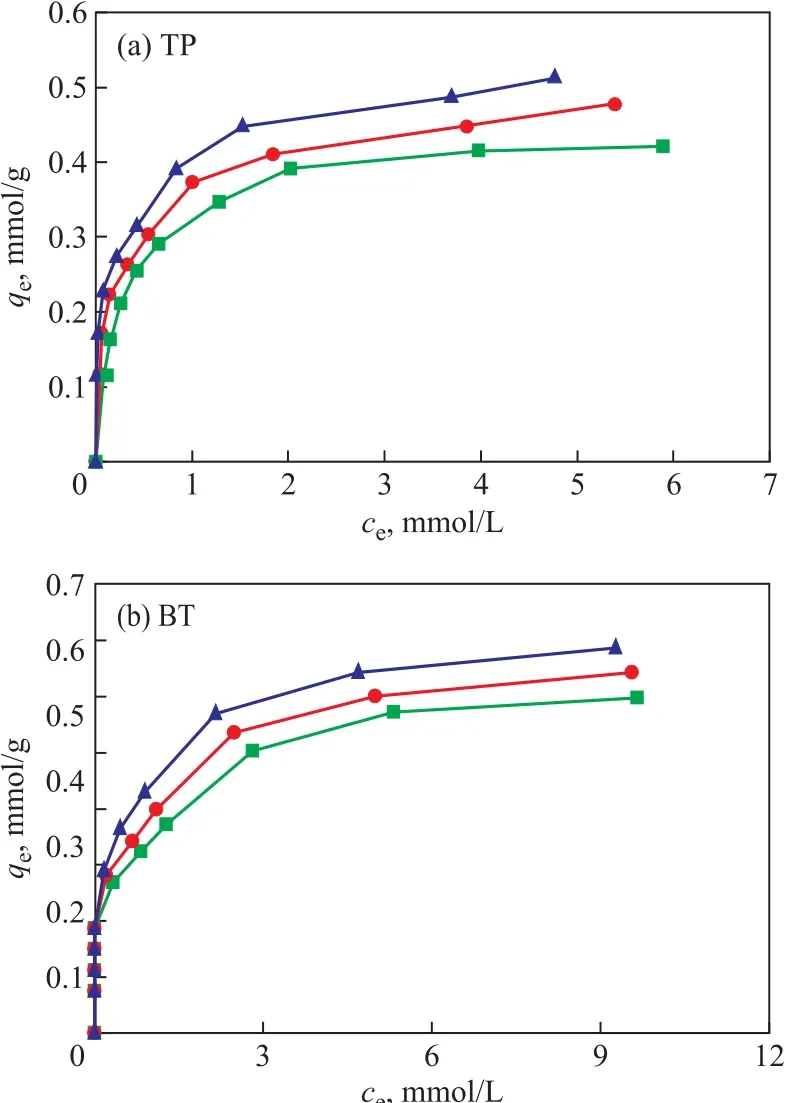
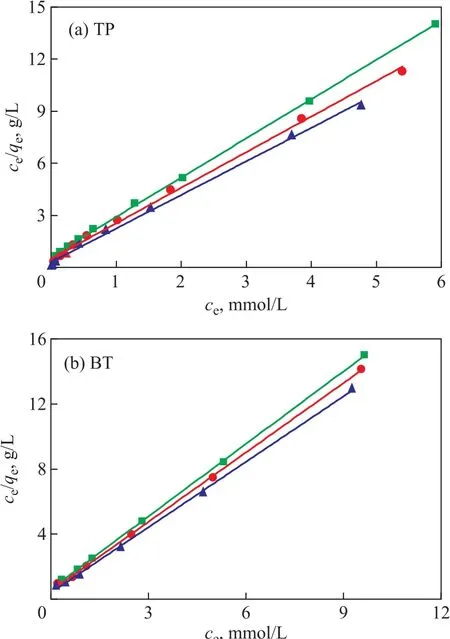
Figure 9 Langmuir model linear equations obtained by using the linear fitting method for the adsorption of TP and BT over AgCeY–400–20–70 at different temperatures▲—50 °C; ●—40 °C; ■—30 °C
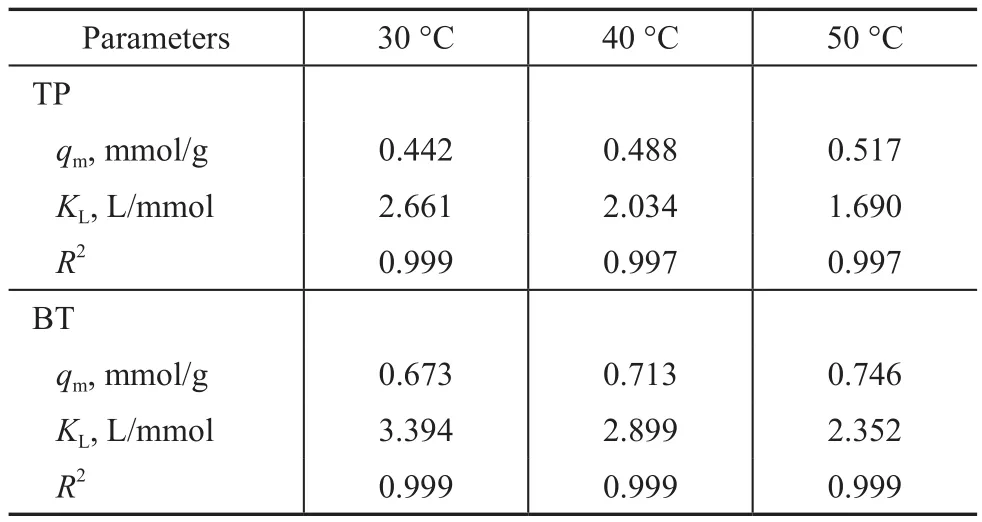
Table 4 Langmuir adsorption isotherm parameters
3.5 Adsorption kinetics
3.5.1 Pseudo- fi rst-order model, pseudo-second-order model and Langmuir models
In order to better understand the adsorption process, the commonly used kinetic models including the pseudofirst-order model, the pseudo-second-order model and the Langmuir model were examined to describe the sulfur adsorption kinetics of the AgCeY–400–20–70 zeolite[25].The integration form of Lagergren’s pseudo-first-order and pseudo-second-order kinetic models are given by Eqs. (2) and (3):
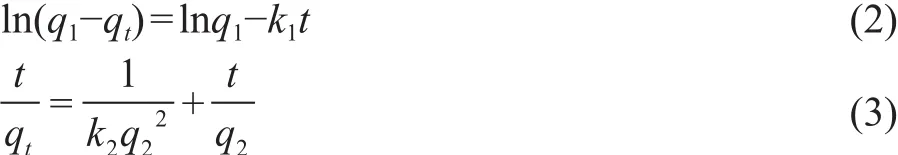
whereqt(mmol/g) is the amount of adsorbed sulfur on the adsorbent at timet(min),q1(mmol/g) is the equilibrium adsorptive capacity of the pseudo-first-order adsorption reaction andk1(min-1) is the pseudo- first-order rate constant.Theq2(mmol/g) is the equilibrium adsorptive capacity of the pseudo-second order adsorption reaction andk2(g/mmol·min) is the pseudo-second order rate constant.
The integral form of Langmuir model can be expressed as:

where theqeandqLare the two solutions of the second-order polynomial expressionThec0is the initial concentration of sulfur (mg/L).
In the following section, the above-mentioned three adsorption kinetic models were estimated to fit the kinetics of the adsorption procedure on the AgCeY–400–20–70 zeolite. As shown in Figure 10, all these three adsorption kinetic models are fit to describe the kinetics of TP and BT adsorption over the AgCeY–400–20–70 zeolite. It can be seen from Table 5 that for both TP and BT the correlation coefficientR2of the three models is greater than 0.986,showing that these three models are suitable for describing the adsorption kinetics of TP and BT. The values ofqecalculated from the Langmuir model are equal to theqevalues (0.675 mmol/g for TP and 1.643 mmol/g for TB)of the pseudo-second-order model. In conclusion, both the Langmuir model and the pseudo-second-order model are fit for describing the adsorption kinetics of TP and BT.

Figure 10 Nonlinear fitting according to the pseudo- firstorder, the pseudo-second-order, and the Langmuir models for AgCeY–400–20–70 adsorption kinetics■—Experemental data;— —Pseudo- first order;┅ —Pseudo-second order; ┉ —Langmuir model
3.5.2 Effect of temperature on adsorption kinetics
Obviously, there are two major effects of the temperature on the adsorption process[27]. The nonlinear fitting of the adsorption kinetics of TP and BT over the AgCeY–400–20–70 zeolite at different temperatures are shown in Figure 11. The obtained model parameters are listed in Table 6. Figure 11(a) shows thatqtincreases with an increasing temperature for TP, andqereaches 0.676 mmol/g at 50 °C. Moreover, theqtincreases with an increasing time rapidly at first, and then tends to level off. The similar trend of TP can be observed for BT(Figure 11(b)). It can be seen from Table 6 that under the same conditions, theqeof BT is greater than that of TP,indicating that the AgCeY–400–20–70 zeolite has a better selectivity to BT than TP. Meanwhile theqeandk1for TP and BT both increase with an increasing temperature,indicating that the adsorption on the AgCeY–400–20–70 zeolite is more effective at higher temperatures.
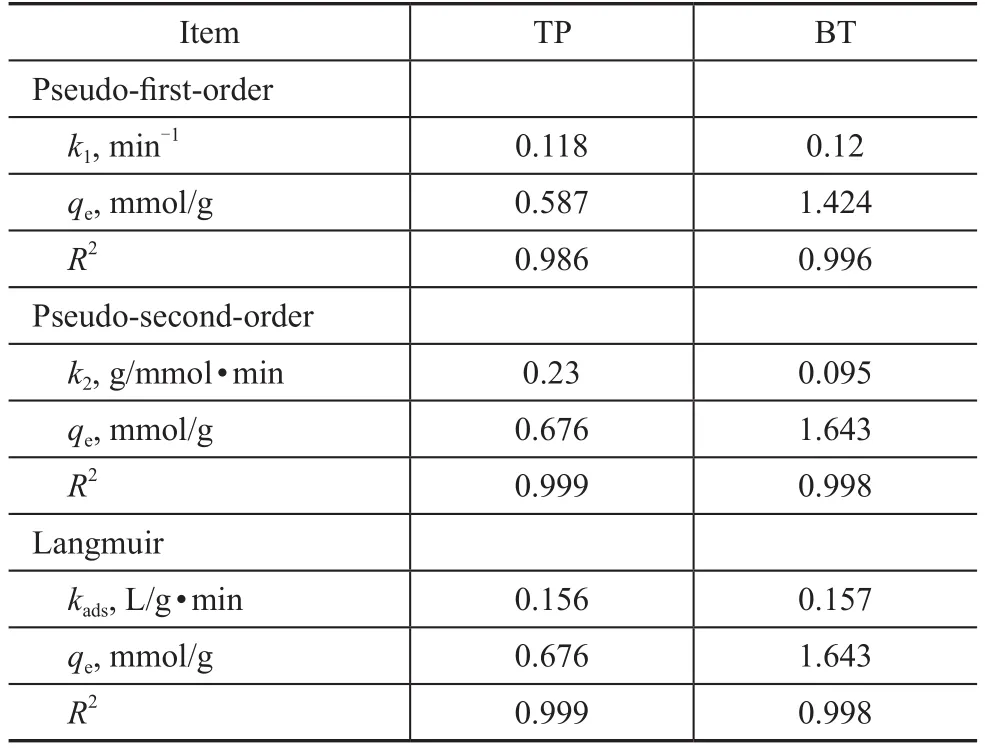
Table 5 The parameters of the pseudo- first-order, the pseudo-second-order, and the Langmuir model
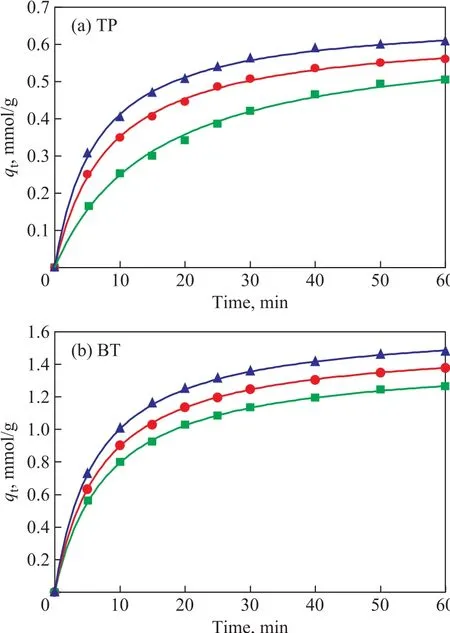
Figure 11 Nonlinear fitting of the adsorption kinetics of (a)TP and (b) BT over AgCeY–400–20–70 zeolite at 30 °C, 40°C, and 50 °C, respectively■—30 °C; ●—40 °C; ▲—50 °C
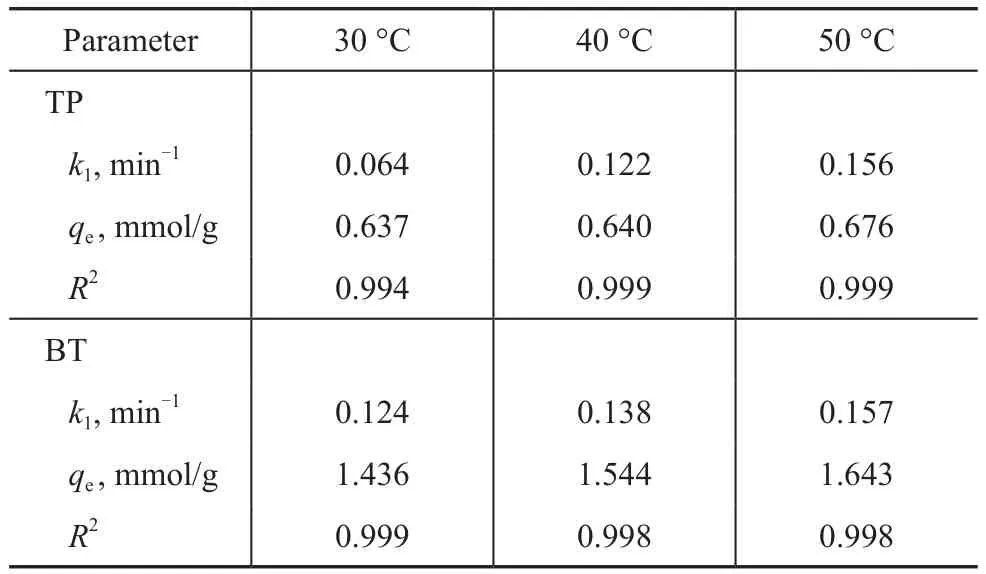
Table 6 Langmuir isotherm equation parameters obtained at different temperatures by nonlinear fitting
The influence of temperature on the adsorption rate is calculated using the Arrhenius equation.

wherek0is the temperature-independent factor (g/mmol·min),Eais the activation energy of adsorption (kJ/mol), andRgandTkare the universal gas constant (8.314 J/mol·K) and the temperature (K), respectively. Figure 12 shows the plot of lnk1versus 1/Tkand the activation energy is calculated to be 15.773 kJ/mol for TP and 5.322 kJ/mol for BT. The low activation energy suggests that the adsorption of TP and BT on the AgCeY–400–20–70 zeolite is a mass transfer controlled process[28].
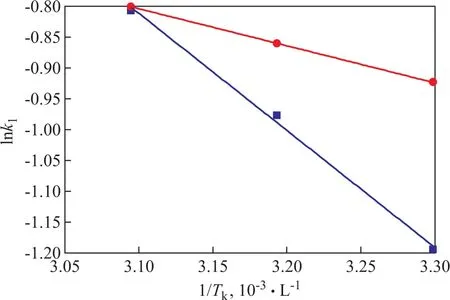
Figure 12 Plot of lnk1 versus 1/Tk for TP and BT■—TP; ●—BT
3.6 Thermodynamics
The Gibbs free energy change (ΔG) can be indicated by the Langmuir constantKLin the form:

According to the value ofKL(Table 4), the value of ΔGfor TP and BT can be calculated at 30 °C, 40 °C, and 50 °C,respectively, with the results presented in Table 7. The negative values of ΔGindicate that the adsorption of TP and BT on the AgCeY–400–20–70 zeolite is a spontaneous process.

Table 7 The ΔG values for adsorption of TP and BT on the AgCeY–400–20–70 zeolite
Moreover, ΔG= ΔH−TkΔS; hence, Eq. (5) can be rearranged in the form:
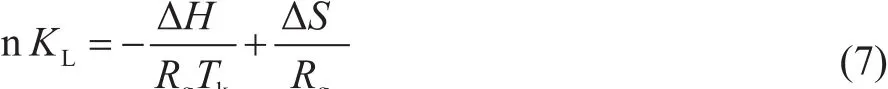
where ΔHis the enthalpy of adsorption (kJ/mol) and ΔSis the entropy change of adsorption (J/mol·K).
Figure 13 shows the relationship between lnKLand 1/Tk, which is based on the data shown in Table 4. The numerical values of ΔHand ΔScan be figured out from the slope and intercept of the line in Figure 13. The results showed that the values of ΔHfor TP and for BT are -8.038 kJ/mol and -6.478 J/mol·K, respectively. The negative values of ΔHand ΔSindicate that the adsorption process of TP and BT on the AgCeY–400–20–70 zeolite is exothermic and reduces in the degree of freedom of the adsorbed species.
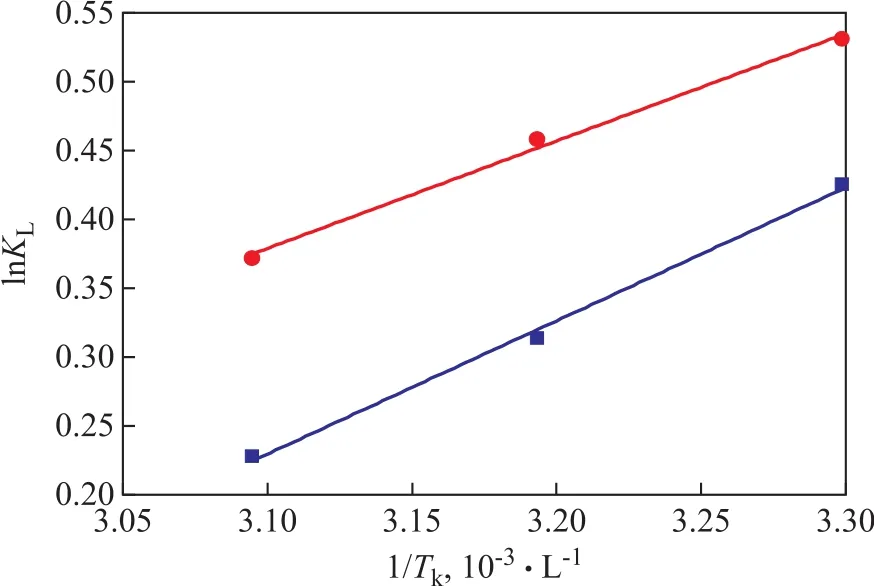
Figure 13 Plot of lnKL versus 1/Tk for TP and BT■—TP; ●—BT
4 Conclusions
In this work, the AgCeY zeolite was prepared by the microwave-assisted liquid ion exchange method. The XRD analyses indicated that the skeleton structure of parent NaY zeolite was retained perfectly after Ag+and Ce3+loading and calcination. After ion exchange,the surface area and pore radius of NaY zeolite clearly decreased, which was consistent with the results of XRD analysis. The silver existed in the form of +1 valance on the surface of the AgCeY–400–20–70 zeolite, while the Ce3+ions were oxidized to Ce4+ions after calcination.The number of Lewis acid sites was more than that of Brønsted acid sites and the weak acidic sites were predominant. The AgCeY–400–20–70 zeolite, which was subjected to ion exchange under conditions covering a microwave irradiation time of 20 min, a microwave power of 400 W and a microwave temperature of 70 °C,exhibited the best adsorptive desulfurization performance.The ion exchange time of AgCeY–400–20–70 zeolite was reduced from 24 h to 20 min as compared to the conventional ion exchange method. In addition, the AgCeY–400–20–70 zeolite exhibited much higher Lewis acidity but lower Brønsted acidity as compared to the AgCeY–I zeolite, which was prepared via the conventional ion exchange method. Both the BT and TP removal rates achieved by the AgCeY–400–20–70 zeolite were higher than those obtained on the AgCeY–I,showing that the AgCeY–400–20–70 zeolite prepared by microwave irradiation possessed better desulfurization performance than the AgCeY–I zeolite. The enhanced desulfurization performance of the AgCeY–400–20–70 zeolite can be attributed to its high Lewis acidity.
The equilibrium isotherm indicated that the Langmuir model could describe the kinetics of TP and BT adsorption on the AgCeY–400–20–70 zeolite. The qmfor TP and BT both increased with an increasing temperature, whereas KLfor TP and BT both reduced with an increasing temperature, showing that the adsorptive desulfurization process was exothermic.The adsorption kinetics for TP and BT could be well described by the pseudo-second-order model and the Langmuir model. The qeand k1for TP and BT both increased with an increasing temperature, indicating that the adsorption on the AgCeY–400–20–70 zeolite was more effective at higher temperatures. The activation energy was 15.773 kJ/mol for TP and 5.322 kJ/mol for BT. The low activation energy suggested that the adsorption of TP and BT on the AgCeY–400–20–70 zeolite was mass transfer controlled. And the results of analysis of the thermodynamics exhibited that the adsorption of TP and BT on the AgCeY–400–20–70 zeolite was a spontaneous and exothermic process.
[1]Han X, Li H, Huang H, et al. Effect of olefin and aromatics on thiophene adsorption desulfurization over modified NiY zeolites by metal Pd[J]. RSC Advances, 2016, 6(78):75006-75013
[2]Chen H, Wang Y, Yang F H, et al. Desulfurization of high-sulfur jet fuel by mesoporous π-complexation adsorbents[J]. Chemical Engineering Science, 2009,64(24): 5240-5246
[3]Shu C, Sun T, Zhang H, et al. A novel process for gasoline desulfurization based on extraction with ionic liquids and reduction by sodium borohydride[J]. Fuel, 2014, 121(2):72-78
[4]Lin L, Zhang Y, Zhang H, et al. Adsorption and solvent desorption behavior of ion-exchanged modified Y zeolites for sulfur removal and for fuel cell applications[J]. Journal of Colloid & Interface Science, 2011, 360(2): 753-759
[5]Oliveira M L M, Miranda A A L, Barbosa C M B M, et al. Adsorption of thiophene and toluene on NaY zeolites exchanged with Ag(I), Ni(II) and Zn(II)[J]. Fuel, 2009,88(10): 1885-1892
[6]Tajbakhsh M, Heidary M, Hosseinzadeh R. Nano Fe/NaY zeolite: an efficient and reusable solid-supported catalyst for synthesis of 1-oxo-hexahydroxanthene and tetraketone derivatives[J]. Research on Chemical Intermediates, 2016,42(2): 1-15
[7]Qin J X, Wang Z M, Liu X Q, et al. Low-temperature fabrication of Cu(I) sites in zeolites by using a vaporinduced reduction strategy[J]. Journal of Materials Chemistry A, 2015, 3(23): 12247-12251
[8]Bigdeli S, Fatemi S. Fast carbon nanofiber growth on the surface of activated carbon by microwave irradiation: A modified nano-adsorbent for deep desulfurization of liquid fuels[J]. Chemical Engineering Journal, 2015, 269: 306-315
[9]Bukhari S S, Behin J, Kazemian H, et al. Synthesis of zeolite Na-A using single mode microwave irradiation at atmospheric pressure: The effect of microwave power[J].Canadian Journal of Chemical Engineering, 2015, 93(6):1081-1090
[10]Hasan Z, Jun J W, Kim C U, et al. Desilication of ZSM-5 zeolites for mesoporosity development using microwave irradiation[J]. Materials Research Bulletin, 2015, 61: 469-471
[11]Song H, Xia W, Sun X. Preparation of AgY zeolites using microwave irradiation and study on their adsorptive desulphurisation performance[J]. Canadian Journal of Chemical Engineering, 2013, 91(5): 915-923
[12]Song H, Cui X H, Song H L, et al. Characteristic and Adsorption Desulfurization Performance of Ag–Ce Bimetal Ion-Exchanged Y Zeolite[J]. Industrial & Engineering Chemistry Research, 2015, 53(37): 14552-14557
[13]Song H, Gao H, Song H, et al. Effect of Si/Al ratio on adsorptive removal of thiophene and benzothiophene over ion-exchanged AgCeY zeolites[J]. Industrial &Engineering Chemistry Research, 2016, 55(13): 3813-3822[14]Wang H, Song L, Jiang H, et al. Effects of olefin on adsorptive desulfurization of gasoline over Ce(IV)Y zeolites[J]. Fuel Processing Technology, 2009, 90(6): 835-838
[15]Romeo M, Bak K, El Fallah J, et al. XPS study of the reduction of cerium dioxide[J]. Surface & Interface Analysis, 2004, 20(6): 508-512
[16]Wang J, Xu F, Xie W J, et al. The enhanced adsorption of dibenzothiophene onto cerium/nickel-exchanged zeolite Y[J]. Journal of Hazardous Materials, 2008, 163(2): 538-543
[17]Tarafdar A, Panda A B, Pramanik P. Synthesis of ZrO2-SiO2mesocomposite with high ZrO2content via a novel sol–gel method[J]. Microporous & Mesoporous Materials,2005, 84(1): 223-228
[18]Shyu J Z, Weber W H, Gandhi H S. Surface characterization of alumina-supported ceria[J]. The Journal of Physical Chemistry, 1988, 92(17): 4964-4979
[19]Emeis C A. ChemInform Abstract: Determination of Integrated Molar Extinction Coefficients for IR Absorption Bands of Pyridine Adsorbed on Solid Acid Catalysts[J].Cheminform, 1993, 141(2): 347-354
[20]Yi D, Huang H, Meng X, et al. Adsorption–desorption behavior and mechanism of dimethyl disulfide in liquid hydrocarbon streams on modified Y zeolites[J]. Applied Catalysis B Environmental, 2014, 148(6): 377-386
[21]Gupta P, Paul S. ChemInform Abstract:Solid Acids: Green Alternatives for Acid Catalysis[J]. Cheminform, 2014,45(46): 153-170
[22]Li X, Zhang X, Lei L. Preparation of CuNaY zeolites with microwave irradiation and their application for removing thiophene from model fuel[J]. Separation & Purification Technology, 2009, 64(3): 326-331
[23]Zhou D H, Wang Y Q, He N, et al. The π-complexation mechanisms of Cu(I), Ag(I)/zeolites for desulfurization[J].Acta Physico-Chimica Sinica, 2006, 22(5): 542-547 (in Chinese)
[24]Li Q, Chen X. Studies on acidity and catalytic performance of USY with different silica-alumina ratios.[J]. Petroleum Processing & Petrochemicals, 1991(2): 27-32 (in Chinese)[25]Montazerolghaem M, Rahimi A, Seyedeyn-Azad F.Equilibrium and kinetic modeling of adsorptive sulfur removal from gasoline by synthesized Ce-Y zeolite[J].Applied Surface Science, 2010, 257(2): 603-609
[26]Jiang J, Ng F T T. Production of low sulfur diesel fuel via adsorption: an equilibrium and kinetic study on the adsorption of dibenzothiophene onto NaY zeolite[J].Adsorption, 2010, 16(6): 549-558
[27]Nouri L, Ghodbane I, Hamdaoui O, et al. Batch sorption dynamics and equilibrium for the removal of cadmium ions from aqueous phase using wheat bran[J]. Journal of Hazardous Materials, 2007, 149(1): 115-125
[28]Nollet H, Roels M, Lutgen P, et al. Removal of PCBs from wastewater using fly ash[J]. Chemosphere, 2003, 53(6):655-665
杂志排行
中国炼油与石油化工的其它文章
- Influence of Initial Water Content on Synthesis of Silicalite-1 Zeolite
- Research Progress in Catalytic Cracking Reaction of Tetralin and Decalin
- Preparation of Novel Dechlorination Adsorbent and Study on Its Adsorption Mechanism
- The Function of β Zeolite for Enhancing the Propylene Yield in FCC Process
- Synthesis and Tribological Properties of Graphene-Copper Nanoparticle Composites as Lithium Grease Additive
- Study on Catalytic Alkylation of Benzene with Methanol over ZSM-22 and ZSM-35