Determination of urban runoff coefficient using time series inverse modeling *
2017-11-02HailongYin尹海龙ZhichaoZhao赵志超RuoqianWangZuxinXu徐祖信HuaizhengLi李怀正
Hai-long Yin (尹海龙), Zhi-chao Zhao (赵志超), Ruoqian Wang, Zu-xin Xu (徐祖信),Huai-zheng Li (李怀正)
1. State Key Laboratory of Pollution Control and Resource Reuse, Tongji University, Shanghai 200092, China,E-mail: yinhailong@tongji.edu.cn
2. School of Science and Engineering, University of Dundee, Dundee, UK
Determination of urban runoff coefficient using time series inverse modeling*
Hai-long Yin (尹海龙)1, Zhi-chao Zhao (赵志超)1, Ruoqian Wang2, Zu-xin Xu (徐祖信)1,Huai-zheng Li (李怀正)1
1. State Key Laboratory of Pollution Control and Resource Reuse, Tongji University, Shanghai 200092, China,E-mail: yinhailong@tongji.edu.cn
2. School of Science and Engineering, University of Dundee, Dundee, UK
Runoff coefficient is an important parameter for the decision support of urban stormwater management. However, factors like comprehensive land-use type, variable spatial elevation, dynamic rainfall and groundwater elevation, make the direct estimation of runoff coefficient difficult. This paper presented a novel method to estimate the urban runoff coefficient using the inverse method,where observed time-series catchment outfall flow volume was employed as input for the water balance model and runoff coefficients of different catchments were treated as unknown parameters. A developed constrained minimization objective function was combined to solve the model and minimized error between observed and modeled outfall flow is satisfactory for the presenting of a set of runoff coefficients. Estimated runoff coefficients for the urban catchments in Shanghai downtown area demonstrated that practice of low impact design could play an important role in reducing the urban runoff.
Runoff coefficient, urban stormwater management, inverse modeling, low impact design
Event runoff coefficient is defined as the portion of rainfall that becomes direct runoff during an event[1]. This coefficient is difficult to determine due to the rapid changes of urban landscape in developing countries. In addition, due to the complexity of land-use zoning and surface-groundwater exchange, traditional estimation of runoff coefficients is time-consuming and inaccurate. Here, we propose a novel solution to determine the catchment runoff coefficient using an inverse model[2-5]. Such inverse method is shown to be convenient to use without the uncertainty associated with the factors mentioned above. This study demonstrates that runoff coefficient of urban catchments can be estimated using a time series inverse model. In such a model, the recorded catchment outflow rate and observed precipitation were treated as known variables in the system of water balance equation.
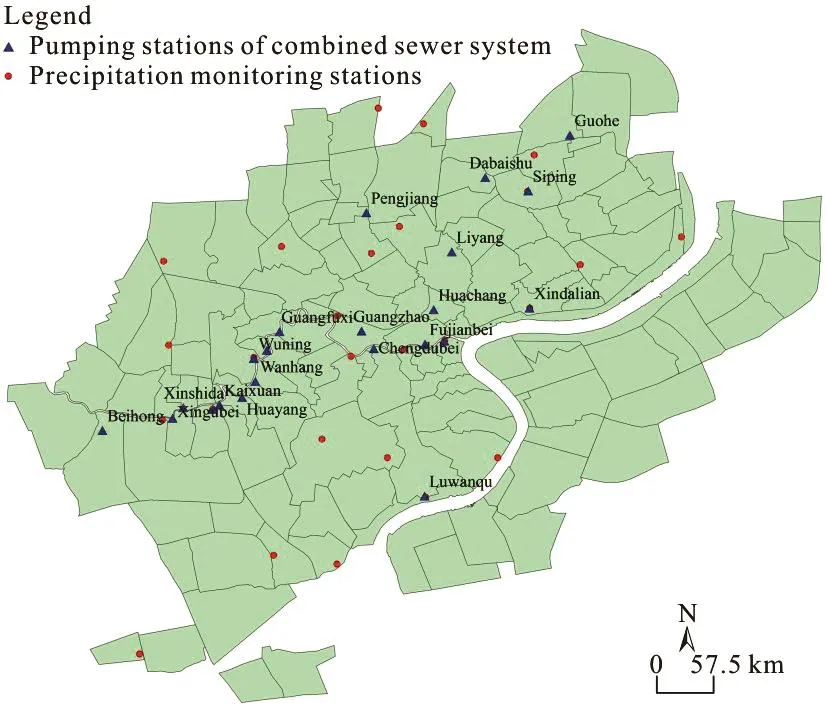
Fig.1 (Color online) The distribution of the precipitation monito- ring stations and urbanized catchment outfalls in Shanghai
The present study focuses on 22 downtown catchments in Shanghai, China, which has an area of 41.95 km2and 22 pumping stations of combinedsewer system. Note that Shanghai is geologically flat,so urban drainage is being driven by forced pumping,instead of gravity flow as in many other cities. The locations of precipitation monitoring sites and pumping stations of the combined sewer system are shown in Fig.1.
The pumping stations and the precipitation sites are not collocated, so we interpolated the precipitation data to the pumping stations to create a correlated precipitation-pumping rate dataset. Specifically, the precipitation data of the monitoring sites on 54 raining days in 2013 and 2014 as well as the pumping flow rate data were available from the website of Shanghai Urban Drainage Company. The precipitation data were interpolated to the pumping station locations using the inverse distance weighted (IDW) interpolation method developed in ArcGIS.
To employ the time series inverse model for estimating the runoff coefficients of urban catchments,the water balance within each catchment should be determined, as presented below:

where Q(p)i,jis the j- th pumping flow rate of the i- th pumping stations, Qsiis the daily wastewater discharge flow rate per square kilometer of the i -th urban catchment, which was estimated based on the g soe uorgcreasp hsi cu rvin eyfo rimn ation system Tof h ewa avte errapg o e llu dtaiiol ny wastewater discharge flow rate per square kilometer of these catchments is 16 751 m3/(km2·d). N is recorded time of wet-weather period (=54 d), Qgiis the daily groundwater seepage rate in each catchment(10.5% of Qsi[7]), Hi,jis the j - th precipitation at the i- th pumping stations of combined sewer system, Siis the catchment area corresponding to the i- th combined pumping station, xiis the runoff coefficient of the i- th catchment.
To determine the unknown xi, a minimization problem was solved with an objective function of
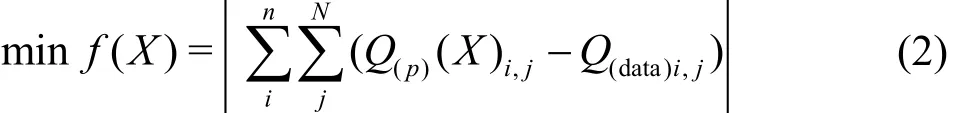
where n is the number of catchments (i.e., number of combined sewer systems), Q(p)( X)i,jis the predicted pumping flow rate data at the i- th catchment during the j - th precipitation event, Q(data)i,jis the recorded pumping flow rate data at thei -th catchment during the j - th precipitation event. The minimization problem of Eq.(2) is solved numerically by Fmincon, a nonlinear programming solver. Given the initialvector of therunoff coefficientsinterior-point algorithm[8,9]was applied to obtain the solution, which is illustrated in the technical route of Fig.2.
In this technical route, lb and ub represent the lower and upper limits of xirespectively that were determined using China's urban drainage design handbook[10]. φ ( X , r(k)) is the logarithmic penalty function, which combined the original objective function and the original constraints including inequality constraint and equality constraint, so it was used to punish the iteration step that attempts to exceed the feasible range.andare the penalty factors, which are descending sequences.ε (=1.0 × 1 0-10) is the tolerance of the lower bound 1 using the L2-norm of (Xi- Xi+1). If the solver attempts to take a step that results smaller error than ε, the iteration ends. ε(=1.0× 1 0-6) is the tole-12rance of the first-order optimization. If the optimi-zation error is less than2ε, the iteration ends.
The process to find the runoff coefficient with the number of iteration steps is shown in Fig.3, whereIis the number of iterations,1Fis the base 10 logarithm of ()fX,2Fis the base 10 logarithm of 1ε.()fXgradually decreased to the order of 10-4(i.e., 5.48×10⁻⁴in Fig.3(a)) when1εapproached 10-10(see Fig.3(b)). The trend shows that our algorithm has a quick convergence and the numerical configuration is appropriate.
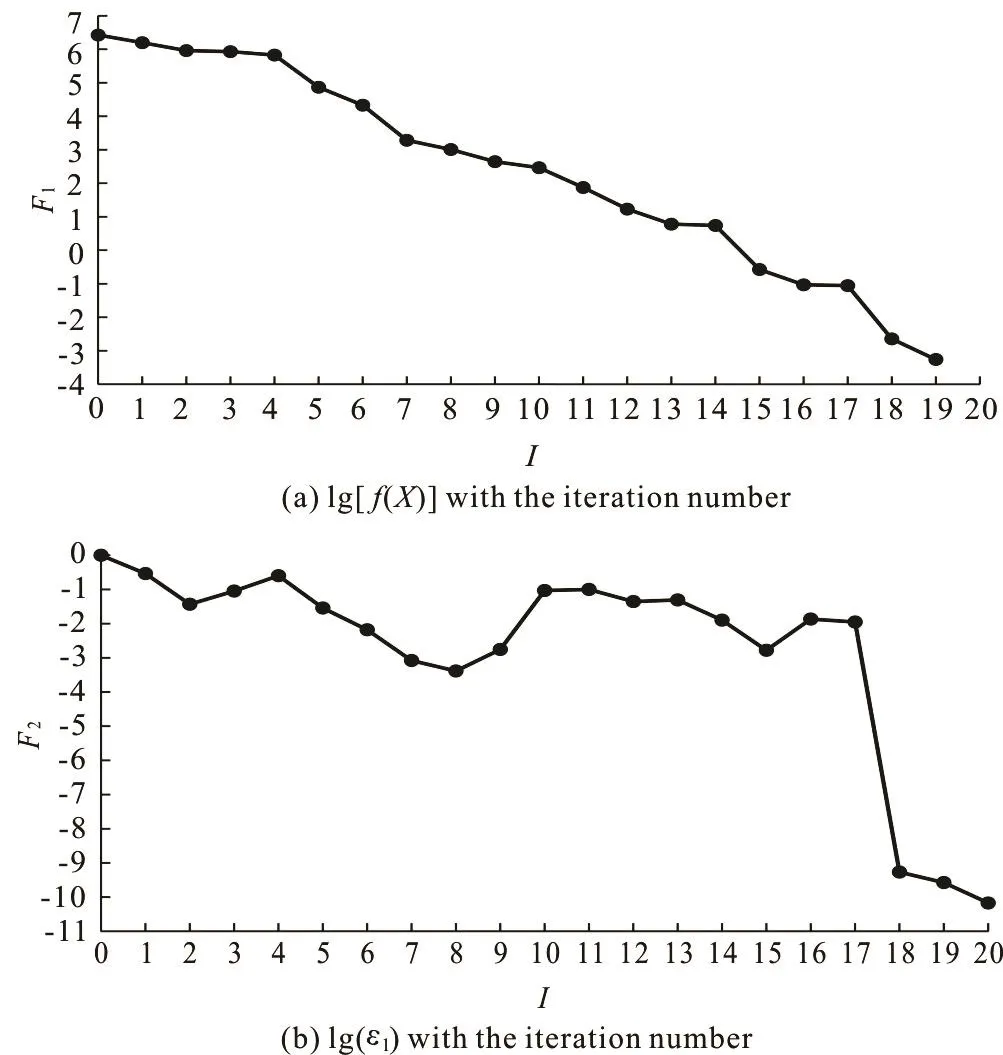
Fig.3 The numerical iteration process to fine the runoff coeffi- cient with ()fX and norm of step as the judgement cri- teria
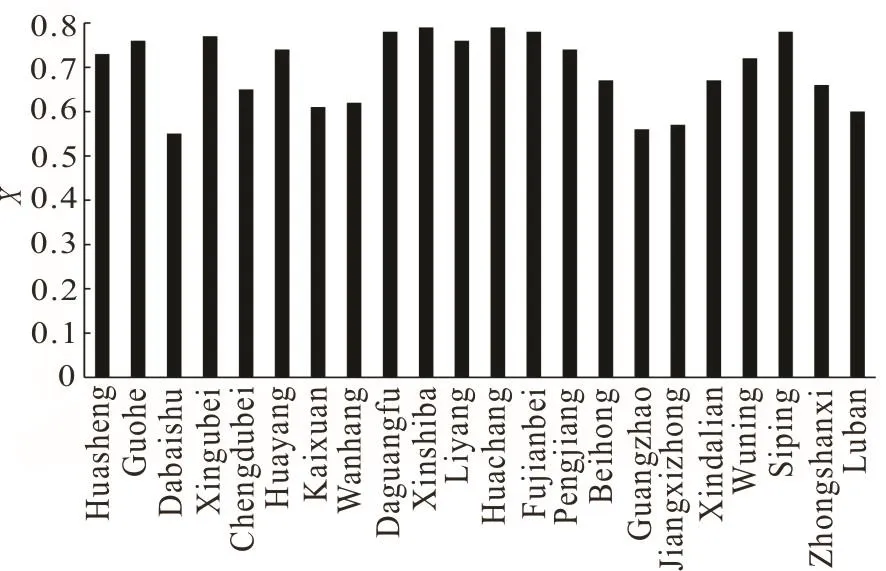
Fig.4 The estimated runoff coefficients of the urban catchments using inverse model
For each urban catchment, the estimated runoff coefficient using the time-series inverse model is shown in Fig.4. The maximum, minimum and average runoff coefficients are 0.79, 0.55 and 0.70, respectively. The reported literature showed the average runoff coefficient in Shanghai urban catchments in the year of 2003 was approximately 0.73[11], appearing to match well with the estimated average data in our study, with a relative error of 4.3%. However, the urban runoff coefficients between the minimum and maximum values have a difference of 0.24 based on our study.
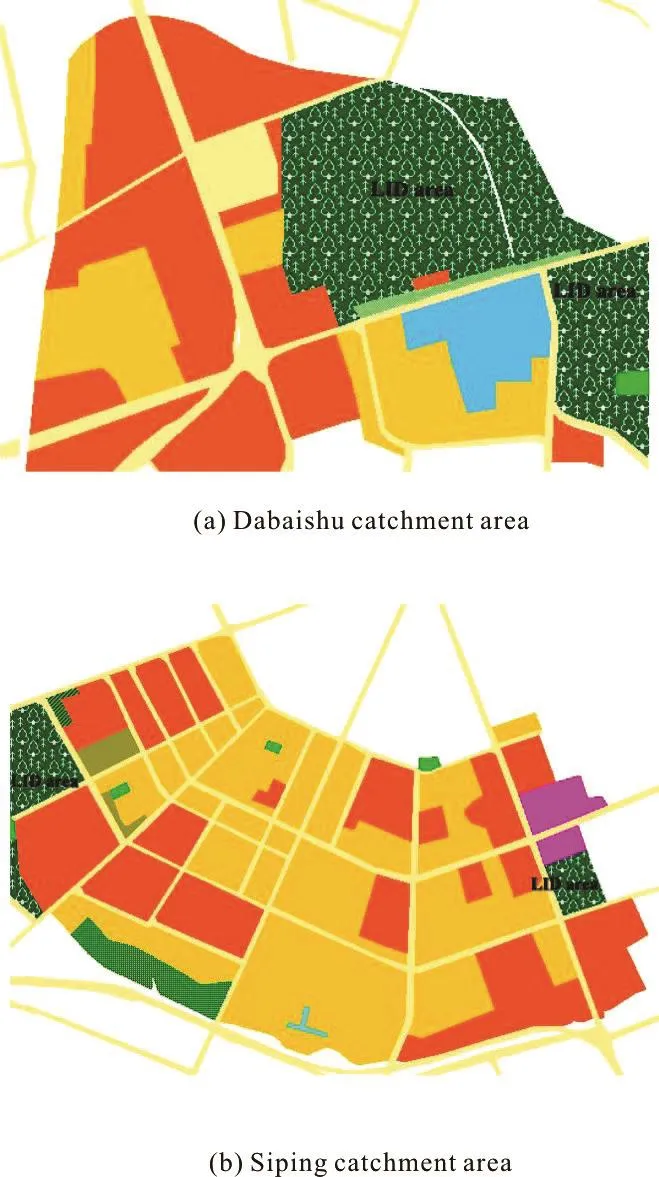
Fig.5 (Color online) Locations of LID area in two urban catch- ments
Focusing on two specific catchments (i.e.,Dabaishu and neighboring Siping catchment), the two catchments are both highly urbanized with a dense population, but their runoff coefficients are obviously different, estimated to be 0.55 and 0.78 respectively for Dabaishu and Siping catchment. Such sharp difference in runoff coefficient for the urbanized areas is related to the use of low impact design (LID)facilities. As shown in Fig.5, previously industrial land use has been converted into the residential or public construction area for the two catchments in recent years, where LID facilities are emphasized,such as the demonstration of low elevation greenbelts,rain gardens and permeable pavements. In Dabaishu catchment, the LID area put into practice is approximately 28.6% of the total catchment area, whereas the estimated ratio of LID area to total catchment is only 5.98% in Siping catchment. Using the inverse modeling, our study justifies the importance of LID in reducing rainfall induced runoff flow from the quantitative perspective, that is, an urban runoff coefficient reduction of 0.23 in this case, with the LID facilities area increased by 22.6%.
The future work will further our expedition to discriminate the runoff coefficients associated with different land use types using inverse modeling, which aims at providing technical parameters for the city planners.
[1] Merz R., Blöschl G., Parajka J. Spatio-temporal variability of event runoff coefficients [J]. Journal of Hydrology,2006, 331(3): 591-604.
[2] Sharma L. K., Ghosh A. K., Nair R. N. et al. Inverse modeling for aquatic source and transport parameters identification and its application to Fukushima nuclear accident [J]. Environmental Modeling and Assessment,2014, 19(3): 193-206.
[3] Zhan Y., Sun J., Luo Y. et al. Estimating emissions and environmental fate of di-(2-ethylhexyl) phthalate in Yangtze River Delta, China: Application of inverse modeling [J]. Environmental Science and Technology,2016, 50(5): 2450-2458.
[4] Sulzer S., Rutschmann P., Kinzelbach W. Flood discharge prediction using two-dimensional inverse modeling [J].Journal of Hydraulic Engineering, ASCE, 2002, 128(1):46-54.
[5] Yang H. Q., Li M. G., Liu S. X. et al. An iterative re-weighted least-squares algorithm for the design of active absorbing wavemaker controller [J].Journal of Hydrodynamics, 2016, 28(2): 206-218.
[6] Xu Z. X. Planning Theory and practice of river pollution control [M]. Beijing, China: China Environmental Press,2003, 815-820(in Chinese).
[7] Xu Z. X., Yin H. L., LI H. Z. Quantification of non-combinedwater flow entries into combined drains using a water balance approach [J]. Science of the Total Environment, 2014, 487: 381-388.
[8] BYRD R. H., Hribar M. E., Nocedal J. An interior point algorithm for large-scale nonlinear programming [J].SIAM Journal on Optimization, 1999, 9(4): 877-900.
[9] Wächter A. An interior point algorithm for large-scale nonlinear optimization with applications in process engineering [J]. SIAM Journal on ScientificComputing,2002, 32(6): 3447-3475.
[10] Bejing Municipal Engineering Design Institute. Desin handbook of water supply and drainage system (Volumn 5)[M]. Beijing, China: China Building Industry Press, 2004,11-13(in Chinese).
[11] Cheng J. Effects of land use and land cover change on environmental hydrology in the center urban area of Shanghai [D]. Doctoral Thesis, Shanghai, China: East China Normal University, 2007(in Chinese).
May 12, 2017, Revised July 9, 2017)
* Project supported by the China's Major Science and Technology Program on Water Bodies Pollution Control and Treatment (Grant No. 2013ZX07304-002).
Biography: Hai-long Yin (1976-), Male, Ph. D.,
Associate Professor
Zu-xin Xu,
E-mail: xzx@stcsm.gov.cn
猜你喜欢
杂志排行

水动力学研究与进展 B辑的其它文章
- On the clean numerical simulation (CNS) of chaotic dynamic systems *
- BEM for wave interaction with structures and low storage accelerated methods for large scale computation *
- Flow-pipe-soil coupling mechanisms and predictions for submarine pipeline instability *
- Simulation of flows with moving contact lines on a dual-resolution Cartesian grid using a diffuse-interface immersed-boundary method *
- On the hydrodynamics of hydraulic machinery and flow control *
- A 3-D SPH model for simulating water flooding of a damaged floating structure *