Mechanism of air-trapped vertical vortices in long-corridor-shaped surge tank of hydropower station and their elimination *
2017-11-02FangCai蔡芳YongguangCheng程永光LinshengXia夏林生YongqiJiang蒋永琪
Fang Cai (蔡芳), Yong-guang Cheng (程永光), Lin-sheng Xia (夏林生), Yong-qi Jiang (蒋永琪)
1. State Key Laboratory of Water Resources and Hydropower Engineering Science, Wuhan University,Wuhan 430072, China
2. Changjiang Survey, Planning, Design, and Research Co., Wuhan 430010, China,
E-mail: Caifang@cjwsjy.com.cn
Mechanism of air-trapped vertical vortices in long-corridor-shaped surge tank of hydropower station and their elimination*
Fang Cai (蔡芳)1,2, Yong-guang Cheng (程永光)1, Lin-sheng Xia (夏林生)1, Yong-qi Jiang (蒋永琪)1
1. State Key Laboratory of Water Resources and Hydropower Engineering Science, Wuhan University,Wuhan 430072, China
2. Changjiang Survey, Planning, Design, and Research Co., Wuhan 430010, China,
E-mail: Caifang@cjwsjy.com.cn
The air-trapped vertical vortices (ATVVs) are easy to form above the throttled orifices in the widely used long-corridor-shaped surge tanks (LCSSTs), when the tank water level decreases rapidly during hydraulic transients. These ATVVs may jeopardize the operation safety of the hydropower stations and should be avoided. This study elucidates the formation mechanism of the ATVVs and proposes some simple measures to eliminate them. The 3-D CFD model for predicting the ATVVs is validated first by physical model tests in a model tailrace LCSST, and then the formation mechanism is analyzed based on the numerical results. It is shown that the main influence factor for the ATVVs is the critical submergence, which can be reduced by minimizing the velocity circulation around the throttled orifices. Two practical ATVV elimination measures through suppressing the velocity circulation are compared and verified, and the optimized one is recommended.
CFD, long-corridor-shaped surge tank, air-trapped vertical vortices, vortex elimination
Introduction
Long-corridor-shaped surge tanks (LCSSTs) with long rectangular cross-section, are widely used in large scale multi-unit hydropower station. When the tank water level decreases rapidly during hydraulic transients, some special flow characteristics, such as the unsteady open channel flow and the vertical vortices, may occur owing to its long-corridor shape and asymmetrical layout. Under certain conditions the vortices can be developed into air-trapped vertical vortices (ATVVs), which may bring air into the pipeline and further jeopardize the operation safety of hydropower stations. In order to avoid the ATVVs, it is important to comprehensively study the formation and evolution mechanisms of the vortices in the LCSSTs and take appropriate measures to eliminate them.
The existing studies of the mechanism of vertical vortices were mainly focused on the bathtub vortices in simple geometry. Odgaard[1]used a Rankine vortex model as the basis for deriving an equation for the critical submergence of intakes with consideration of the Froude number and the circulation number as the major controlling parameters. The results are in agreement with experimental ones. Li et al.[2]used the PIV to measure the free vortex flow field at different stages and found that the tangential velocity distribution is similar to that of the Rankine vortex and the radial velocity changes little in the vortex functional scope. As for the vertical vortices in the hydraulic engineering, the researches were focused on the hydraulic intakes. Nevzat and Fikret[3,4]believed that the critical submergence of an air- entraining vortex occurring at an intake in a uniform canal flow can be solved by combining a point sink having the same discharge and center as the intake and a uniform flow.And it was found that the critical submergence is equal to the radius of the “critical spherical sink surface” (CSSS). Chen et al.[5]believed that a remarkable characteristic of the vertical vortex at the hydraulic intakes is the multi-circle spiral flow and some improved formulae were derived for three velocity components of the vertical vortex flows. Wang et al.[6,7]carried out physical model experiments to studythe intake vortex related to the Xiluodu hydropower project and derived three sets of the new formulations for the tangential velocity distributions. The comparison between the results of the formulae and the experimental ones shows that one of the proposed formulae are in an improved agreement with the experimental data. Li[8]investigated the influencing factors for the hydraulic intakes and believed that the water circulation reflects the impact of the topography near the intakes. Although the ATVVs in the intakes were studied extensively, numerical simulation results of the ATVVs in the LCSST were very few. Wu and Yang[9], Deng and Cheng[10]simulated the flow pattern in a practical long corridor-shaped surge tank and analyzed the causes of the vertical vortices in the tank. However, the formation mechanism of the ATVVs in the LCSST is not clarified and more detailed investigation is required. This relatively new topic is challenging, because it is a fast transient problem.
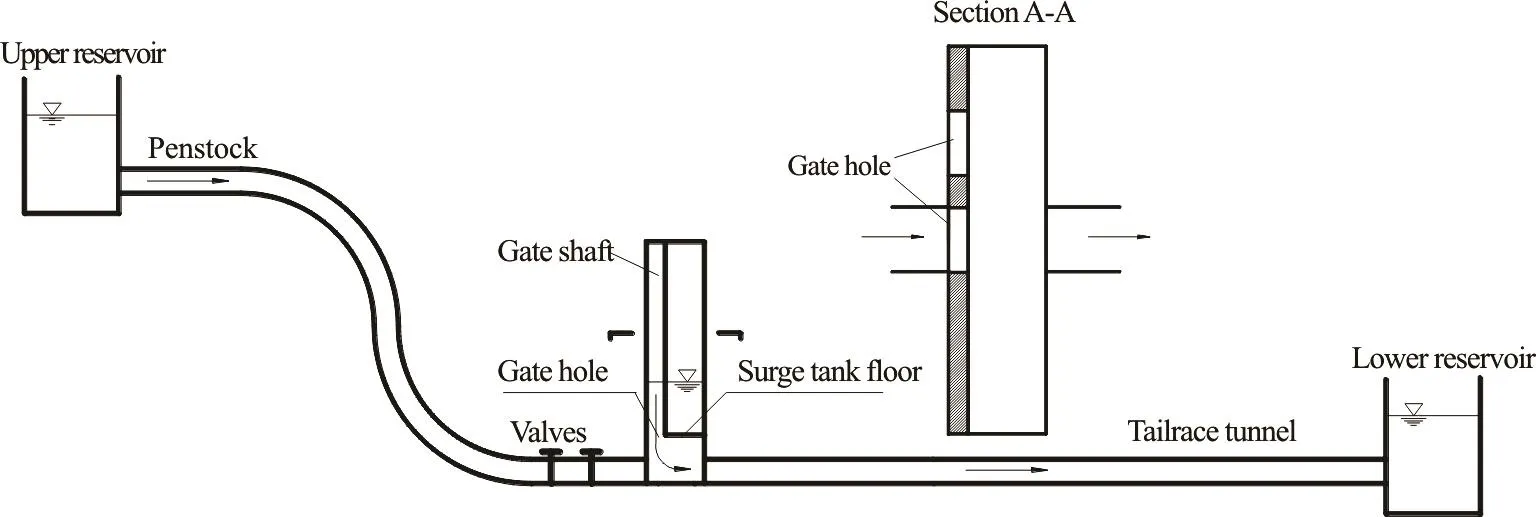
Fig.1 Setup of the model test system
This paper studies the formation mechanism of the ATVVs in the LCSST and proposes simple measures to eliminate them. First, the 3-D CFD model for predicting the ATVVs is validated by flow observations in a model tailrace LCSST. Then the formation mechanism of the ATVVs is analyzed theoretically and numerically. Furthermore, two simple measures to eliminate the ATVVs are proposed, their feasibilities are verified and compared, and consequently the optimized one is recommended.
1. Physical model and numerical methods
1.1 Physical model
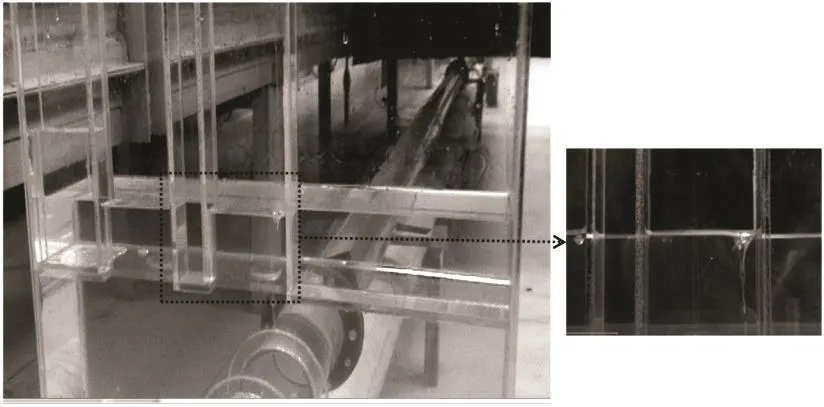
Fig.2 Photograph of a vertical vortex in the free-surface above the gate holes
A model test system with a tailrace LCSST(Fig.1) is built to investigate the surge wave characteristics, along with the ATVVs (Fig.2) above the gate holes. The surge tank has a long cubic shape (0.60 m long, 0.12 m wide and 0.80 m deep). The gate holes,with functions as the throttled orifices in the floor plate of the tank, are located at the upstream side , in a rectangular shape (with a size of 0.03 m×0.10 m).Section A-A in Fig.1 shows the plane view of the surge tank and the asymmetrical arrangement. In the normal generating mode of a hydropower plant, the water flows from the upper reservoir to the chamber under the surge tank by the penstock, then through the tailrace tunnel (with diameter of 0.10 m and length of 11.60 m), and finally into the downstream reservoir.In the model test, the turbine is substituted by a valve.The transient processes are achieved by the valve opening. The free-surface is stationary under the steady operating condition. But under the transient conditions of the load rejection, when the valves are closed suddenly, the water in the tailrace tunnel will fluctuate between the surge tank and the lower reservoir, the surge tank water level will fall and rise, and the water will flow into and out of the surge tank through the gate holes. Besides, a PIV system is the principle means of measurements and recordings.Figure 2 shows a photograph of the laboratory model and the recording place of the PIV.
1.2 Numerical methods
CFD techniques have been applied successfully to simulate the vertical vortices at intakes with good results[11,12]. However, accurately simulating the surge tank waves in a tank-tunnel-reservoir system is not easy[13,14], and capturing the ATVVs in the LCSSTs is even more difficult[9,10].
Careful selections of CFD models and parameters are essential. We use the commercial software FLUENT 14.0[15]for the simulations. The volume of fluid (VOF) model[16]for the two-phase flow and the realizable -kmodel[17]for the turbulence in the software are selected.
The numerical simulations are performed according to the geometric conditions of the physical model,except that the circular-sectioned pipes are replaced by square-sectioned ducts for improving grid quality,as shown in Fig.3. The geometric domain is discretized by a grid of 2.03×10⁶cells, with at least four cells in the viscous sublayer for resolving the nearwall flow. Moreover, the cells near the gate holes are locally refined to ensure the calculation accuracy.
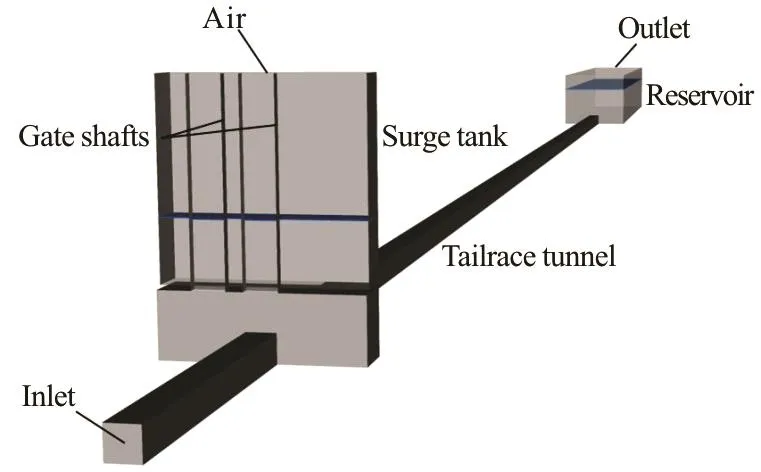
Fig.3 Computational domain and boundary conditions
The boundary conditions shown in Fig.3 are defined as follows: (1) At the inlet, a user-defined-function (UDF) is adopted to define the discharge variat0 i.o0 n0 5of thedraft twu b ite h,ind 1e csr edausri n ing gtl hin eelaoral yd rfe rjoe m c-tion process. (2) The outlet is a part of the downstream reservoir, where the constant water level of 0.125 m is implemented by adding an overflow weir. (3) The air is specified to the upper boundaries above the surge tank and the reservoir. (4) The remaining boundaries are treated as the non-slip walls with the wall-function.
For the pressure interpolation, the PRESTO!Scheme, which is highly recommended for a pressurebased solver, is selected. For the transient flow simulations, the PISO algorithm is chosen to obtain the coupling solution for the velocity and pressure equations. The Geo-Reconstruct scheme is used to capture the free-surface[19]. Before the transient process simulations, the flow fields are first initialized by the steady flow simulations.
This paper studies the formation mechanism of the ATVVs in the LCSST and proposes simple measures to eliminate them. First, the 3-D CFD model for predicting the ATVVs is validated by flow observations in a model tailrace LCSST. Then the formation mechanism of the ATVVs is analyzed theoretically and numerically. Furthermore, two simple measures to eliminate the ATVVs are proposed, their feasibilities is verified and compared, and consequently the optimized one is recommended.
2. Validation of numerical method by the physical model observation
2.1ATVV observation in the physical model
A load rejection condition, in which the discharge of the gate valve decreases from 0.005 m3/s to 0 m3/s linearly within 1 s, is tested in the model system, and the following phenomena are observed. During the water falling process (Fig.4), a significant open channel flow in the longitudinal direction of the surge tank is observed, and the water level in the left part of the surge tank becomes lower than that in the right part, due to the rectangular surge tank shape and the asymmetric arrangement of the gate holes. When the water level falls to a certain submerged depth, a surface vortex is formed on the right side of the right gate shaft above the gate hole (t= 3.0s). With the continued decrease of the water level and the increase of the flow velocity in the gate hole, the scale, the depth and the intensity of the vortex gradually increase. Later, the vortex becomes an ATVV and its scale is developed to the maximum =4.0st. Besides,other vortices are generated on the both sides of the left gate shaft. After that, some air bubbles are dropped off the tip of the continuous ATVVs, and are dragged down by the surrounding flow. As a result,the continuous ATVVs are intensified to the intermittent ATVVs (=4.5stand =5.0st). Finally, the vortices become weaker and disappear due to the decrease of the draining effect, and are finally submerged by the surrounding flow (t= 6.0s). The vortex positions and structures at typical times during the first drawdown process are shown in Fig.5.
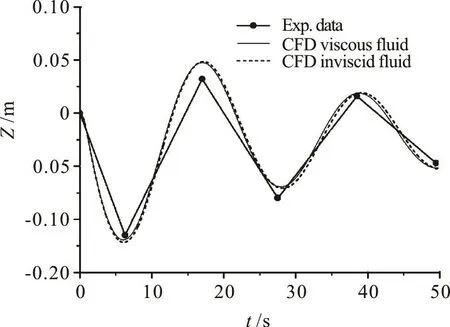
Fig.4 rison of surge tank wave histories in the model
2.2Comparison of numerical simulated ATVVs withthe observations
During the hydraulic transient process of the load rejection, the discharge in the draft tube decreases gradually with the close of the turbine (which is here substituted by a valve), and finally the discharge reaches zero when the valve is closed. Due to the inertia,the water flows out of the LCSST, resulting in a water level decrease in the tank. Figure 4 shows the comparisons of the water levels between the CFD simulations and the model test results. The inviscid flow is also simulated and the comparisons between the viscous fluid and the inviscid fluid are made. The calculated water levels by both methods are nearly the same, which means that the viscosity has little influence on the macro-parameters when the penstock is short, and its influence on the air-entraining vortex remains to be further studied. The good agreement of the wave histories between the CFD simulation and the model test, especially in the first drawdown, is shown. This, to some extent, proves the validity of the 3-D-VOF method.
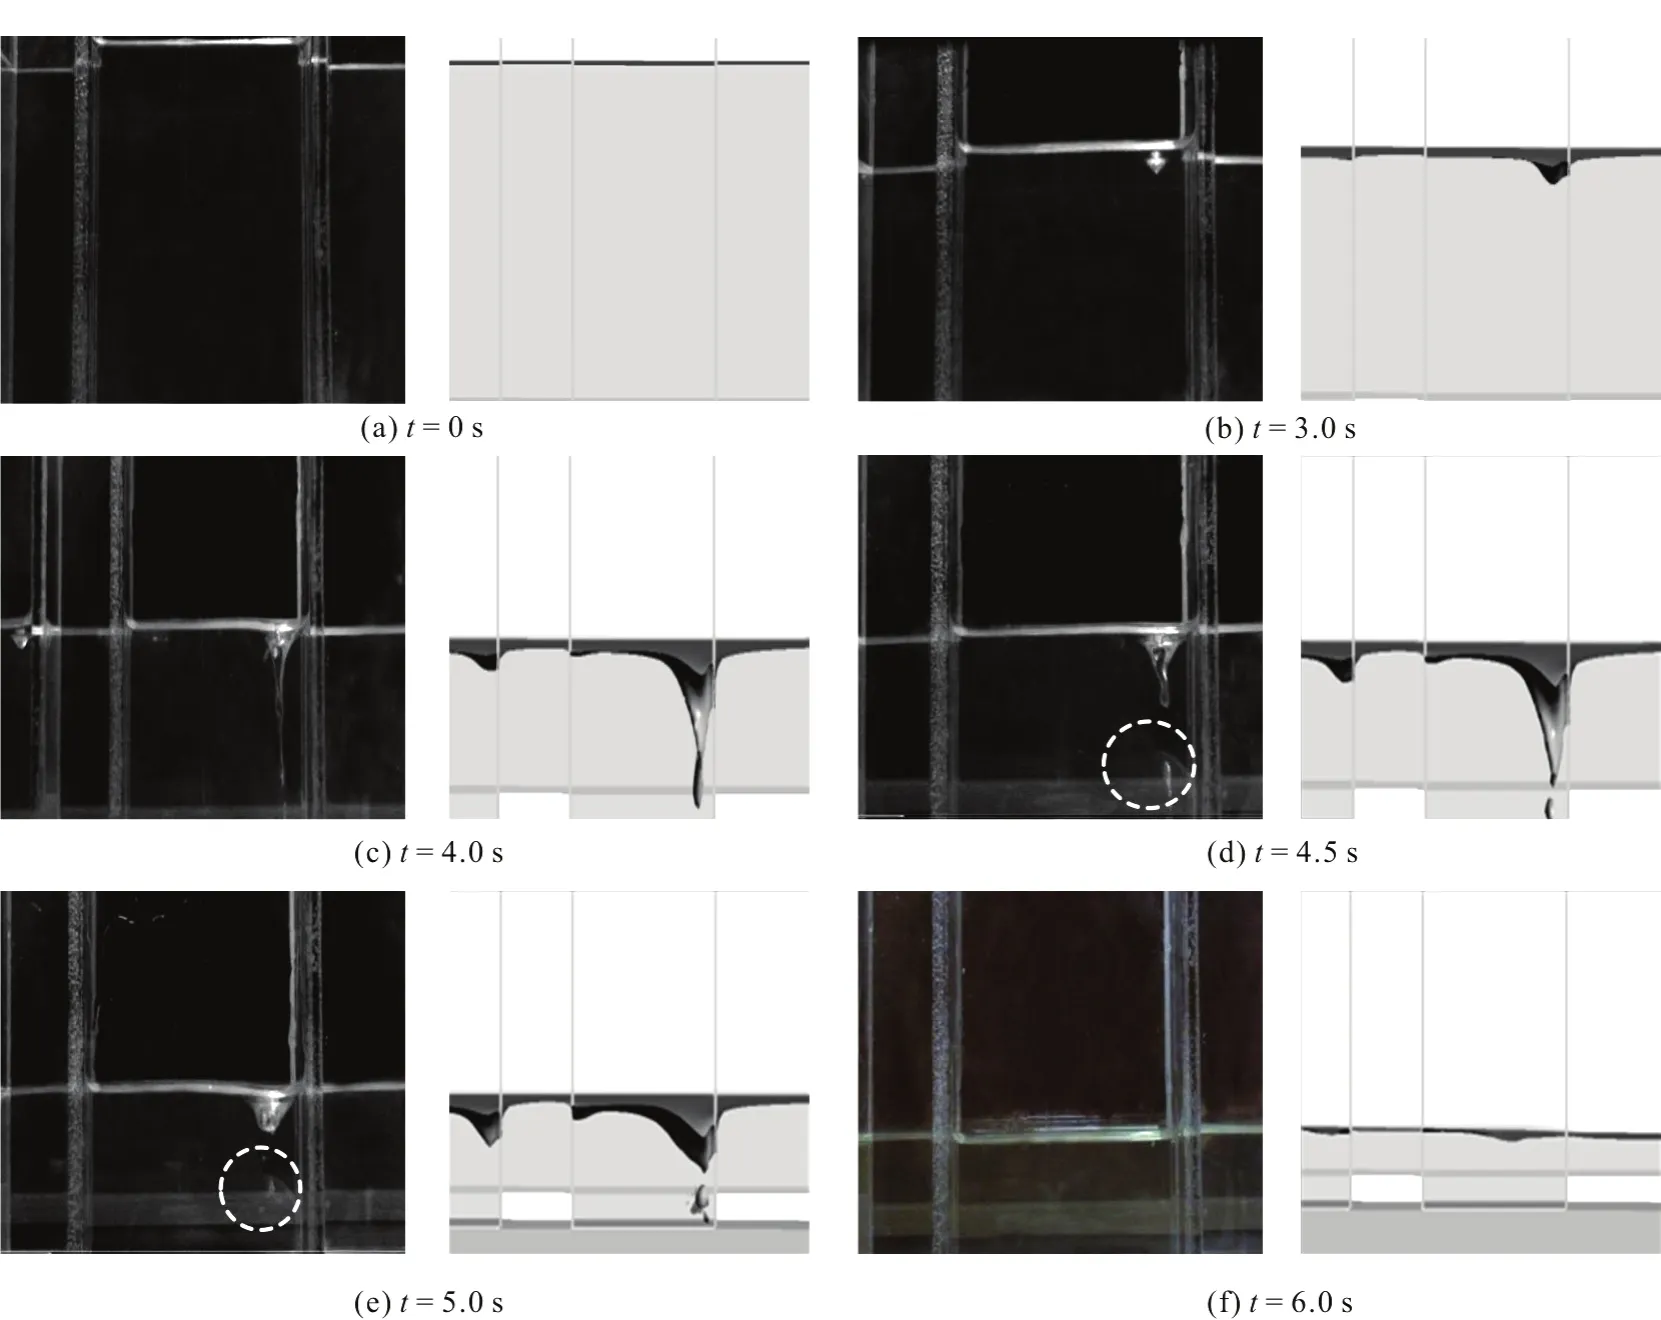
Fig.5 Comparisons of flow patterns between model test and CFD simulation
Comparing the two columns in Fig.5, we can see that the CFD simulated flow patterns of the formation and evolution processes of the flow patterns are in good agreements with the model tests. The predicted number, the time of appearance, the location, and the general structure of the vortices are nearly the same as those observed in the experiments. What is more, the CFD simulations accurately catch the intermittent ATVVs. On the whole, the CFD simulations can reproduce the expe rimental AT VV phenomena , and are qualified fortheanalysesofthemechanismandthe elimination of the ATVVs.
3. Formation mechanism and eliminating methods of ATVVS
3.1 Analysis of formation mechanism of ATVVs
Nevzat and Fikret[3]investigated the formation mechanism of air-entraining vortices at intakes with a cross-flow both analytically and experimentally. He suggested that the superposition of the uniform flow and the point sink is the main factor influencing the formation of air-entraining vortices. To be more specific, the potential flow at intakes with a cross-flow is considered to be the combination of a point sink and a uniform canal flow, which is known as the Rankine's ovoids or the half-bodies. And the Rankine's halfbodies divide the flow into two regions: the flow areas entering and not entering the intakes. When the upper boundary of the Rankine's ovoids reaches the water surface directly above the intake center , the critical submergences occur and can be expressed as
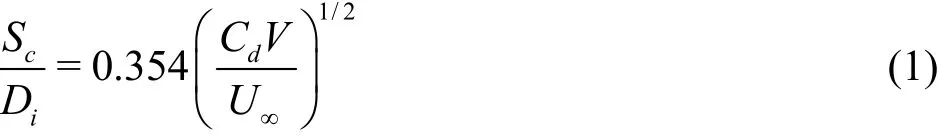
where Scis the critical submergence, Cdis the discharge coefficient of the intake, Diis the internal diameter of the intake pipe, Viis the velocity in intake pipe, U∞is the velocity of uniform canal flow.
In our study, the water flows out of the surge tank through the gate holes after the load rejection. The significant longitudinal flow is formed due to the corridor shape and the asymmetric arrangement of the gate shafts. And the flow has the characteristics of a uniform canal flow. At the same time, the water flows out of surge tank though the gate holes and can be considered as a point sink. Therefore, the potential flow in the surge tank can be considered as the superposition of a point sink and a uniform canal flow.(Fig.6) So we can use the aforementioned theory to analyze the formation of the ATVVs. When the flow in the model test approaches the critical condition of the ATVVs from the large submergence, the following events are observed: when the submerged depth is large (t < 3.0s) the fluid flow in the Rankine's halfbodies can have a sufficient supplement form the upper water, without an obvious sign of dimples. If the submerged depth is lowered slightly (at about t = 3.0s ), the upper boundary of the Rankine's halfbodies reaches the free-surface and a small visible dimple appears as a first sign of the ATVVs. With the decrease of the submerged depth (t > 3 .0s), the free-surface falls under the upper boundary of the Rankine's half-bodies and the ATVVs occur. The concept of the “critical submergence” may be defined as the value of submergence when the ATVVs just occur in the surge tank. The critical submergence is the main factor influencing the formation of air-entraining vortices. Accordingly, an effective solution for avoiding the ATVVs is to provide a sufficient submergence to the surge tank.
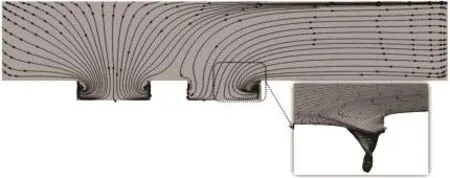
Fig.6 Streamlines on the free-surface in the surge tank (t= 4.0s)
3.2 Eliminating schemes of ATVVs
The existing studies[1,18]show that the Froude number and the velocity circulation are the controlling parameters in the equations for the critical submergence. Under typical model conditions, viscous effect is neglected and some of the equations for the critical submergence are as follows:
Odgaard[1]
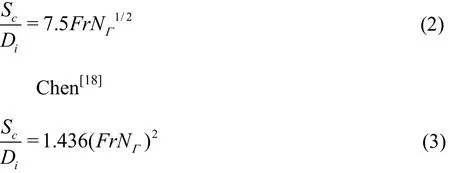
where Fr is the Froude number, NΓis the velocity circulation.
Therefore, we can eliminate the ATVVs by increasing the initial submergence in the surge tank or suppressing the velocity circulation. Therefore, we may propose the following measures to eliminate the ATVVs:
(1) Lower the level of the surge tank floor to increase the submerged depth.
(2) Change the flow direction into the gate holes.This will change the initial velocity circulations and reduce the critical submergence.
However, in the measure (1), the arrangement of the underground LCSSTs might be difficult because of the limited construction space. Thus, the measure of lowering the height of the surge tank floor is neither feasible nor economic. For the measure (2),two schemes are proposed for verification and comparison:
(1) Scheme 1
As shown in Fig.7, two longer baffles, 0.09 m long,0.01 m wide and 0.15m deep, are set up at x = 0.10m and x = 0.15m. Besides, a shorter baffle,0.04 m long, 0.01 m wide and 0.15 m deep, is placed at x = 0.375m. And the bottom surfaces of baffles are connected to the surge tank floor. The vortex elimination idea of this scheme is as follows: the two longer baffles can change the direction of the longitudinal flow on the right side of the surge tank and make it flow along the rear wall of the surge tank.Thus, the water will flow into the right gate hole almost laterally. These may reduce the velocity circulations near the gate holes. Furthermore, the shorter baffle is set up to avoid the longitudinal flow forming a velocity circulation on the left side of the right gate hole. The streamlines show in Fig.8 illustrates this.
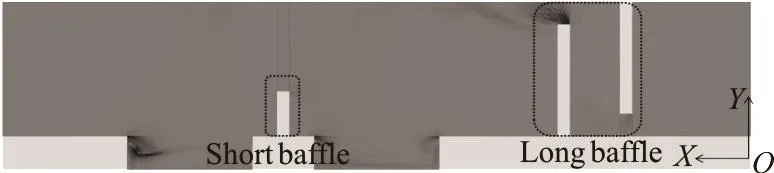
Fig.7 Schematic diagram of Scheme 1
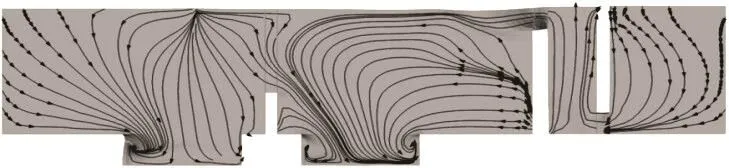
Fig.8 Streamlines on the free-surface of surge tank for Scheme 1 (t=4.0s)
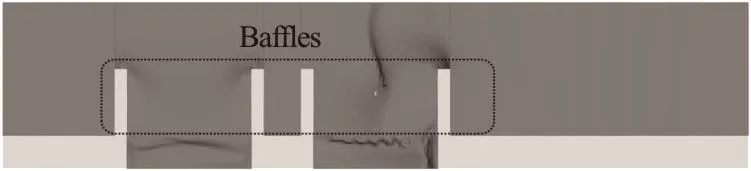
Fig.9 Schematic diagram of Scheme 2
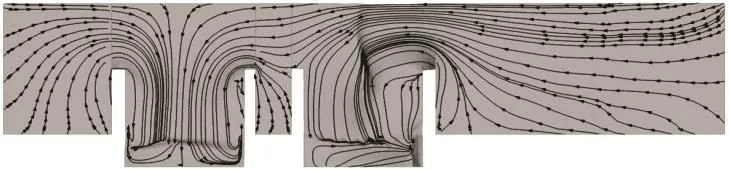
Fig.10 Streamlines on the free-surface of surge tank for Scheme 2 (t=4.0s)
(2) Scheme 2
As shown in Fig.9, four baffles are set up on the both sides of the gate holes and the size of the baffles is 0.06 m×0.01 m×0.15 m (width×length×deep). The bottom surfaces of the baffles are connected to the surge tank floor. The vortex elimination idea is as follows: the baffles change the location where the water flows around the gate holes and make the initial velocity circulations being formed in the middle of the surge tank. Thus, the velocity circulations will not be formed at the gate holes. As a result, the ATVVs are avoided. The streamlines show in Fig.10 illustrates this.
3.3Effects of ATVV elimination schemes
Figures 11 through 13 show the flow patterns in the surge tank for the original scheme (no elimination means adopted), the Scheme 1 and the Scheme 2,respectively. During the evolution of vortices, =0stis corresponding to the starting time of the load rejection, =4.0stis around the time when the ATVV scale develops to its maximum, and =6.0stis around the time when the ATVVs disappear. It is noteworthy that the submerged depths of the three schemes are the same to exclude the influence of the initial submerged depth (Fig.11(a), Fig.12(a) and Fig.13(a)).
3.3.1 Effect of Scheme 1
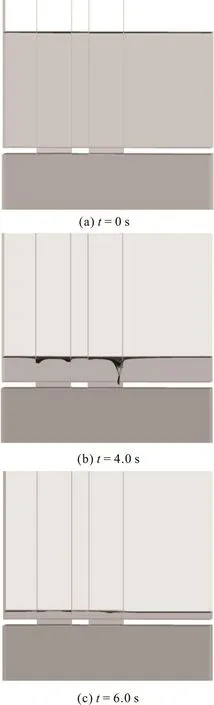
Fig.11 Flow patterns in surge tank for the original scheme
Comparing Fig.11 with Fig.12, we find that the ATVV on the right side of the right gate shaft is eliminated, and there is no vortex on the two sides of the right gate shaft, and the right side of the left gate shaft. But the surface vortex on the left side of the left gate shaft is developed into a certain size. However,the surface vortex does not intensify to form a harmful ATVV. This conclusion can be verified by the streamlines shown in Fig.8, in which the water almost laterally flows into the right gate hole. On the contrary,there is a velocity circulation on the left side of the left gate hole. But an obvious flow jump across the two baffles for the longitudinal flow is restricted by them(Fig.12(b)).
3.3.2 Effect of Scheme 1
Figure 13 shows the flow patterns for the Scheme 2. It is obvious that the ATVV on the right side of the right gate shaft is eliminated, and there is no any vortex on the two sides of the gate shafts. The free-surface above the gate holes has some downward sunken portions (Figs.13(b), 13(c)) due to the tiny wa-ter fluctuations in the surge tank. This can be verified by the streamlines shown in Fig.10, where the water almost flows laterally into the gate holes and there is no velocity circulation.
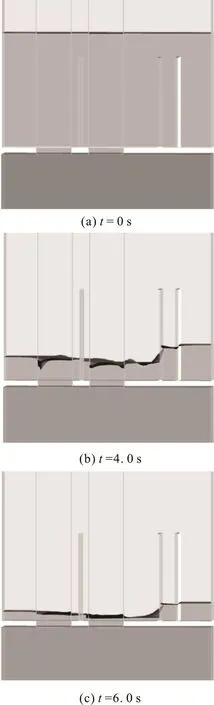
Fig.12 Flow patterns in surge tank for Scheme 1
3.3.3 Flow resistance of different schemes
The attenuating rate of the surge tank wave is mainly affected by the flow resistance. The surge tank wave histories of the three schemes during the first drawdown are shown in Fig.14. The curves of the Scheme 1 and the Scheme 2 agree well with those of the original scheme, indicating that the baffles do not have much effect on the flow resistance of the water system.
3.3.4 Comparison of the two schemes
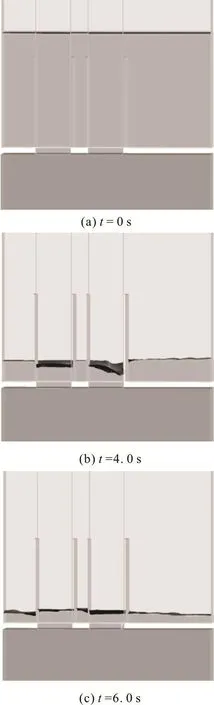
Fig.13 Flow patterns in surge tank for Scheme 2
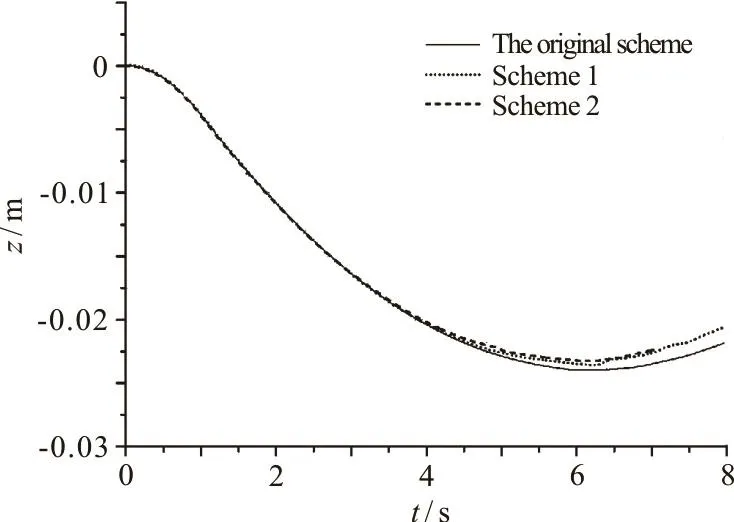
Fig.14 Surge tank wave histories for three schemes during the first drawdown
With the Scheme 1, the direction of the longitudinal flow is changed and the goal of eliminating the ATVVs is basically achieved. However, a larger submerged depth might be required to ensure the safety of operation because the baffles have a great blocking effect on the outflow of the gate holes.Compared with the Scheme 1, the Scheme 2 is more effective in eliminating the ATVVs. Moreover, the water surface is more stable. Therefore, the Scheme 2 will be recommended for further study and practical applications.
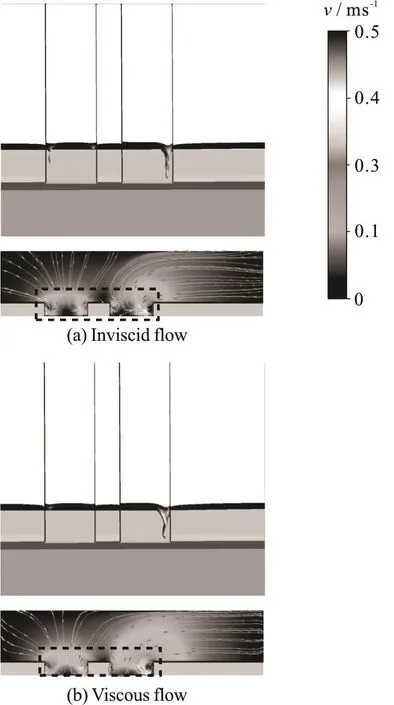
Fig.15 Comparisons of flow patterns between inviscid flow and viscous flow at the same instants
3.4 Influences of viscosity in the simulation
As mentioned above, with and without consideration of the viscosity in the CFD simulation, the calculated water levels by both methods see, little difference. That means that the viscosity has little influence on the macro-parameters when the penstock is short, as the friction loss caused by the viscous dissipation along the penstock is relatively small.However, the free surfaces of the air-entraining vortex in case of different viscosities see obvious differences,as shown in Fig.15. The free surfaces of the viscous fluid reveal spiral traces during the transient processes,caused by turbulent shear flows. As expected, the free surfaces of the inviscid fluid are smooth, and the size of the vortex of the inviscid fluid is smaller than that of the viscosity fluid. In the potential flow theory of the Rankin's half-bodies, the flow is considered to be inviscid without circulation in the incoming uniform canal flow, but in the real fluid-flow, the effects of the viscosity, the surface-tension, the gravity, and the circulation do exist. The streamlines of the inviscid flow (Fig.15(a)) marked by red boxes show that the fluid flows into the gate shaft directly without any recirculation. On the contrary, the streamlines of the viscous flow spiral into the gate shaft (Fig.15(b)). In another word, the traditional potential flow solution is effective to explain and predict the ATVVs, but the viscosity should be taken into consideration to reveal more real and reliable fluid patterns.
4. Conclusions
In this paper, through CFD simulations and model tests, the formation mechanism of the ATVVs in the LCSST is elucidated, and two simple measures to eliminate them are proposed.
From the analysis of the ATVV developing process, it is seen that the potential flow in the surge tank can be considered as the superposition of a point sink and a uniform canal flow, which is known as the Rankine's half-bodies. With the theory of the Rankine's ovoids, the formation of the ATVVs is analyzed, and it is found that the critical submergence in the surge tank is the main factor influencing the ATVVs. The traditional potential flow solution is effective to explain and predict the ATVVs, but the viscosity should be taken into consideration to reveal more real and reliable the fluid patterns.
Reducing the Froude number and the velocity circulation can effectively reduce the critical submergence. Based on this understanding, two schemes to eliminate the ATVVs are proposed. The basic idea is to avoid the formation of the initial velocity circulations so that the critical submergence can be reduced and the ATVVs will not be formed owing to the sufficient submergence. It is shown that the Scheme 2 can yield better flow patterns because the four baffles are placed on the two sides of the gate shafts which can reduce the velocity circulations, making the ATVVs disappear and the water surface stable. Therefore, the Scheme 2 is recommended for further study.
[1] Odgaard A. J. Free-surface air core vortex [J]. Journal of Hydraulic Engineering, ASCE, 1986, 112(7): 610-620.
[2] Li H. F., Chen H. X., Ma Z. et al. Experimental and numerical investigation of free-surface vortex [J]. Journal of Hydrodynamics, 2008, 20(4): 485-491.
[3] Nevzat Y., Fikret K. Critical submergence for intakes in open channel flow [J]. Journal of Hydraulic Engineering,ASCE, 1995, 121(12): 900-905.
[4] Nevzat Y., Abdul S. E., Kerem T. Critical submergence for dual rectangular intakes [J]. Journal of Energy Engineering, 2012, 138(4): 237-245.
[5] Chen Y. L., Wu C., Ye M. et al. Hydraulic characteristics of vertical vortex at hydraulic intakes [J]. Journal of Hydrodynamics, 2007, 19(2): 143-149.
[6] Wang Y. K., Jiang G., Liang D. F. Investigation of air-core vortex at hydraulic intakes [J]. Journal of Hydrodynamics,2010, 22(2): 673-678.
[7] Wang Y. K., Jiang C. B., Liang D. F. Comparison between empirical formulae of intake vortices [J]. Journal of Hydraulic Research, 2011, 49(1): 113-116.
[8] Li S. B. Research on the influencing factors of vortex at hydraulic intakes [D]. Doctoral Thesis, Tianjin, China:Tianjin University, 2009(in Chinese).
[9] Wu J., Yang J. D. Three-dimensional flow field analysis of erect swirl in strip-shaped and restricted-orifice surge chamber [J]. Water Resources and Power, 2008, (4):105-107, 168(in Chinese).
[10] Deng S. Y., Cheng Y. G. Flow characteristics of long corridor-shaped surge tank and elimination of the air-entraining vertical vortices: CFD simulation and analysis [J].Journal of HydroelectricEngineering, 2009, 28(4):131-142(in Chinese).
[11] Chen Y., Wu C., Wang B. et al. Three-dimensional numerical simulation of vertical vortex at hydraulic intake [J].Procedia Engineering, 2012, 28: 55-60.
[12] Okamura S., Tomoyoshi T., Kamemoto T. et al. CFD simulation of flow in model pump sumps for detection of vortices [C]. 8thAsianInternational Fluid Machinery Conference. Yichang, China, 2005, 12-15.
[13] Cai F., Cheng Y. G., Zhang X. X. Approaches to guarantee accurate 3D CFD simulations of surge tank wave [J].Engineering Journal of WuhanUniversity, 2016, 49(3):390-396(in Chinese).
[14] Xia L. S., Cheng Y. G., Zhou D. Q. 3-D simulation of transient flow patterns in a corridor-shaped air-cushion surge chamber based on computational fluid dynamics [J]. Journal of Hydrodynamics, 2013, 25(2): 249-257.
[15] ANSYS FLUENT 14.0 theory guide [M]. Canonsburg, PA,USA: ANSYS Inc., 2011.
[16] Tang X. L., Wang F. J., Li Y. J. et al. Numerical investigations of vortex flows and vortex suppression schemes in a large pumping-station sump [J]. Journal of Mechanical Engineering Science, 2011, 225(6): 1459-1480.
[17] Keshavarzi G., Guan H. Y., Barber T. Comparison of the VOF and CLSVOF methods in interface capturing of a rising bubble [J]. Journal of Computational Multiphase Flows, 2013, 5(1): 43-56.
[18] Chen Z. N., Wu C., Chen Y. G. et al. Experiment study of vertical vortex at hydraulic intakes [J]. Journal of Southwest University for Nationalities (Natural Science Edition),2006, 32(4): 799-804(in Chinese).
June 1, 2016, Revised March 22, 2017)
* Project supported by the National Natural Science Foundation of China (Grant No. 51579187).
Biography: Fang Cai (1990-), Female, Master
Yong-guang Cheng,
E-mail: ygcheng@whu.edu.cn
杂志排行

水动力学研究与进展 B辑的其它文章
- On the clean numerical simulation (CNS) of chaotic dynamic systems *
- BEM for wave interaction with structures and low storage accelerated methods for large scale computation *
- Flow-pipe-soil coupling mechanisms and predictions for submarine pipeline instability *
- Simulation of flows with moving contact lines on a dual-resolution Cartesian grid using a diffuse-interface immersed-boundary method *
- On the hydrodynamics of hydraulic machinery and flow control *
- A 3-D SPH model for simulating water flooding of a damaged floating structure *