Measurement and calculation of solubility of quinine in supercritical carbon dioxide☆
2017-05-28FatemehZabihiMehrdadMirzajanzadehJingfuJiaYapingZhao
Fatemeh Zabihi,Mehrdad Mirzajanzadeh ,Jingfu Jia ,Yaping Zhao ,*
1 Department of Chemical Engineering,Islamic Azad University,Ayatollah Amoli Branch Amol,Iran
2 Department of Chemical Engineering,Islamic Azad University,Tehran Science and Research Branch,Tehran,Iran
3 School of Chemistry&Chemical Engineering,Shanghai Jiaotong University,Shanghai 200240,China
1.Introduction
Supercritical Fluid Extraction Technology(SFET)has attracted a great deal of attention in separation and purification of natural substances.Specially,supercritical CO2(SCCO2)offers interesting characteristics as a non-toxic,non- flammable,low cost and easily process-able solvent with moderate critical properties.[1–3].In order to develop an efficient supercritical extraction or purification system it is necessary to achieve a deep insight into the phase behavior and equilibrium properties of the target substance in supercritical media[4–8].A multitude of procedures(batch and continuous)have been suggested for experimental phase equilibrium studies and rationalized by numerical modeling.Various models including Equal Activity Coefficients,Clusters Solvent,and Liquid Solvent models are employed in different ranges of operating condition[8–9].All of these models are traditionally applied with cubic equations of state(CEOS)and van der Waals(vdW)mixing rules.Cubic equations of state are basically associated with the physical parameters of the solute compound or solid phase[10–12].Semi-empirical(density-based)models are also proposed as the simple alternatives to the conventional numerical models.An adequate theoretical model should allow a precise correlation on experimental solubility data within the studied operating condition.Moreover,the physical properties of the solid phase need to be known in details or computable as the key modeling parameters.Quinine is a traditional anti-infection,anti-malaria,anti-fever,anti-chill,and an intermittent of endemic goiter[13],conventionally obtained by extraction from the root ofDichroa febrifugawith boiling water.This method is associated with thermal degradation and need a post-purification step[13].Supercritical CO2extraction is a promising alternative to this traditional technique.Fig.1 shows the chemical structure of quinine.This paper reports an original work on experimental and theoretical phase equilibrium studies for quinine–SCCO2binary system.The experimental results were correlated using various cubic and semi-empirical equations of state and calculation results were compared in terms of accuracy and accordance to the experimental data.

Fig.1.Molecular structure of quinine.
2.Materials and Methods
2.1.Materials
Quinine(average particle size:5–50 μm,purity:99.89%)was purchased from SCR CO.,China.Carbon dioxide(99.95%purity)was supplied by Rui Li Co.,Ltd.,China.Ethanol(99.8%,analytic grade)was purchased from Sinopharm Co.,China.
2.2.Experimental method and apparatus
Details of experimental apparatus and procedure were explained in our previous work[14].Schematic model of the experimental set-up is presented in Fig.2.In brief,the system consists of four main parts,a saturation cell,a circulation pump and a sampling tube equipped with inlet and outlet one-way valves.Whole system is located in a temperature controlling bath.The saturation cell(S.S.,35 cm;length,4.5 cm;i.d.)is pre-loaded with 5 g pure quinine powder.In order to unify the size distribution and increase the specific area of the solid phase,quinine powder was grinded by jet mill,before loading in saturation cell.CO2is pressurized and delivered to the saturation cell using a high pressure CO2syringe pump.Once reaching to the desired supercritical condition CO2is injected over system and circulated using a high pressure pump(max. flow;50 ml·min−1)for 2 h to guarantee that the saturate solubility is reached.The time required for reaching to the saturation state was determined by several preliminary examinations.After reaching to the saturation point the circulation pump is stopped and the sampling tube is separated from the circulation loop by closing the inlet and outlet valves and dismounted from the system while a little amount of saturated supercritical solution(quinine–SCCO2)is trapped inside.Then the sampling tube is connected to a glass jar containing 30 ml ethanol(stock solution),and depressurized slowly.The quinine dissolved in supercritical CO2is deposited in the sampling tube,then the whole sampling system,including the tube and the valves are washed using a specific volume of ethanol,and all the washing solution is added to the stock solution.Resultant solution(collecting solution)is then diluted by 5 times and analyzed using ultraviolet spectrophotometry detector(UV,765PC,Shanghai Spectrum Instruments,Shanghai,China)at 324 nm.Each experiment was performed in triplicate.Error range was less than 5%,however we represented the average value obtained in each trail.The calibration curve was determined by preparation of standard solutions and fitted with 0.999 regression coefficient.Knowing the density of SCCO2,internal volume of sampling part(tube and valves)and the concentration of quinine in collecting solution,the solubility of quinine in SCCO2at each operating point(pressure and temperature)was determined using the following equations.Density of CO2corresponding to each operating condition was obtained from the National Institute of Standards and Technology(NIST) fluid property database.
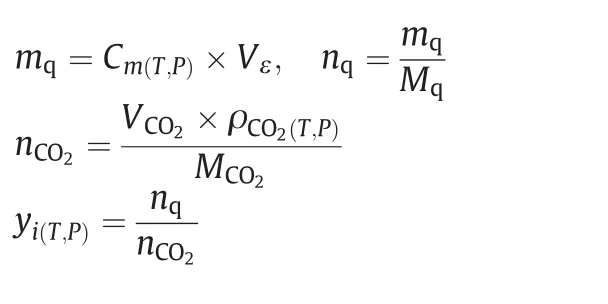

Fig.2.Schematic illustration of experimental apparatus;1—CO2 cylinder,2—cooling system,3—CO2 injection pump,4—solute stage,5—circulation pump,and 6—sampling tube.
Cm(T,P)denotes the concentration of quinine in collecting solution.Vεstands for the volume ofthe collecting.mq&nqrespectively indicate the mass and mole of quinine precipitated in sampling route.ρCO2(T,P),VCO2andnCO2are respectively the density,the volume and the mole of SCCO2trapped in sampling system.yi(T,P)is the mole fraction of quinine in supercritical CO2in a specific operating condition(pressure and temperature).
3.Results and Discussion
Solubility is defined as the molar ratio of quinine to CO2,in saturated supercritical solution trapped in sampling tube.Experimental condition and solubility values are presented in Table 1.Independent on temperature the effect of pressure on solubility follows a normal increasing trend,attributed to the increase of the density of CO2,decrease in the average intermolecular distances,resulting in stronger interactions between the solute and the solvent molecules[13].Influence of temperature on solubility is obviously more complicated.As shown in Table 1,at the lower pressures(8 MPa and 10 MPa)solubility reduces with increase in temperature,however an inverse trend is started around 12 MPa and keeps continuing to 24 MPa.It means that in the present supercritical system there is a crossover region at the pressure range of 10–12 MPa,in which the effect of temperature on physical properties of fluid phase and therefore on solubility shows a dramatic change.In supercritical systems the effect of temperature on solubility is controlled by a combined contribution of vapor pressure and density of fluid phase and consequently by molecular interactions[4,8,15].Below the crossover region(10–12 MPa in current case),the density of CO2is the dominant factor,which decreases by increasing temperature,resulting in solubility reduction.While above this region,the effect of vapor pressure is more dominant,which increases with temperature,and consequently causes the increase of solubility[15].
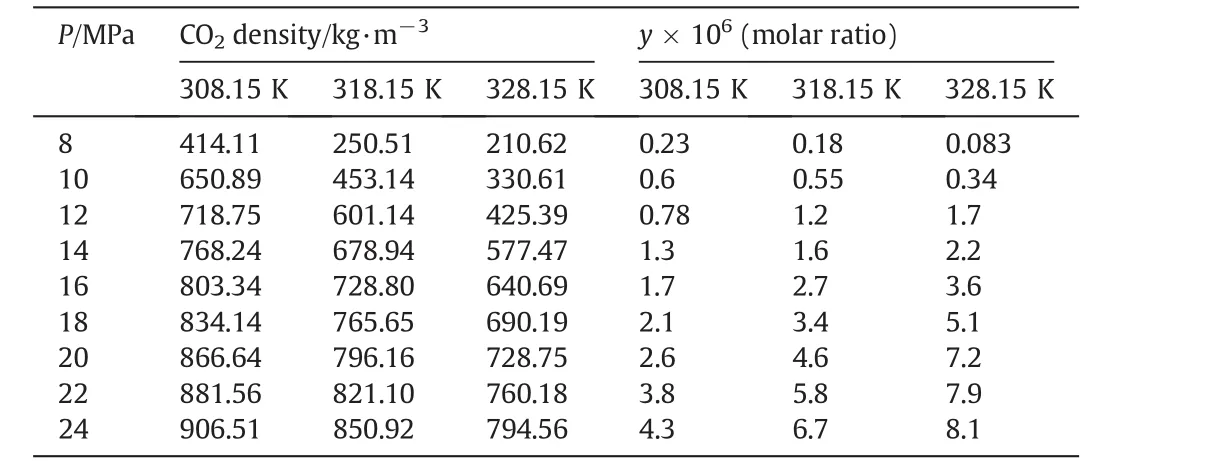
Table 1Experimental solubility data of quinine–supercritical carbon dioxide versus pressure and temperature
The experimental solubility data were correlated by two densitybased models,and two cubic equations of state applied in iso-fugacity model.Iso-fugacity model resulted from equating the fugacity of solute in solid and fluid phases[6,16]:

The superscripts of s and SCF denote the solid and supercritical phase,respectively.The other notations include:operating pressure and temperature(PandT),partial molar volume of pure solute(υs),the fugacity coefficient of the pure solute at its sublimation pressure(φS),the fugacity coefficient of the solute in the supercritical phase(φSCF)and the sublimation pressure of the pure solute(Psub).Fugacity coefficients are usually calculated by cubic equations of state.In the binary and multi-component systems the coefficients of cubic equations of state are calculated using mixing rules.The type of equation of state and the adopted mixing rules strikingly affect the accuracy of data correlation process[8].In this work two cubic equations of state;PR and DPTG,depicted in Table 2[9,12–16],were employed to correlate the solubility data in iso-fugacity model.Both PR and DPTG equations of state were applied with both one or two-interaction parameters vdW mixing rules(vdW1&vdW2)[12,16]:
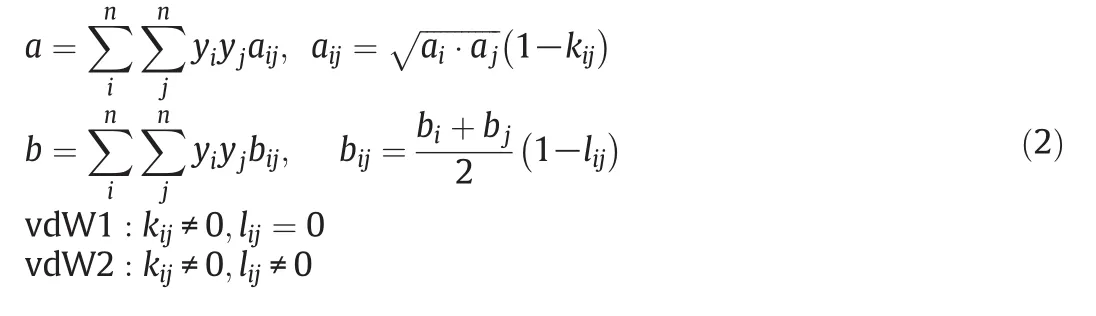
kandlare the interaction coefficients andi,jindicate the solute and fluid phases,respectively.In this modeling work the interaction coefficients were considered as adjustable parameters,and calculated by data fitting.Tables3&4 present the interaction coefficients estimated as fitting parameters using PR and DPTG cubic equation of state with both vdW1 and vdW2 mixing rules.Sublimation pressure was calculated by a temperature dependent correlation[15],as illustrated by Eq.(3).
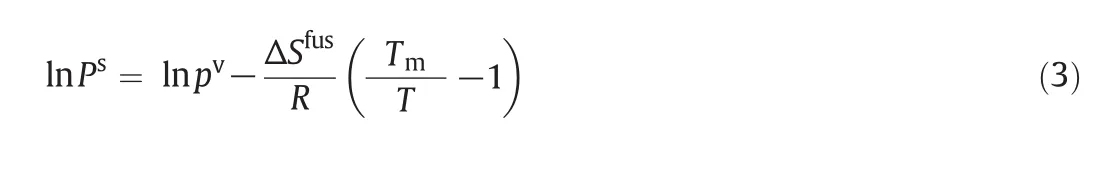
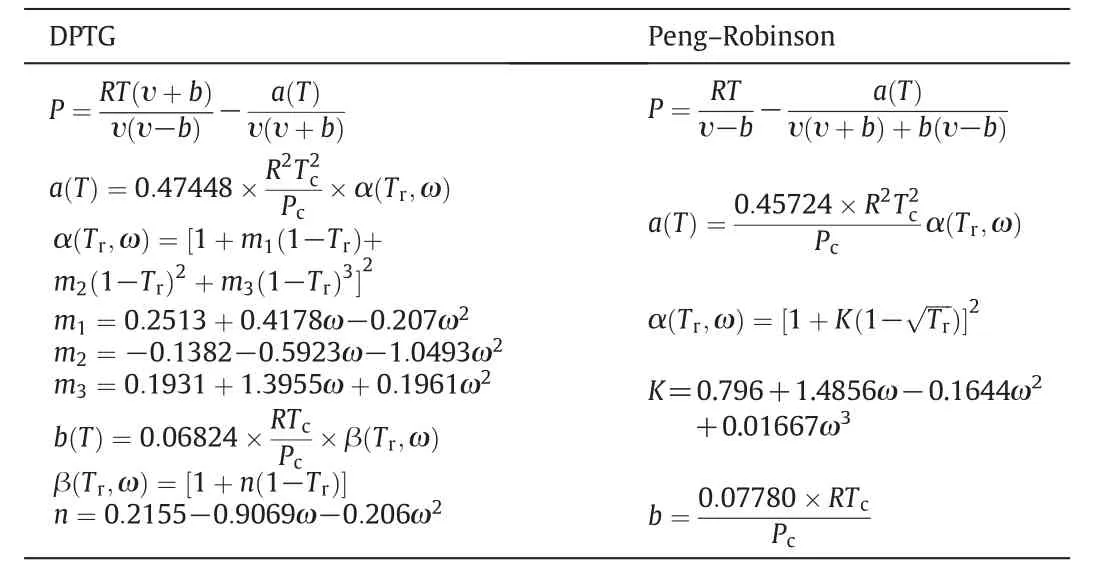
Table 2Cubic equations of state,applied for correlation of quinine–supercritical carbon dioxide solubility data with iso-fugacity model
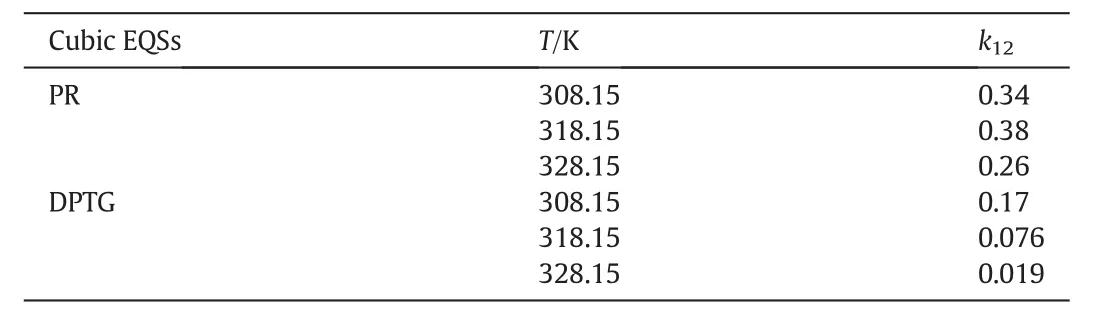
Table 3Interaction parameters obtained from data fitting by cubic equations of state;PR and DPTG,within single-parametric(vdW1)mixing rules
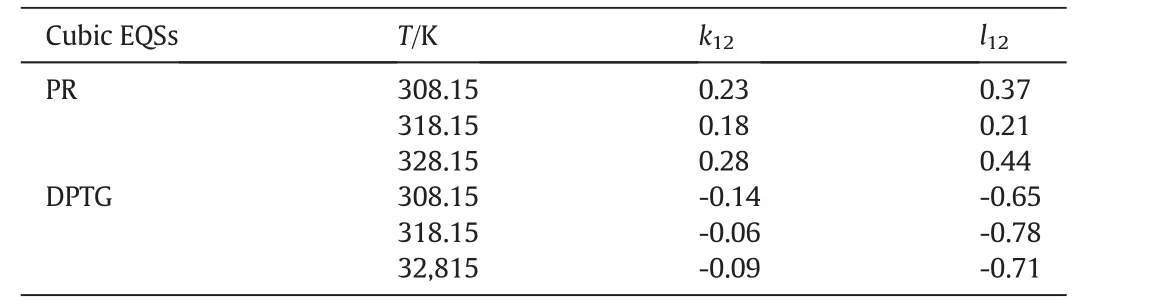
Table 4Interaction parameters obtained from data fitting by cubic equations of state;PR and DPTG,within two-parametric(vdW2)mixing rules
Pv,ΔSfusandTm,respectively,stand for the vapor pressure,fusion entropy and the melting point of solid solute[17–20].RandTare the universal constant and operating temperature,in turn.pvwas calculated by Ambrose–Walton method,and for ΔSfusandTmsimple group contribution methods were applied[21–24].Acentric factor(ω)and critical properties of quinine,including the critical pressure,temperature,compressibility factor and molar volume were also estimated by group contribution methods[22–25],and results are shown in Table 5.
Among the density-based models MST and Modified Bartle semiempirical equations,presented in Table 6,were employed to calculate the equilibrium solubility of quinine in SCCO2in the range of studied operating conditions.The coefficients of semi-empirical models were considered as the fitting parameters and estimated through a simple non-linear data fitting[10,24–25].The optimum parameters obtained from data fitting on Modified MST and Modified Bartle equations are listed in Table 7.The model coefficients are temperature independent and specific for any given binary system.Accuracy of correlations was assessed and compared using the Average Absolute Relative Deviations(AARD),obtained by Eq.(4).

yi,calcandyi,exp.respectively denote the calculated and experimental solubility values in any specific pressure and temperature.Nindicates the number of experimental data points.Fig.3 exhibits the AARD values obtained at each temperature and modeling system.
According to AARD values in Fig.3 experimental data are well correlated by density-based models.This can be justified as follows:the key advantage of density-based models is that the governing equations are typically independent on physical properties of solid solute,which are mostly unavailable and need to be estimated through theoretical approachesi.e.group contribution methods.These theoretical methods induce unavoidable errors to calculation system and increase the average deviation[16–25].More interestingly,the most accurate data correlation for quinine–SCCO2system is attained using the Modified MST model.Bartle equation also provides a relative precise fitting,however it results in a higher standard deviation with respect to MST.This is quite consistent with literature reports,suggesting MAST model as the best choice to support the phase equilibrium behavior of heavy and polar organics in supercritical media[26].
Among the cubic equations of state only DPTG provide a relative better fitting on experimental data,when combined with vdW2 mixing rules.The reason might be that the repulsion term(b)in DPTG equation is temperature dependent.Moreover,in DPTG equation the term of acentric factor appeared on both attraction and repulsion coefficients,which substantially covers the non-ideality of system[24–26].DPTG equation also can give an accurate correlation for the systems with asymmetric molecular interactions(like quinine–SCCO2)in which the repulsion parameter(b)plays a crucial rule[24].On the other hand the favorable correlation obtained by DPTG equation indicates that the estimated physical properties(Table 5)are reliable for being used and referenced in any other phase equilibrium studies on quinine.It is also noteworthy that the PR equation of state is typically constructed based on the dense systems such as liquid phase media,therefore it may overestimate the compressibility factor,inducing big errors in the calculation system[27].The larger deviations that occur in correlation with PR and DPTG within vdW1 resulted from the inherent limitation in mixing rules when the repulsion parameter(lij)is ignored.For both PR and DPTG equations of state,it can be seen that using vdW2 mixing rules results in much better accordance with the experimental data,implying the remarkable contribution of repulsion coefficient(lij)to the equilibrium behavior of binary supercritical systems,especially in the case of the large solid solutes like quinine.The results of data correlation by Modified MST and DPTG equations of state,utilized in combination with vdW2 are presented and compared with the experimental results in Figs.4 and 5.
Broadly speaking,for all the studied cases at the middle temperature(318.15 K)the correlated data reveal a relative smaller deviation from experimental points,compared to the other temperatures.This trend looks more significant when the cubic equations of state are used for data correlation(iso-fugacity model).This is presumably because of the solubility of supercritical fluid in solid phase which is assumed to be zero[8].In the high temperature condition(328.15 K),this assumption will be weak due to the increase in the diffusivity of supercritical CO2.In the low temperature condition(308.15 K),the large error incalculation by cubic equations of state can be due to the density fluctuation in near critical region[25].Therefore,the experimental data,obtained at 318.15 K,are correlated better than those obtained at 308.15 K and 328.15 K.
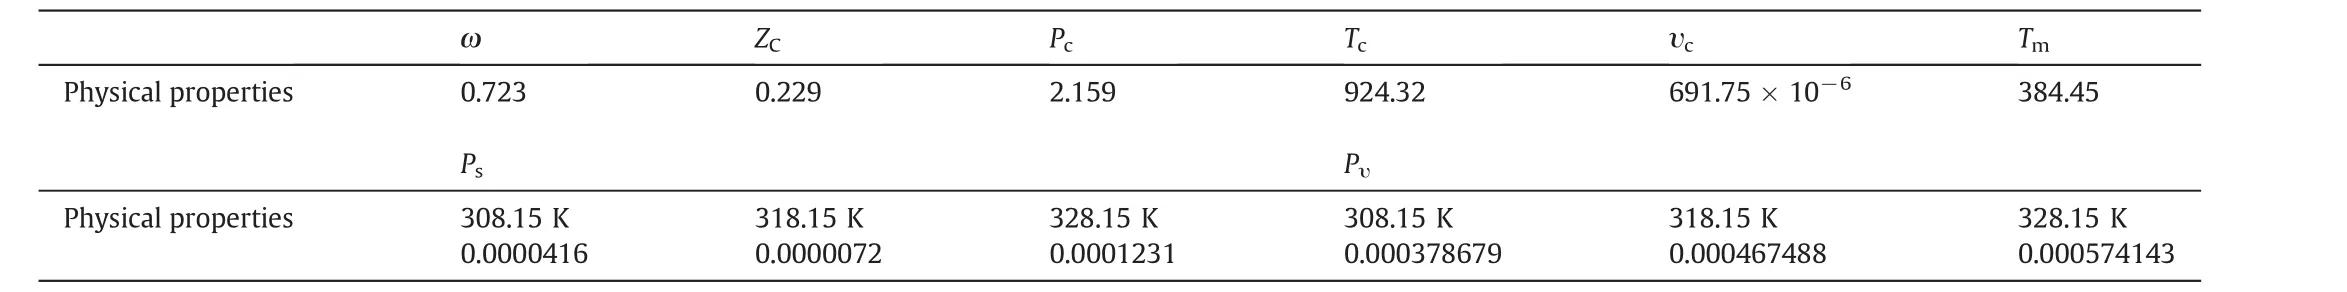
Table 5Physical properties of quinine,estimated by group contribution methods

Table 6Semi-empirical equation of states,applied for correlation of quinine–supercritical carbon dioxide solubility data

Table 7Coefficients of Modified MST and Modified Bartle semi-empirical models,estimated by fitting on quinine–supercritical carbon dioxide solubility data

Fig.3.Average absolute standard deviation(AARD)between experimental data and calculated data obtained with different modeling approaches.
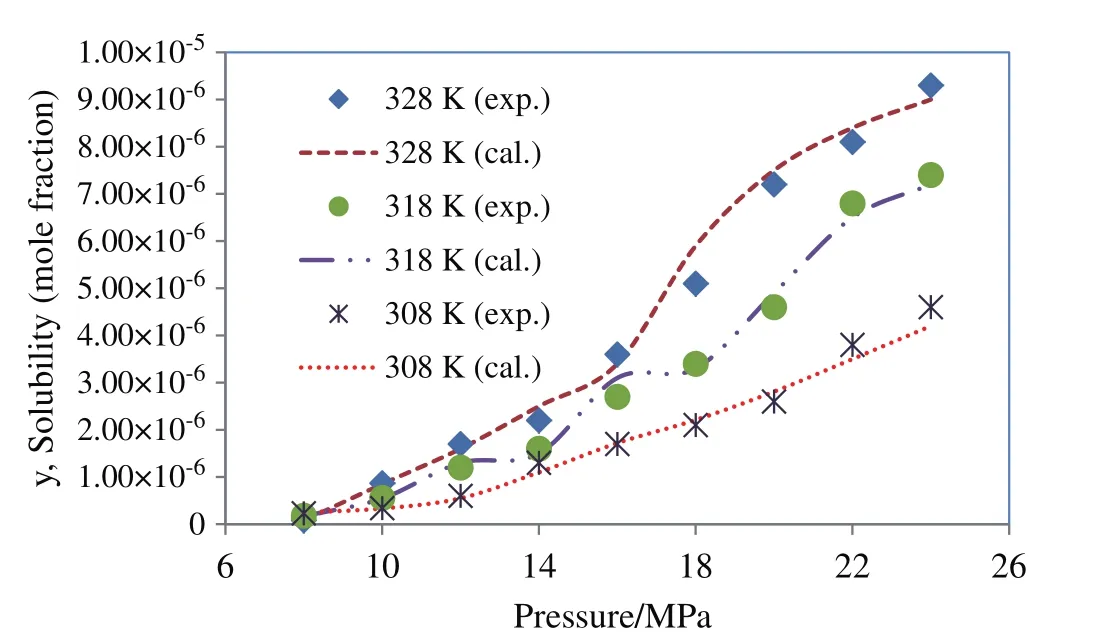
Fig.4.Solubility of quinine in supercritical carbon dioxide;comparison between experimental data(Table 1)and calculated data obtained using Modified MST.
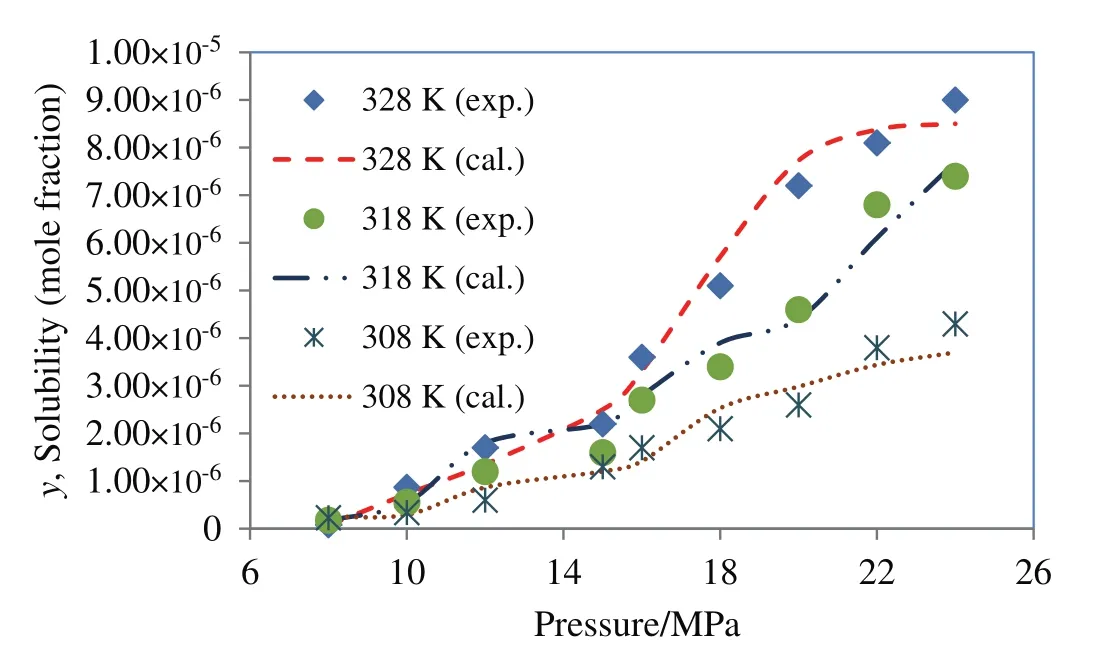
Fig.5.Solubility of quinine in supercritical carbon dioxide;comparison between experimental data(Table 1)and calculated data obtained using DPTG equation of state within vdW2 mixing rules.
4.Conclusions
The phase equilibrium behavior of quinine–supercritical CO2was studied experimentally and theoretically for the first time.The experiments were set to the pressure range of 8–24 MPa and three iso-therms of 308.15 K,318.15 K and 328.15 K.The experimental data were correlated by iso-fugacity and density-based models.Modified Mendez–Santiago–Teja showed the most desirable fitting on the experimental data and the highest deviation between experimental and calculated data were observed when Peng–Robinson Equation of State was employed.It is also concluded that the modeling with the cubic equations of state based on the ideal mixing rules(no interaction parameters)or single interaction parameter mixing rules will end to big calculation errors and dramatic deviations between calculated and experimental data.According to the high reproducibility of experimental results and the good correlation results we suggest that both operational and numerical methods used in this work can be confidently followed for the similar binary supercritical systems.
[1]A.M.Karim,D.M.Kassim,M.S.Hameed,Phase equilibrium study for the separation of solid components using supercritical carbon dioxide,Thermodyn.J.4(2010)201–212.
[2]C.C.Tsai,H.M.Lin,M.J.Lee,Solubility of niflumic acid and celecoxib in supercritical carbon dioxide,J.Supercrit.Fluids95(2014)17–23.
[3]J.Zhu,C.Chang,H.Wu,J.Jin,Solubility of polyvinyl alcohol in supercritical carbon dioxide and subcritical 1,1,1,2-tetrafluoroethane,Fluid Phase Equilib.404(2015)61–69.
[4]S.Ismadji,Y.H.Ju,F.E.Soetaredjo,A.Aning,Solubility of Azadirachtin in supercritical carbon dioxide at several temperatures,J.Chem.Eng.Data56(2011)4396–4399.
[5]G.Brunner,Applications of supercritical fluids,Ann.Rev.Chem.Biomol.Eng.1(2010)321–342.
[6]E.Reverchon,L.De Marco,Supercritical fluid extraction and fractionation of natural material,J.Supercrit.Fluids38(2006)146–166.
[7]M.M.R.De Melo,A.J.D.Silvestre,C.M.Silva,Supercritical fluid extraction of vegetable matrices:Applications,trends and future perspectives of a convincing green technology,J.Supercrit.Fluids92(2014)115–176.
[8]H.S.Yeoh,G.H.Chong,N.M.Azahan,A.R.Rahman,T.Shean,Y.Choong,Supercritical fluid extraction of vegetable matrices:Applications,trends and future perspectives of a convincing green technology,Eng.J.17(3)(2003)67–78.
[9]M.Ardjmand,M.Mirzajanzadeh,F.Zabihi,Computation and modeling of solid drugs solubility in supercritical systems,Chin.J.Chem.Eng.22(5)(2014)549–558.
[10]M.Mirzajanzadeh,F.Zabihi,M.Ardjmand,Measurement and correlation of ibuprofen solubility in supercritical carbon dioxide using Stryjek and Vera EOS,Iran.J.Chem.Eng.7(4)(2010)42–49.
[11]A.J.Schultz,K.Shaul,S.Yang,D.A.Kofke,Modeling solubility in supercritical fluids via the virial equation of state,J.Supercrit.Fluids55(2010)479–484.
[12]G.R.Pazuki,S.Mansouri,F.Feyzi,Modified cubic equation of state for prediction VLE phase behavior of fluids:Pure and mixture,Sep.Sci.Technol.42(8)(2007)1883–1899.
[13]H.Misra,K.M.Bhupendra,D.C.Jain,Optimization of extraction conditions and HPTLC-UV method for determination of quinine in different extracts of cinchona species bark,Rec.Nat.Prod.2(4)(2008)107–115.
[14]J.F.Jia,F.Zabihi,Y.H.Gao,Y.Zhao,Solubility of glycyrrhizin in supercritical carbon dioxide with and without cosolvent,J.Chem.Eng.Data60(2015)1744–1749.
[15]A.C.Duarte,S.Santiago,H.C.Sousa,C.M.Duarte,Solubility of acetazolamide in supercritical carbon dioxide in the presence of ethanol as a cosolvent,J.Chem.Eng.Data50(2005)216–220.
[16]M.Turk,M.Crone,T.Kraska,A comparion between models based on equations of state and density-based models for describing the solubility of solutes in CO2,J.Supercrit.Fluids55(2010)462–471.
[17]B.Han,D.Y.Peng,A group-contribution correlation for predicting the acentric factors of organic compounds,Can.J.Chem.Eng.71(1993)332–334.
[18]L.Constatinou,R.Gani,New group contribution method for estimating properties of pure compounds,AICHE J.40(1994)1697–1710.
[19]K.G.Joback,R.C.Reid,Estimation of pure-component properties from groupcontributions,J.Chem.Commun.57(1987)233–243.
[20]A.P.Kudchadker,G.H.Alani,B.J.Zwolinski,The critical constants of organic substances,Chem.Rev.68(1986)659–735.
[21]D.L.Sparks,R.L.Hernandez,A.Estevez,Evaluation of density-based models for the solubility of solids in supercritical carbon dioxide and formulation of a new model,Chem.Eng.Sci.63(2008)4292–4301.
[22]M.H.Barley,G.McFiggans,The critical assessment of vapour pressure estimation methods for use in modeling the formation of atmospheric organic aerosol,Atmos.Chem.Phys.10(2010)749–767.
[23]S.Velasco,J.A.White,Some empirical rules concerning the vapor pressure curve revisited,J.Chem.Thermodyn.68(2012)193–198.
[24]Z.Tang,J.S.Jin,Z.T.Zhang,H.T.Liu,New experimental data and modeling of the solubility of compounds in supercritical carbon dioxide,Ind.Eng.Chem.Res.51(2012)5515–5526.
[25]M.R.Housaindokht,M.R.Bozorgmehr,Calculation of solubility of methimazole,phenazopyridine and propranolol in supercritical carbon dioxide,J.Supercrit.Fluids43(2008)390–397.
[26]L.Nasri1,Z.Bensetiti,Solubility of solids in supercritical fluids:The Mendez–Santiago–Teja model revisited,Adv.Chem.Eng.Sci.5(2015)413–423.
[27]A.M.Abudour,S.A.Mohammad,R.L.Robinson Jr.,K.A.M.Gasem,Volume-translated Peng–Robinson equation of state for saturated and single-phase liquid densities,Fluid Phase Equilib.335(2012)74–87.
杂志排行

Chinese Journal of Chemical Engineering的其它文章
- Influence of Na+,K+,Mg2+,Ca2+,and Fe3+on filterability and settleability of drilling sludge☆
- An improved flexible tolerance method for solving nonlinear constrained optimization problems:Application in mass integration
- An optimal filter based MPC for systems with arbitrary disturbances☆
- Solubility and metastable zone width measurement of 3,4-bis(3-nitrofurazan-4-yl)furoxan(DNTF)in ethanol+water
- Partition coefficient prediction of Baker's yeast invertase in aqueous two phase systems using hybrid group method data handling neural network
- The effect of transition metal ions(M2+=Mn2+,Ni2+,Co2+,Cu2+)on the chemical synthesis polyaniline as counter electrodes in dye-sensitized solar cells☆