Numerical investigation of flow through vegetated multi-stage compound channel*
2014-06-01WANGWen王雯HUAIWenxin槐文信GAOMeng高猛
WANG Wen (王雯), HUAI Wen-xin (槐文信), GAO Meng (高猛)
State Key Laboratory of Water Resources and Hydropower Engineering Science, Wuhan University, Wuhan 430072, China, E-mail: wangwen@whu.edu.cn
Numerical investigation of flow through vegetated multi-stage compound channel*
WANG Wen (王雯), HUAI Wen-xin (槐文信), GAO Meng (高猛)
State Key Laboratory of Water Resources and Hydropower Engineering Science, Wuhan University, Wuhan 430072, China, E-mail: wangwen@whu.edu.cn
(Received February 15, 2014, Revised May 5, 2014)
This paper addresses the problem of the renormalization groupk-εturbulence modeling of a vegetated multi-stage compound channel. Results from Micro acoustic Doppler velocimeter (ADV) tests are used with time and spatial averaging (doubleaveraging method) in the analysis of the flow field and the characterization. Comparisons of the mean velocity, the Reynolds stress, and the turbulent energy distribution show the validity of the computational method. The mean velocity profile sees an obvious deceleration in the terraces because of vegetation. Secondary flow exists mainly at the junction of the main channel and the vegetation region on the first terrace. The bed shear stress in the main channel is much greater than that in the terraces. The difference of the bed shear stress between two terraces is insignificant, and the presence of vegetation can effectively reduce the bed shear stress.
compound channel, open channel flow, vegetation, double-averaging concept, bed shear stress
Introduction
A compound cross section is often formed in natural rivers under the action of different dominant discharge rates. When the water level rises, the water surface extends from the main channel to the floodplain. Because of the increase both of the width of the free surface area and of the depth of the water, the area of the flow section increases, and this leads to an increase of the discharge capacity of the river channel[1]. In many cities, to increase the stability of river slopes and to facilitate constructions, river channels are often designed as multi-stage compound channels that can adapt to different flow rates. Vegetation may be planted on the river terraces to beautify the environment. In the design of the cross-sectional shape of a channel,one would normally consider the hindering effect of the river terrace vegetation on the flow, but ignore the reinforcing effect its roots have on the bank soil, which can reduce the amount of sand introduced into the atmosphere[2,3].
Under the action of a compound river channel boundary and the secondary flow, the velocity distribution within the river channel becomes extremely complex. Wu et al.[4,5]developed a depth-averaged 2-D numerical model to simulate the flow through emergent and submerged rigid vegetations. Rameshwaran and Shiono[6]studied the depth-averaged velocity distribution along a cross section. Hamidifar and Omid[7]experimented with rigid cylindrical rods to study the flow velocity and secondary velocity distributions within a compound open-channel. Chen et al.[8]obtained the analytical solution of the flow velocity in a lateral distribution by considering the effects of the secondary flow. Wu et al.[9]studied the vegetation effects on the drag and inertia forces in the momentum equations and proposed a vertical two-dimensional model in the simulation of the wave propagation through vegetated waterbodies.
When a river flow is hindered by vegetation, it is very important to understand the redistribution of the flow velocity, which can have a crucial effect on thedischarge capacity. However, the Reynolds stress and the turbulent energy distribution also play important roles in determining the flow characteristics. Typically, as the distance from the vegetation varies, the spatial characteristics of the flow differ. For a macroscopic river modeling, the hydrodynamic variables generally represent a stationary and ergodic random field. When the time averaging is performed over a very long period, and the space averaging is performed over a representative elementary volume, the averaged flow characteristics can be used for macro conditions. Based on this consideration, Souliotis and Prinos[10]studied the effects of a vegetation patch on the flow and turbulence characteristics. Elghanduri[11]and Prinos et al.[12]focused their attention on the turbulent flow over and within a porous bed.
The above studies concern with the flow characteristics of a single-stage compound channel, and the plants on the river terrace are considered as non-submerged. This paper carries out experimental and numerical simulations to study the flow characteristics of a two-stage compound channel with both submerged and non-submerged plants.
1. Model description
1.1Physical model[13]
The experiments are performed using the laboratory flume at Wuhan University. The flume is 20 m long, 1 m wide, and 0.5 m deep, and the outlet and inlet structures of the flume are connected to a hydraulic circuit that allows a continuous recirculation of the stable discharge at a rate of 0.135 m3/s.
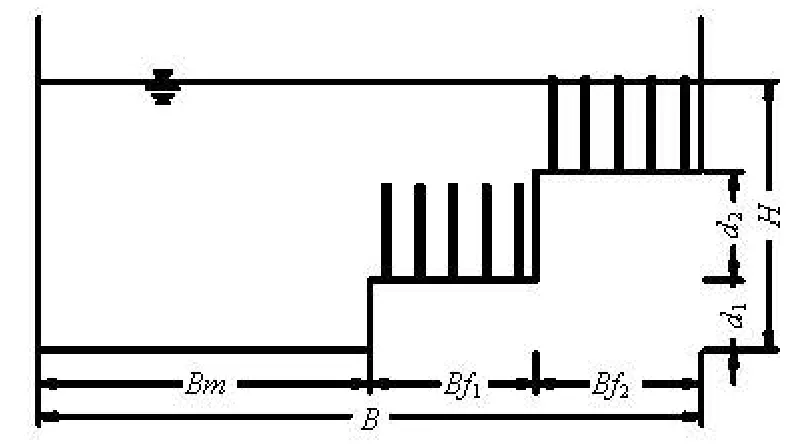
Fig.1 Schematic diagram of the two-stage compound open channel
The flume bed slope (S0) is set to 0.0004. Figure 1 shows the cross-sectional shape of the flume with the following geometrical parameters:Bm=0.5 m,Bf1=0.25 m,d1=0.106 m,Bf2=0.25 m, andd2= 0.163 m. To model the vegetation, rigid cylinders are placed in the first and second terraces along the central portion of the flume of 8 m in length. The diameter and the height of the cylinders are 0.006 m and 0.14 m, respectively. The cylinders are arranged in lines 0.05 m apart and with lengthwise spacing of 0.20 m. The water depth is adjusted by a gate at the end of the flume to form a water surface slope parallel the bed slope in the test area. This is referred to as uniform flow conditions. The water depth (H) is 0.405 m.
The 3-D water velocity and turbulence are measured with the SonTek/YSI 16MHz Micro acoustic Doppler velocimeter (ADV). Each measurement point with a sampling volume of 9×10⁻⁸m3works at a sampling frequency of 50 Hz for 60 s of sampling time. The test data with a signal-tonoise ratio less than 15 and a correlation coefficient less than 70% are removed from the final analysis. The measured data are processed using the space-averaging method.
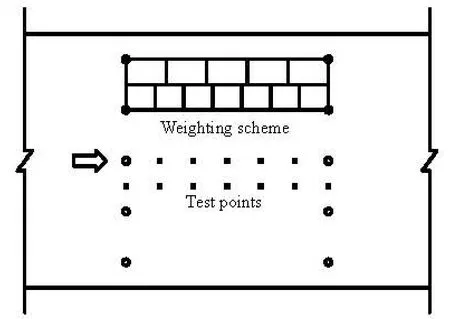
Fig.2 Plan view of the test points and the weighting scheme
Figure 2 is the plan view of the spatial sampling points in the test and the weighting scheme. The channel is divided into 20 regions in the transverse direction, and 12 measuring points are set within each region, five measurement points behind the vegetation and seven within the vegetation. The weighted-average method is used for each measured value. The weighting factor of each measurement point is the percentage of its area over the total weighting area, as shown in Fig.2.
1.2Mathematical model
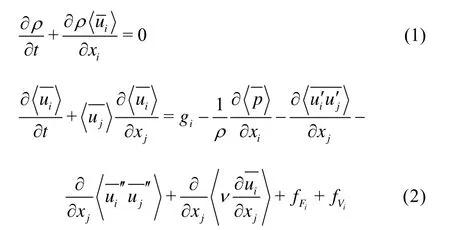
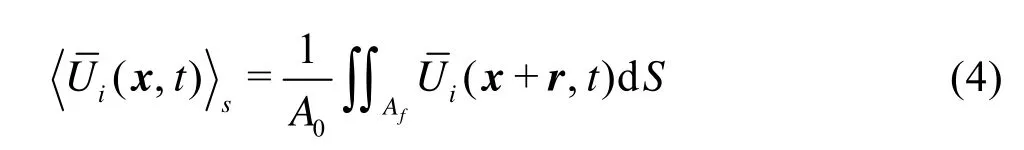
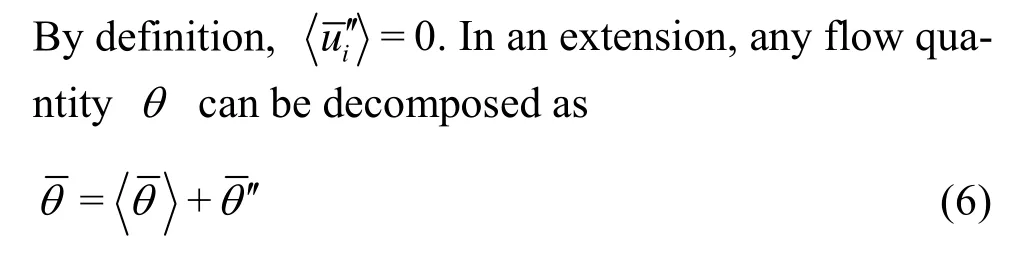
Using the double-averaging method[14]for a gravity-driven, open-channel, free surface flow, the continuity equation and the momentum conservation equation can be written as:
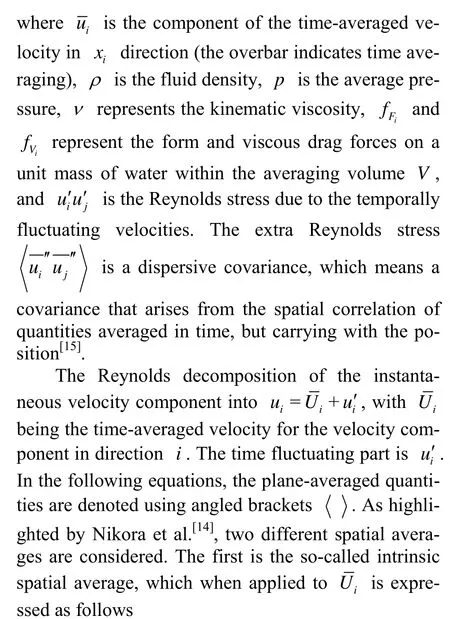
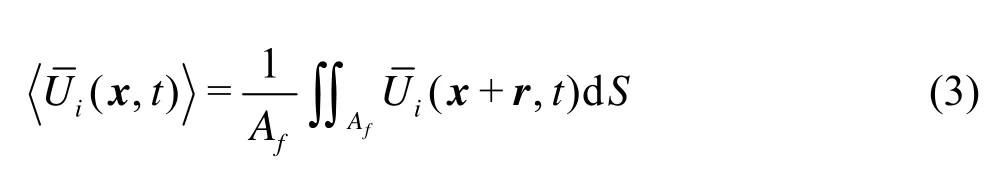
The second average is the so-called superficial spatial average[14]
The renormalization group (RNG)k-εmodels are more accurate and reliable for a wider class of flows than the standardk-εmodel. They provide an improved performance for several types of flows, including the flows with separation zones and those around curved geometries. The features of the flow in open-channel sharp bends, such as the flow separation and the secondary flow are associated with a complex mean strain and are sensitive to the anisotropy of the turbulence[16].
The main difference between the RNG and the standardk-εmodels lies in the additional term in theεequation. An expression forRε, is based on the additional expansion parameterη, which is the ratio of the turbulent to the mean strain time scale, and the resulting expression is
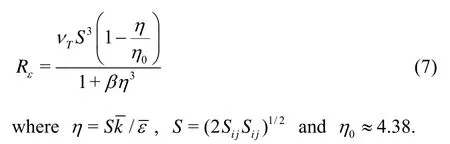
The constantβis chosen such thatβ=0.012, which results in a value for the von Karman constant of 0.4, a recommended value for turbulent channel flows. In theRε/k-εturbulence model, proposed by the present authors, theRεterm is adopted in the standardk-εformulation.
The equation for the turbulence kinetic energy (k) is
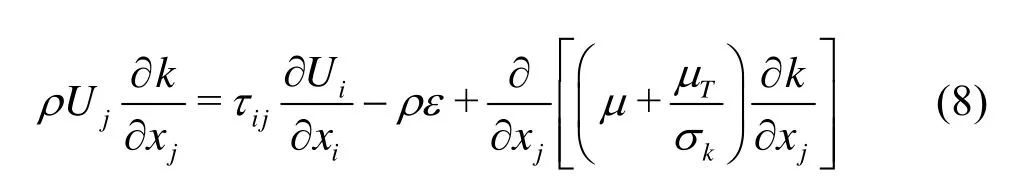
whereUiis the mean velocity,xiis the position vector,τijis the Reynolds stress,Tμis the eddy viscosity,kσis a closure coefficient with a value of unity, andεis the dissipation rate. The equation for the dissipation rate of the turbulence kinetic energy ()εisThe eddy viscosity concept is used for the treatment of the Reynolds stress. The Reynolds stress with time and space averaging can be written as follows
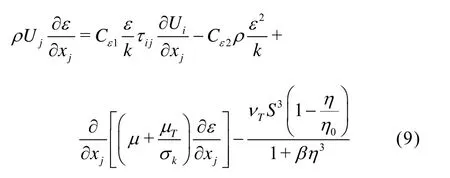
In Eq.(10), the eddy viscosity is determined by the Prandtl-Kolmogorov relationship, such that
The model constantsC1ε,Cε2,Cμandεσare 1.42, 1.68, 0.0845, and 1.3, respectively,δijis the Kronecker delta,kis the turbulence kinetic energy, andεis the turbulence dissipation rate. By ignoring the spatial fluctuation items, the Reynolds stresses can be expressed as
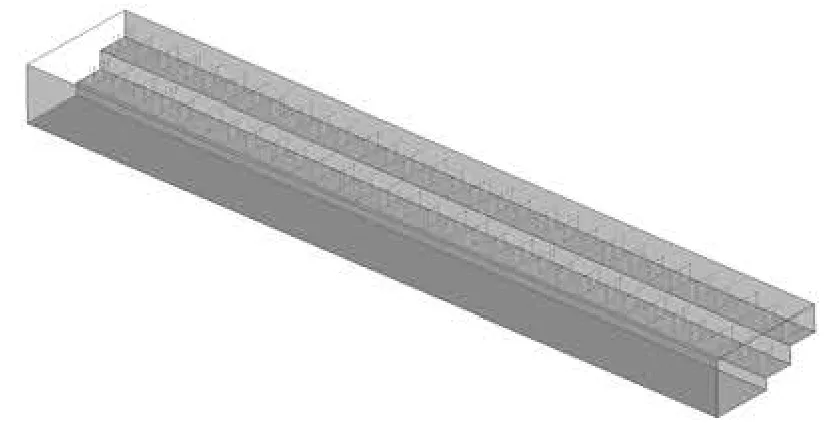
Fig.3 Schematic diagram of the computational model
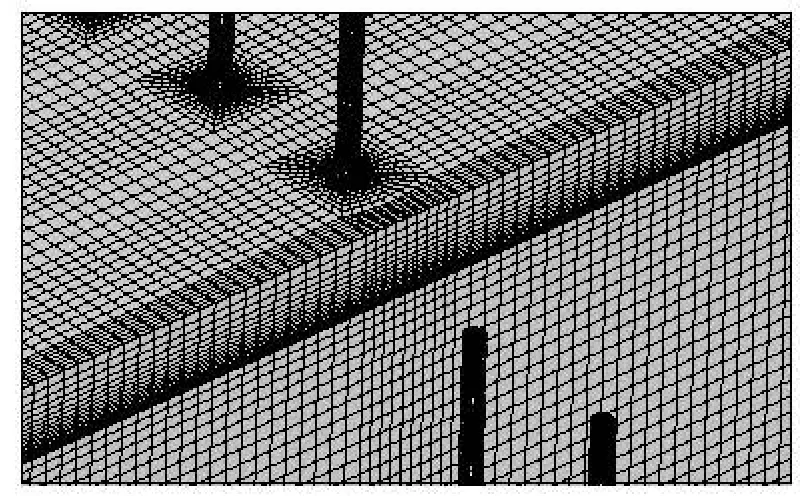
Fig.4 Schematic diagram of the mesh around the vegetation
Equations (1) and (2) are discretized using the finite volume method and the structured mesh is used in the computational model. Figure 3 shows the computational domain. The cylindrical surface of the vegetation is simplified by using a 32-sided polygon, as shown in Fig.4, the smallest grid length is 5.9×10⁻⁴m. The total grid number is approximately 7.5×10⁶.
The volume of fluid method is used for the treatment of the free surface, and the mass flow inlet and pressure outlet conditions are used for the boundary conditions. The total length of the computational model is 7 m. The pressure outlet boundary condition is used for the air outlet. A standard wall function and the no-slip wall boundary conditions are used for the treatment of the solid walls, such as the channel bed and the cylinders.
In this study, the pressure-velocity coupling is achieved using the SIMPLE algorithm. The body force weighting is used for the discretized pressure. For the momentum, the turbulence kinetic energy, and the turbulence dissipation, the Third-Order MUSCL scheme is used. The typical values of the under-relaxation factors used in the study are 0.3 for the pressure, 0.7 for the velocities, and 0.8 for other turbulence quantities. The convergence is reached when the residuals are less than 10-5for all equations.
The cases studied are based on experimental arrangements[13]. The computational domain is the vegetation zone in the center of the flume. The flow rate, the water level, and the vegetation arrangement are the same as in the test. The spatially averaged quantities are calculated on various planes, parallel to the channel bed.
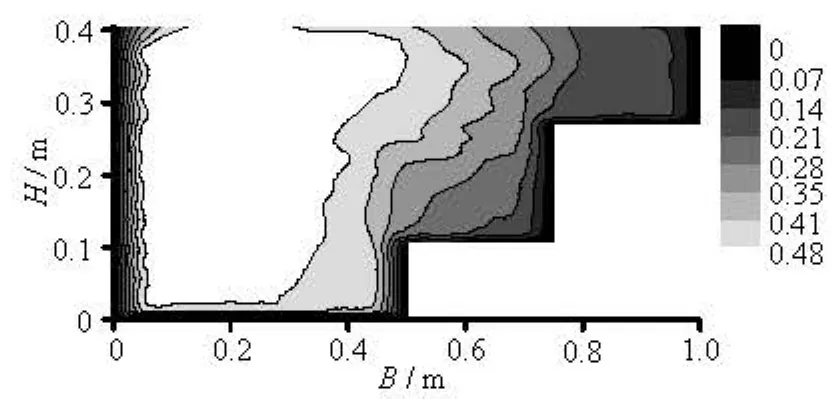
Fig.5 Mainstream velocity contours from the test (m/s)
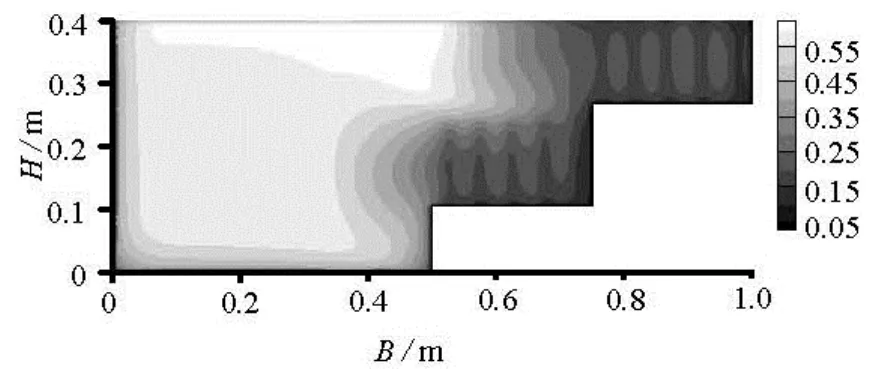
Fig.6 Mainstream velocity contours from the computation (m/s)
2. Analyses of the results
2.1Mainstream velocity distribution
Figures 5 and 6 show the mainstream velocitydistribution. In these figures, the velocities are normalized by the friction velocityU*. It can be seen that owing to the presence of the vegetation, the hindering effect on the velocity in the first and second terraces is significant. The velocity difference between the second terraces and the main river channel is clearly seen, and a clear deceleration zone can be seen around the vegetation on the first terrace. The flow velocity decreases from the main river channel to the second terrace, reaching a relatively small value inside the vegetation on both terraces. In the experiment, the maximum velocity takes near the left-side wall a value of 0.55 m/s. The flow velocity on the second terrace is less than 0.25 m/s. The calculated velocity distribution is more uniform; the maximum velocity is about 0.53 m/s, and less than 0.3 m/s on the second terrace. The calculated flow velocity on the first terrace above the vegetation is slightly greater than that of the tested data.
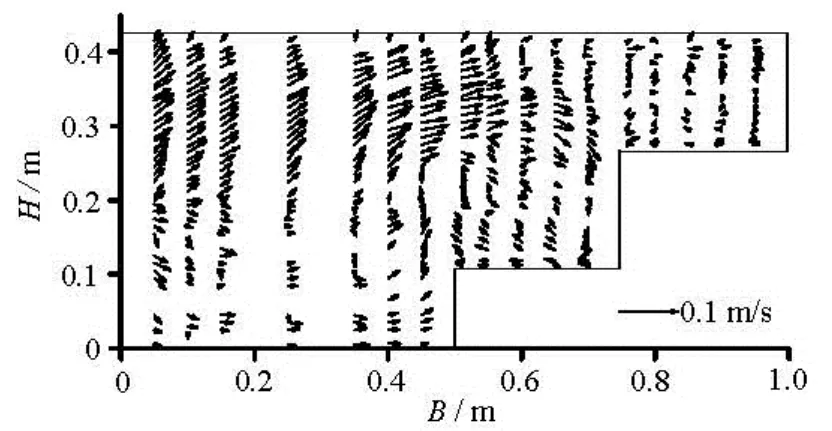
Fig.7 Tested secondary flow distribution
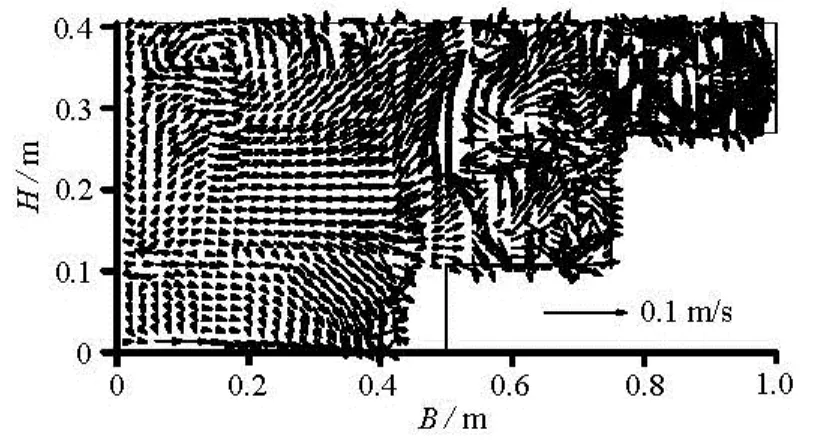
Fig.8 Calculated secondary flow distribution
2.2Secondary flow distribution
Figures 7 and 8 show the distribution of the secondary flow in the test and by the calculation. The test results show that a clockwise low-intensity secondary flow exists on the second terrace. There is a large circulation at the top of the first terrace vegetation region and the main river junction. Significant momentum is transported from the main channel to the first terrace. Under the hindering effect of the vegetation on the second terrace, the secondary current cannot reach the inside of the second terrace, and therefore, the flow descends along the slope of the second terrace, forming a clockwise secondary flow on the top of the vegetation on the first terrace.
Similar distributions can be seen in the calculated results. A counterclockwise secondary flow appears in the junction between the main channel and the vegetation on the first terrace. There is a counter-clockwise secondary flow at the top of the main channel near the left-side wall. Under its effect, the contour of the mainstream velocity budges towards the side wall, as can be seen in Fig.6.
The hindering effect of the vegetation on the terraces breaks down the large-scale vortex into smaller scale vortices. The high-energy vortex transfers momentum to the terraces. The intensity of the secondary flow on the first terrace is significantly greater than that on the second terrace, which indicates that the momentum exchange occurs mainly on the first terrace. The Reynolds stress distribution also indicates that the shear stress in this region is relatively high.
The maximum value of the secondary flow velocity in the test results is about 0.025 m/s, which is about 4% of the mainstream flow velocity. The calculated maximum value of the secondary flow is 0.022 m/s, which is about 3% of the mainstream flow velocity, slightly smaller than the experimental values.
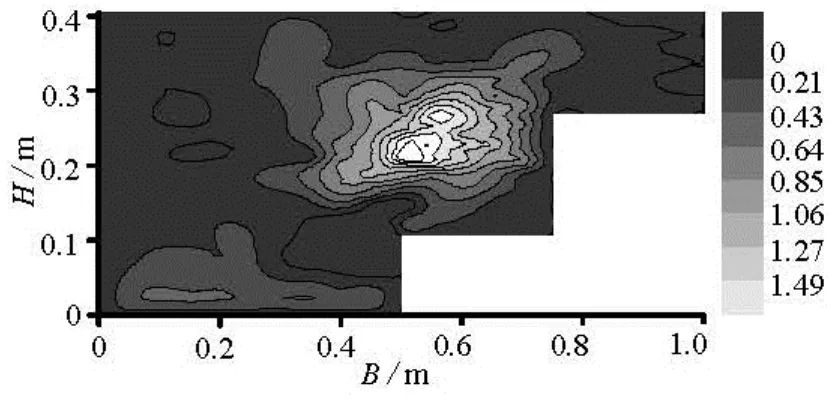
Fig.9 Tested Reynolds stressτcontours (Pa)
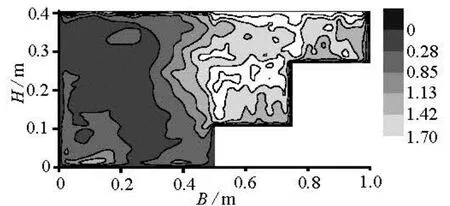
Fig.10 Calculated Reynolds stressτcontours (Pa)
2.3Reynolds stress distribution
The tested Reynolds stress distribution is shown in Fig.9 and the calculated results are in Fig.10. It can be seen in both figures that the peak value of the Reynolds stress appears at the top of the vegetation on the first terrace, near the main river channel, where a significant momentum exchange occurs. In the main river channel, because there is no vegetation, the Reynolds stress near the wall is larger than that in the mainstream flow.
The calculated value of the Reynolds stress is relatively large at the surface of the water, especially near the second terrace. This is due to the fact that thevegetation on the second terraces is non-submerged, i.e., the pressure and the velocity difference generated by the flow around such a cylinder produces a large shear stress. This result is similar to the experimental results obtained by Nezu and Sanjou[17]. The calculated pattern of the surface water flow is shown in Fig.11.
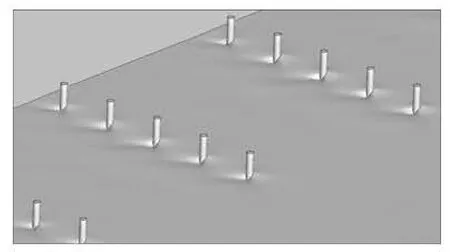
Fig.11 Calculated free-surface flow pattern
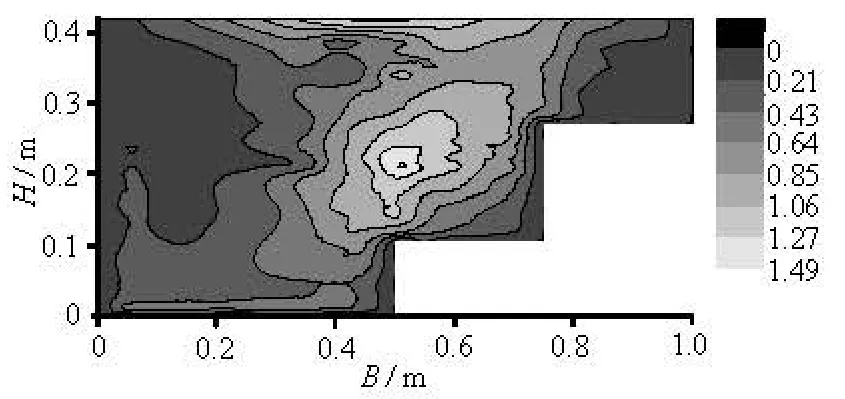
Fig.12 Tested turbulent energy contours (m2/s2)
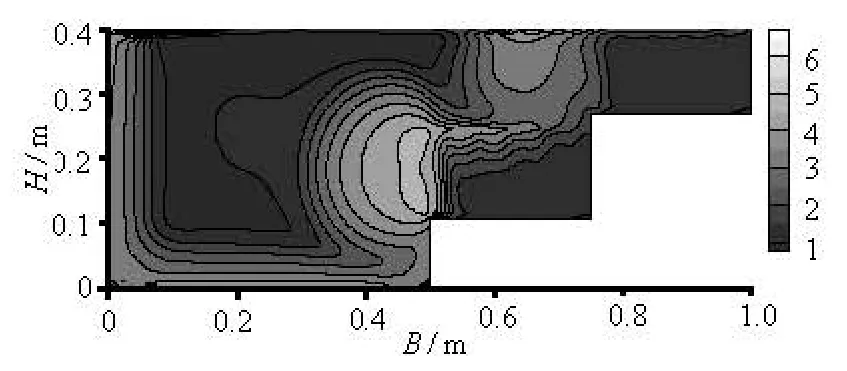
Fig.13 Calculated turbulent energy contours (m2/s2)
2.4Turbulent energy distribution
Figures 12 and 13 show the distribution of the turbulent energy in the test and by the calculation, respectively. It is clear that there is a large magnitude turbulent energy in the middle region of the compound channel and the turbulent energy takes smaller magnitudes near the left-side wall. The maximum turbulent energy appears at the junction of the main channel and the vegetation on the first terrace. The turbulent energy in the main channel and on the second stage are relatively small, mainly because in the main channel the velocity has a high magnitude but a small gradient. The turbulent energy on the second terrace is small because both the velocity and the velocity gradient are small. There is a significant increase of the turbulent energy at the interface of the vegetation and surrounding flow. The maximum value of the turbulent energy appears at the top of the vegetation on the first terrace near the main channel position, which indicates the place where there is a high shear velocity gradient.
2.5Bed shear stress
The boundary shear stress distribution can be influenced by many factors, such as the vegetation density, the cross-sectional shape, and the water depth[18,19]. The presence of vegetation can effectively reduce the flow velocity through the resistance it generates. The interface of the vegetation and the flow can absorb large amounts of momentum, thereby reducing the bed shear stress. Thus, the presence of vegetation can effectively reduce the flow velocity, prompting sedimentation, and reducing erosion.

Fig.14 Distribution of bed shear stress
Figure 14 shows the variation of the bed shear stress along the bottom of the river. In the main channel, because there is no vegetation, the bed shear stress increases gradually from the main channel to the terraces, and then drops sharply at the slope interface. The main channel bed shear stress is much larger than that of the first and secondary terraces. The bed shear stress on the first terrace is large near the main river channel, and then decreases sharply inside the vegetation region, where it is stabilized in the internal area of the vegetation. The bed shear stress is greater between two rods than behind a rod.
3. Conclusions
With the use of an RNGk-εturbulence model and the adoption of the double-averaging method, the turbulence characteristics of flow through a vegetated multi-stage compound channel are analyzed, and the calculated data are compared with laboratory measurements using ADV techniques. The main findings are:
(1) The double-averaging method can effectively predict the flow characteristics, such as the mainstream velocity and the Reynolds stress distribution. The secondary flow in the multi-stage compound channel is well captured by the RNGk-εturbulent model.
(2) In the two-stage compound channel, the maximum values of the Reynolds stress and the turbulent energy appear in the vegetation on the first stage.
(3) A counterclockwise circulation of the secondary flow can be seen in the main channel near the first terrace, the presence of which indicates a momentum exchange. The magnitude of the secondary flow in the test is slightly larger than that calculated.
(4) The bed shear stress results show that shear stress at the bottom of the main channel is larger than that on the vegetated terraces. There is no significant difference in the bed shear stress between the first and the second terraces. The presence of vegetation can effectively reduce the shear stress near the riverbed, achieving the effects of siltation and reducing erosion.
[1] ABRIL J. B., KNIGHT D. W. Stage-discharge prediction for rivers in flood applying a depth-averaged model[J].Journal of Hydraulic Research,2004, 42(6): 616-629.
[2] WU W., HE Z. Effects of vegetation on flow conveyance and sediment transport capacity[J].International Journal of Sediment Research,2009, 24(3): 247-259.
[3] ABERNETHY B., RUTHERFURD I. D. The distribution and strength of riparian tree roots in relation to riverbank reinforcement[J].Hydrological Processes,2001, 15(1): 63-79.
[4] WU W., SHIELDS F. D. and BENNETT S. J. et al. A depth-averaged two-dimensional model for flow, sediment transport, and bed topography in curved channels with riparian vegetation[J].Water Resources Research,2005, 41(3): 1-15.
[5] WU W., MARSOOLI R. A depth-averaged 2D shallow water model for breaking and non-breaking long waves affected by rigid vegetation[J].Journal of Hydraulic Research,2012, 50(6): 558-575.
[6] RAMESHWARAN P., SHIONO K. Quasi two-dimensional model for straight overbank flows through emergent[J].Journal of Hydraulic Research,2007, 45(3): 302-315.
[7] HAMIDIFAR H., OMID M. H. Floodplain vegetation contribution to velocity distribution in compound channels[J].Journal of Civil Engineering and Urbanism,2013, 3(6): 357-361.
[8] CHEN Gang, HUAI Wen-xin and HAN Jie et al. Flow structure in partially vegetated rectangular channels[J].Journal of Hydrodynamics,2010, 22(4): 590-597.
[9] WU W., ZHANG M. and OZEREN Y. et al. Analysis of vegetation effect on waves using a vertical 2D RANS model[J].Journal of Coastal Research,2012, 29(2): 383-397.
[10] SOULIOTIS D., PRINOS P. Effect of a vegetation patch on turbulent channel flow[J].Journal of Hydraulic Research,2011, 49(2): 157-167.
[11] ELGHANDURI N. E. CFD analysis for turbulent flow within and over a permeable bed[J].American Journal of Fluid Dynamics,2012, 2(5): 78-88.
[12] PRINOS P., SOFIALIDIS D. and KERAMARIS E. Turbulent flow over and within a porous bed[J].Journal of Hydraulic Engineering, ASCE,2003, 129(9): 720-733.
[13] WANG Wen, HUAI Wen-xin and ZENG Yu-hong. Experimental study on the flow characteristics of multistage compound channel with vegetation on its floodplains[J].Journal of Huazhong University of Science and Technology (Nature Science Edition),2013, 41(10): 128-132(in Chinese).
[14] NIKORA V., MCEWAN I. and MCLEAN S. et al. Double-averaging concept for rough-bed open-channel and overland flows: Theoretical background[J].Journal of Hydraulic Engineering, ASCE,2007, 133(8): 873-883.
[15] FINNIGAN J. Turbulence in plant canopies[J].Annual Review of Fluid Mechanics,2000, 32(1): 519-571.
[16] HUAI Wen-xin, LI Cheng-guang, ZENG Yu-hong et al. Curved open channel flow on vegetation roughened inner bank[J].Journal of Hydrodynamics,2012, 24(1): 124-129.
[17] NEZU I., SANJOU M. Turburence structure and coherent motion in vegetated canopy open-channel flows[J].Journal of Hydro-Environment Research,2008, 2(2): 62-90.
[18] NEZU I., ONITSUKA K. Turbulent structures in partly vegetated open-channel flows with LDA and PIV measurements[J].Journal of Hydraulic Research,2001, 39(6): 629-642.
[19] CRAWLEY D. M., NICKLING W. G. Drag partition for regularly-arrayed rough surfaces[J].Boundary-Layer Meteorology,2003, 107(2): 445-468.
10.1016/S1001-6058(14)60053-6
* Project supported by the National Natural Science Foundation of China (Grant No. 11372232), the Specialized Research Fund for the Doctoral Program of Higher Education (Grant No. 20130141110016) and the State Water Pollution Control and Management of Major Special Science and Technology (Grant No. 2012ZX07205-005-03).
Biography: WANG Wen (1986-), Male, Ph. D. Candidate
HUAI Wen-xin,
E-mail: wxhuai@whu.edu.cn
杂志排行

水动力学研究与进展 B辑的其它文章
- Numerical simulation of landslide-generated impulse wave*
- A random walk simulation of scalar mixing in flows through submerged vegetations*
- Scaling of maximum probability density function of velocity increments in turbulent Rayleigh-Bénard convection*
- Dispersion in oscillatory electro-osmotic flow through a parallel-plate channel with kinetic sorptive exchange at walls*
- Evaluation of the use of surrogateLaminaria digitatain eco-hydraulic laboratory experiments*
- A numerical study on dispersion of particles from the surface of a circular cylinder placed in a gas flow using discrete vortex method*