Responses of thermal structure and vertical dynamic structure of South China Sea to Typhoon Chanchu*
2014-06-01CHENYizhan陈宜展ZHANJiemin詹杰民LUOYingying罗莹莹
CHEN Yi-zhan (陈宜展), ZHAN Jie-min (詹杰民), LUO Ying-ying (罗莹莹)
Department of Applied Mechanics and Engineering, Sun Yat-sen University, Guangzhou 510275, China,
E-mail: chenyzh8@mail2.sysu.edu.cn
WAI Onyx W. H. (韦永康)
Department of Civil and Environmental Engineering, The Hong Kong Polytechnic University, Hong Kong, China TANG Ling (唐灵)
Department of Applied Mechanics and Engineering, Sun Yat-sen University, Guangzhou 510275, China
Responses of thermal structure and vertical dynamic structure of South China Sea to Typhoon Chanchu*
CHEN Yi-zhan (陈宜展), ZHAN Jie-min (詹杰民), LUO Ying-ying (罗莹莹)
Department of Applied Mechanics and Engineering, Sun Yat-sen University, Guangzhou 510275, China,
E-mail: chenyzh8@mail2.sysu.edu.cn
WAI Onyx W. H. (韦永康)
Department of Civil and Environmental Engineering, The Hong Kong Polytechnic University, Hong Kong, China TANG Ling (唐灵)
Department of Applied Mechanics and Engineering, Sun Yat-sen University, Guangzhou 510275, China
(Received December 26, 2013, Revised March 15, 2014)
The response of the South China Sea (SCS) to Typhoon Chanchu (2006) was examined using the MM5 and POM model. In the POM model, sea surface boundary conditions were forced by the simulation wind field from MM5, the velocity forcing was introduced in the eastern boundary and the computational schemes of heat fluxes at the surface were introduced. Comparison with the observation data shows that the simulated results are reliable. In the response process of the SCS to Typhoon Chanchu, the influence of the heat fluxes on thermal structure of the SCS was regionally different. Strong wind forcing would lead to upwelling phenomenon in the lateral boundary of deep water basin. Furthermore, the Ekman pumping theory was used to discuss subsurface upwelling and downwelling phenomenon in typhoon forced stage.
South China Sea (SCS), typhoon, thermal structure, vertical dynamic structure, Mesoscale Model 5 (MM5), princeton ocean model (POM)
Introduction
Typhoon is one of the most powerful mutant weather processes in the ocean, which results in great exchange of heat, energy and material between air and sea. The response of the ocean to typhoon has long been a focus for concern. At present, observation and numerical simulation are the most widely used methods for the research on this topic. The results of the historical observations show that sea surface temperature (SST) decreased in the upper ocean and the maximal cooling area of SST appeared in the right bias of the typhoon track[1-3]. The data could be accidentallycollected from buoys during typhoon, which means that the temporal and spatial resolutions are not high enough to throw a light on the process. On the other hand, the satellite remote sensing data would probably be lack of large area of clear image due to cloud cover. With the development of the computer technology, numerical simulation becomes an important way to study this problem.
The mechanism of the ocean response to typhoon still needs further study. Particularly, more attention should be paid to the SST and loss of energy from the mixed layer. On the basis of strong wind velocity profile and nonlinear ocean mixed layer current, the response of SST has cooler water on the right, entrainment dominates the ocean mixed layer heat budget and is also significant in the mixed layer moment balance. Another important mechanism is that inertial rotation of the current induces convergence and divergence, and hence vertical motion (pumping) in mixed layer[4]. However, the ocean vertical velocity response to typhoon is not yet system analysis. In recent years,the ocean response process to typhoon in the South China Sea (SCS) has been the burgeoning studies[1,5]. The SCS is an activity typhoon area in the western Pacific, which have been integrated the dynamic analysis of heat budget in the upper ocean. In this paper, we will focus on the thermal structure and vertical dynamic structure in the SCS response process.
第三,旅游危机事件网络舆情本身在传播的各个阶段表现出不同的特点。旅游危机事件必须在不计其数的信息中“脱颖而出”,方能获取公众的广泛关注。潜伏期的舆情本体通常是对旅游危机事件的始末进行描述,这一阶段的舆情本体主要表现出信息酝酿的特点;爆发期的旅游危机事件网络舆情已经成功进入舆论场,并迅速吸引了大量的公众关注,这一阶段的舆情本体主要表现出信息扩散的特点;成熟期旅游危机事件的相关信息已经大范围扩散,公众关注点开始转移,这一阶段的舆情本体主要表现出舆论集聚的特点;平息期公众对事件关注热度降低,参与各方逐步退出网络舆论场域,这一阶段的舆情本体主要表现出舆情消散的特点。
The Mesoscale Model 5 (MM5) and princeton ocean model (POM) have been adopted to calculate the SCS response to Typhoon Chanchu (2006) and monthly mean climatic forcing. In this study, we pay attention to the effects of heat flux on SST, water flow in the deep basin lateral boundary, and upwelling (downwelling) phenomenon in the upper SCS.
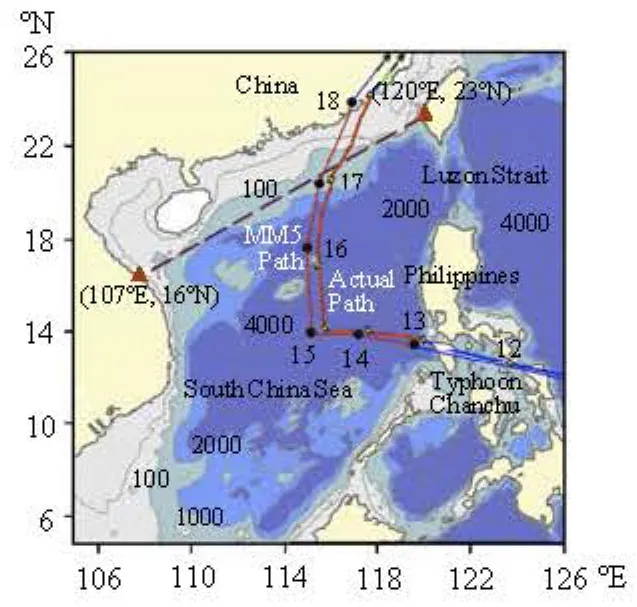
Fig.1 Track of Typhoon Chanchu in the SCS
1. Typhoon Chanchu
清政府第一次鸦片战争战败后,西方列强从协定关税开始,参与清政府海关税则的制定。继而以维护对外贸易秩序为借口,借助上海小刀会起义导致江海关瘫痪的契机,强行成立英、法、美三国关税管理委员会,取得江海关关税的征收权,逐步形成了外籍税务司制度。外籍税务司制度不仅保障了不平等条约下所要求的税收收入,并且还有效防止了贪污腐败,所以它被中国政府所接纳,从而使外籍税务司制度在中国推广开来。这样,以英国为首的西方列强攫取了中国关税的征收权。
2. Model description
Then, the net heat flux is given as
2.1Simulation of Typhoon Chanchu with MM5
The atmospheric model MM5(version V3) was developed by the National Center for Atmospheric Research (NCAR) at the Pennsylvania State University, details of which have been outlined by Tang et al.[3]30 s resolution global terrain data and 35 sigma levels in the vertical direction were used in MM5. The resolution of DOMAIN1 was 40.5 km, and the DOMAIN2 was 13.5 km. The NCEP data assimilation analysis of Newtonian relaxation was adopted in the surface and upper air in this simulation. Relaxation program was used as boundary conditions.
2.2Equilibrium mode in POM
The POM is a 2.0 turbulence closure model, in which the topography is smoothed by the following equation
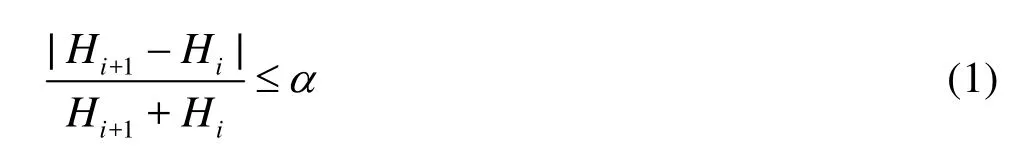
whereH1andHi+1are depths in the neighboring grids, andαis a smoothing factor with a value of 0.4.
In this study, the POM domain covered all the SCS area between 98oE to 126oE, 3oS to 26oN with a 15 km horizontal resolution, and were divided into 50 sigma levels in the vertical scheme with a higher resolution in the upper layer. The model bottom topography was constructed from ETOPO 5'5'× geophysical data. The model could treat the cases with the minimum depth of 10m and the maximum depth of 4 000 m, respectively. The involved eastern boundary condition was open from 12oN to 26oN and forced with the flow field data calculated by Zhan and Yan[6], and other boundaries were closed. For initial conditions, the monthly Levitus sea temperature data and themonthly DASILVA wind field data were used. For calculating instant heat flux to force sea surface thermal variation, the correlative formulas will be discussed in the following sections.
2.3Response process of the SCS to Typhoon Chanchu by POM
术前准备:备好负压吸引器、氧气、气管插管等抢救用品及药物。患者术前需要排空膀胱,护士要给予指导,准备完成后进入取卵室,核对患者信息,确认签字无误,这部分工作由三方人员完成,巡回护士、手术医师及实验室人员,之后即进入手术过程。
花鸟画最早可以追溯到原始社会时期,发展至两汉时期,花鸟画已经初具雏形。东晋画家谢赫凭借其作品《画品》成为中国绘画史上第一位有迹可循的花鸟画家。随着唐朝,宋朝的国家经济发展日趋繁荣,国泰民安,在艺术文化领域夜呈现一派欣欣向荣的景象,花鸟画在这一时期也渐渐发展成熟。元朝时期出现了一些以“水墨梅竹”为主要绘画对象的画家。明朝则是以徐渭和陈道复的花鸟作品见著,清代则是出现了笔墨独具风格的画家,如“八大山人”等。发展至现代,花鸟画在绘画领域的总体发展平平,但是不可否认的是,在花鸟画的不同风格都各有成者,他们为花鸟画的未来发展注入了新的力量。
In order to more clearly reflect the dynamic structure of the ocean, we examine the interception horizontal section geiven as the following formula in the model
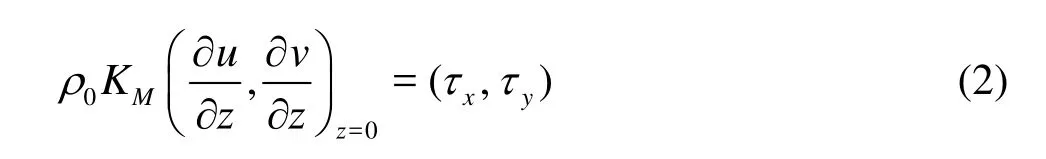
whereKMis the vertical turbulent viscosity[7], andxτandyτare the tensor components of sea surface wind stress.
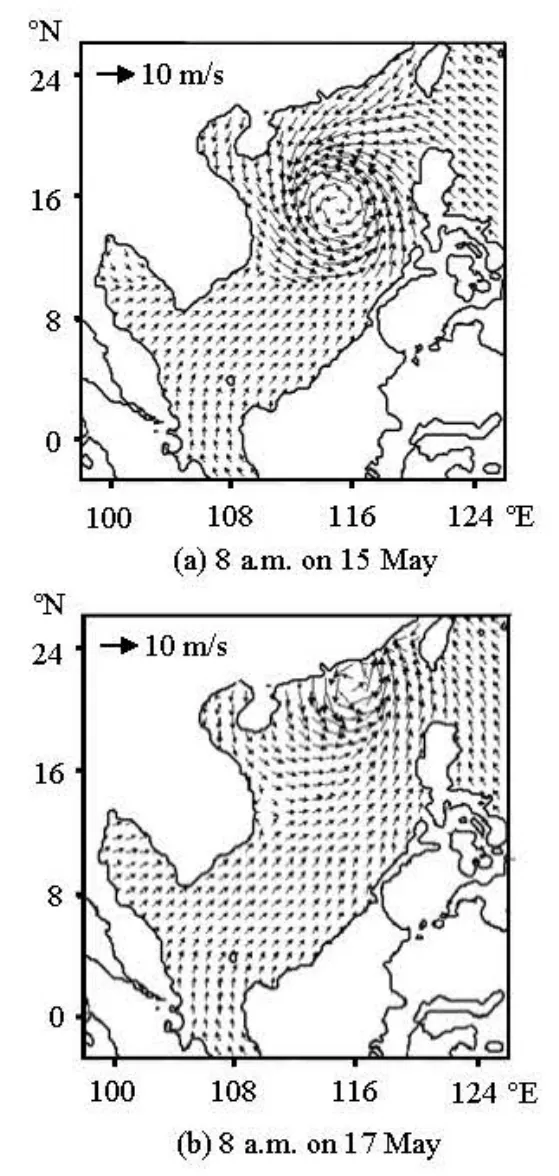
Fig.2 Simulated sea surface wind field in MM5. The typhoon center can be clearly seen in the pictures
Through comparing sea surface current results of typhoon conditions (Figs.2-3), it was found that the currents had larger sea surface velocity on the right side of the Typhoon Chanchu’s track, that is to say, the response process had an asymmetric bias to the right, which is consistent with Price’s opinion[4]. During the typhoon period, the internal water flew northeast through the Luzon Strait to the western Pacific from the SCS, and the water exchange in the Luzon Strait was significantly strengthened.
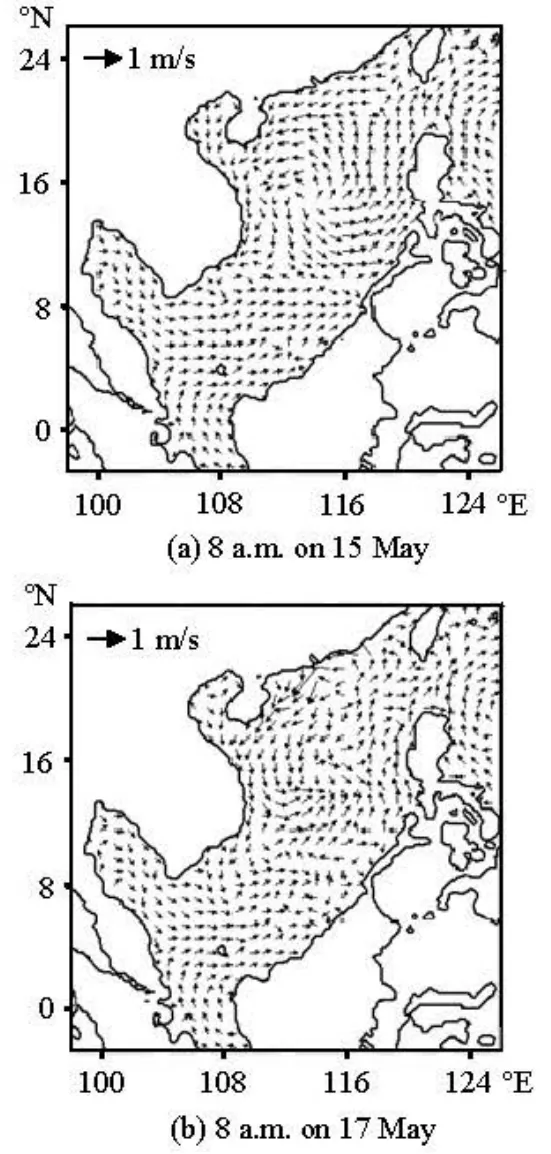
Fig.3 Simulated sea surface current field in POM
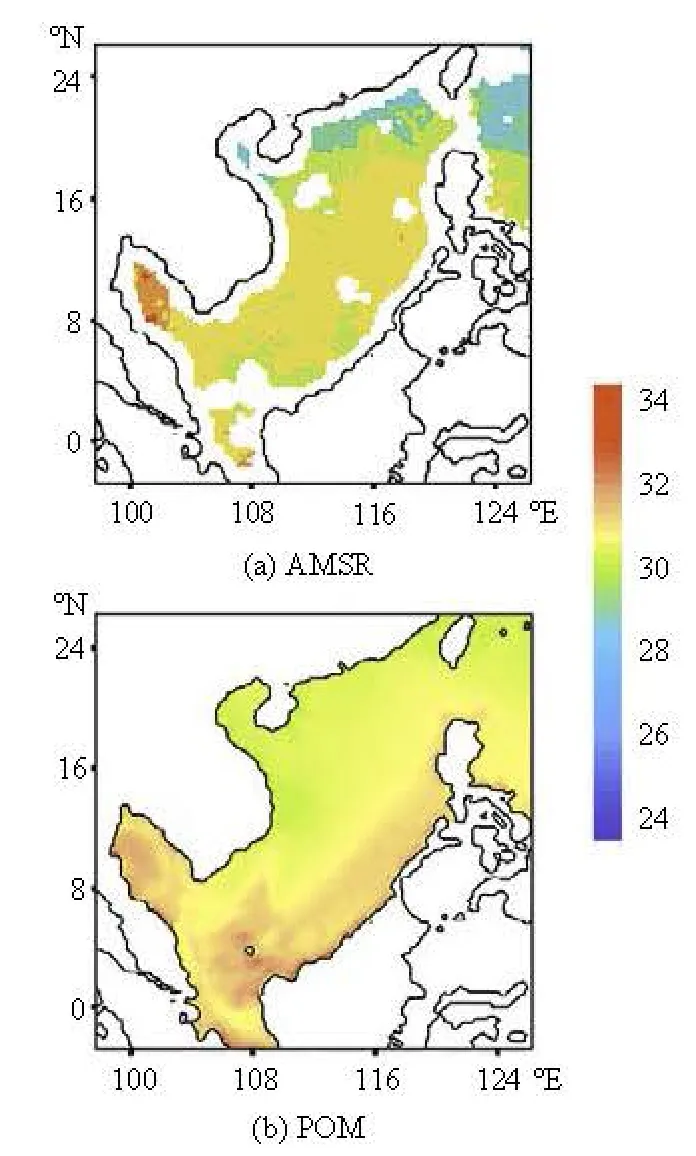
Fig.4 Comparison between the SST from AMSR remote sensing data and POM simulation results on 11 May 2006 (before Typhoon Chanchu)
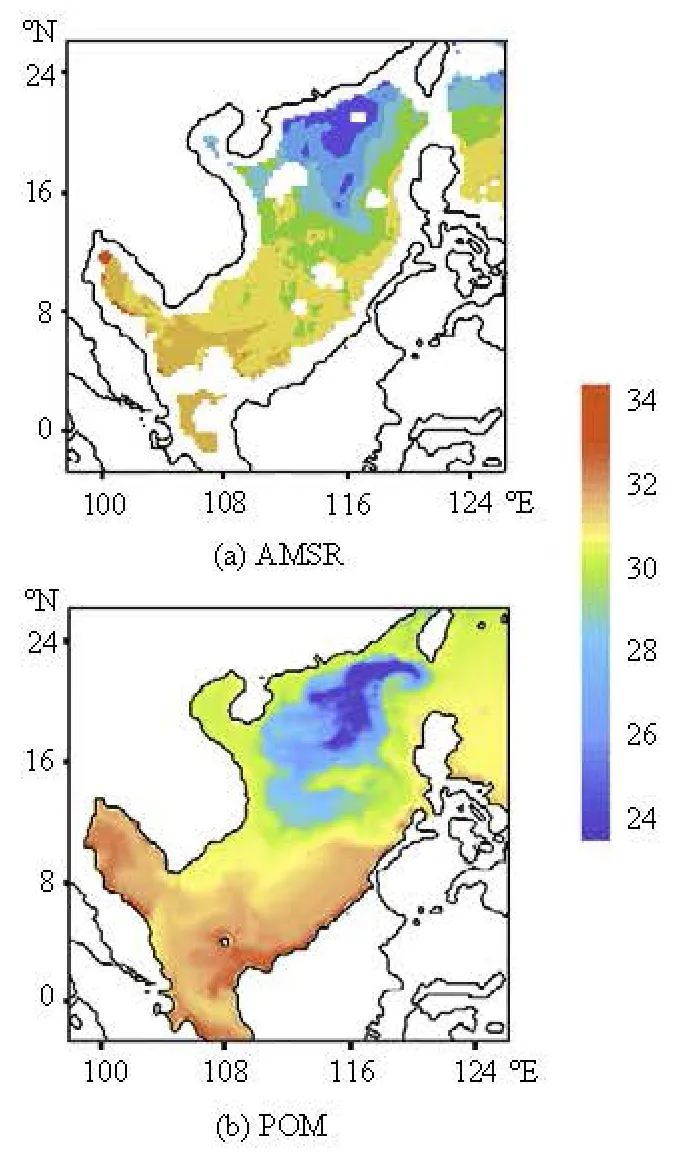
Fig.5 Comparison between the SST from AMSR remote sensing data and POM simulation results on 20 May 2006 (after Typhoon Chanchu)
3. Case validation
The calculated SST is validated with the AMSR remote sensing data (NASR, http://wwwghcc.msfc. nasa.gov/AMSR). The AMSR data appears to be data absence during typhoon, thus we took those before (11 May) and after (20 May) Typhoon Chanchu’s SST for contrast and comparison. As are shown in Figs.4-5, the calculated SST results are consistent with the AMSR SST data in spatial distribution, and the POM’s SST is cooler than the AMSRs. Furthermore, the simulated SST has right-hand bias, which agrees with the former conclusions[8]. Another comparison is that there is a heating process in the southern SCS, so we can believe the simulated results are credible. In the last section, the simulated sea surface current results have been compared with the observed theory (see Figs.2-3).
4. Results and discussion
4.1Heat flux effect to SST
围绕学校应用型人才培养目标,通过把教学内容(使用Dreamweaver软件制作网页)、教学软件(Dreamweaver)、教学网站(包含课件、大纲、案例、项目等内容)等常规分离的教学项目合并到教师团队构建的真实的网络学习平台中,精选教学内容,改进教学方法,实现学校人才培养目标与学生的能力培养的统一,把知识学习与能力培养始终贯穿在真实的网络学习平台中,实现课堂内外学习环境的统一,促进学生继续深入学习相关知识.详见图1.
The heat flux under the influence of the typhoon has the characteristics of large spatial and temporal differences. In this paper, we use the heat flux attn-1to calculate that attn, thus the model can give prominence to the SST characters which are under the influence of heat flux. The heat flux can be constructed by the following equations:

Here, the shortwave radiationQsand the longwave radiationQlare calculated according to Bignami and Hopkins[9]QhandQeare respectively the sensible heat flux and the latent heat flux.I0is the solar radiation flux,Cis the total cloud amount,sαis the albedo of sea surface,εis the sea surface emissivity,σSBis the Stefan-Boltzmann constant,λis a blocking factor to account for occulted clouds,eis the vapor pressure,ρis the air density,CPis the specific heat of air,LPis the latent heat of evaporation of seawater,qsis the sea surface saturation specific humidity, andqAis the specific humidity. The sensible heat transfer coefficientCHand the latent heat transfer coefficientCEare given by Drennan et al.[10]andWis the wind velocity.
In this paper, we focus on the SCS thermal and dynamic structures generated by the typhoon, which has a close relation to the turbulent mixing. With excellent capabilities of simulating weather phenomena, the MM5 can provide high resolution dynamic coordination data and be propitious to study the complex physical mechanism. The POM is a three-dimensional baroclinic ocean model with 2.5-order turbulence closure sub-model, thus the vertical eddy diffusivity result can reduce human factors due to the vertical distribution pre-setting.
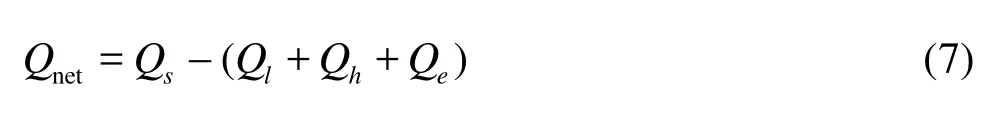
The net heat flux added to the POM model is
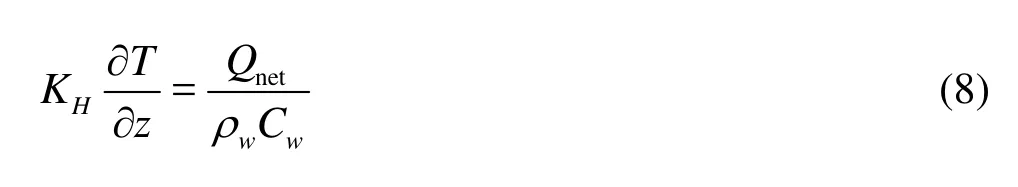
whereKHis the vertical diffusion coefficient, andCwis the specific heat of seawater.
In this paper, MM5 and POM have been employed to simulate the response process of SCS thermal structure and vertical dynamic structure under the influence of Typhoon Chanchu in May, 2006. We focus on the signature in SST of heat flux and the associated vertical water flow, and the main conclusions can be summarized as follow:
而上面的分析也提到过,有些时候,在现代汉语“让”字句中,动作者有时被省略。此时虽然含义上没有什么变化且在英语小句中不是很常见,但是在现代汉语的小句中还是较为常见的。例如:
The POM motion equation was transformed to Cartesian vertical velocity equation as followwhereωis surface velocity component in Sigma
To compare with the SST on the 11th of May before typhoon, the maximum SST difference was about -7oC. In the domains under Typhoon Chanchu’s influence, the SST was on average changing 0.2oC caused by the heat flux term.
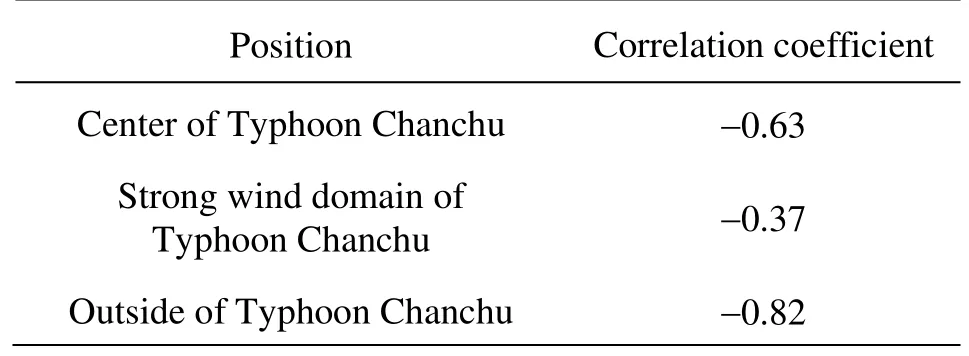
Table 1 Comparison of Correlation betwen SST and net heat flux
Taking interval 6 h heat flux and SST calculated results from 11th to 18th of May for correlation analysis, and considering different typhoon impact domains to be an average research, as shown in Table 1, we found that the domain with greater cooling magnitude water had lower correlation coefficient, and the influence of heat flux to ocean during typhoon had significant local differences.
岩土工程勘察设计和施工过程中的水文地质问题分析………………………………………………………… 张衎(10-87)
4.2Response of deep water basin vertical dynamic st
ructure
Previous studies have indicated the SST development mechanism during typhoon[11,12]. The prevailing view is that typhoon wind stress can cause strong vertical mixing in the upper ocean, the cold water in the mixed layer can be brought to sea surface by entrainment and pumping with the effect of shear velocity, which is the main reason for the decrease in SST.
SCS is the largest marginal sea in the world, also it is one of the few semi-enclosed deep water basins, which topography is steep in the continental shelf. In recent years, several authors[12,13]have already researched the response mechanism in the upper SCS, but these papers did not involve the response mechanism in deep water basin, so we will analyze deep water response process by numerical analysis.
由于档案本身没有特征信息,首先需要对档案数据进行处理,从每一个档案中提取对应的特征数据,映射到对应的特征视图中。不同类型的档案数据需要采用不同的特征提取方法,除了传统的人工著录整理之外,还包括OCR文字识别、语义分析、视频内容提取等技术。本文不深入研究档案实体的特征提取技术。所采用的实验样本均为经过人工著录,已经包含所需要特征项的档案样本。
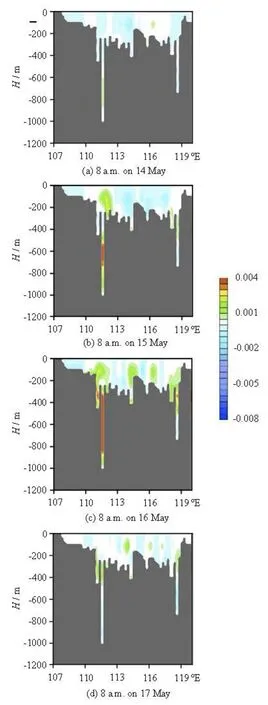
Fig.6 Vertical velocity (m/s) between (107oE, 16oN) and (120oE, 23oN) to research the vertical water flow of SCS basin boundary with time
On the 16th of May, the maximal net heat flux reached 1.1 kW/m2, and the calculated results were similar to the observation of Typhoon Lily[8]. It is obvious that the strong wind and the air-sea temperature difference are critical to large heat flux values (see Eqs.(3)-(7)). When Typhoon Chanchu initially came into SCS, the net heat flux was negative, SST was cooling, the typhoon intensity was strengthened and the maximum wind velocity increased to 45 m/s from 33 m/s. On the 16th of May, the net heat flux was positive, which restrained the SST cooling, and the typhoon intensity tended to be stable. That is to say, in strong wind velocity domain, the net heat flux transport direction depends on the air-sea temperature difference and had a direct relationship to typhoon intensity.
The POM is a three-dimensional primitive equation model. It takes the Boussinesq approximation and computes fluid motion from the Navier-Stocks equations. In the model,σcoordinate is used as the vertical coordinate, and bottom topography and sea surface undulation are considered. Explicit difference scheme and implicit difference scheme are used in the horizontal and vertical time differences, respectively. The latter can eliminate the time limitation to vertical coordinate, so the higher resolution can be reached at the surface and at the bottom.
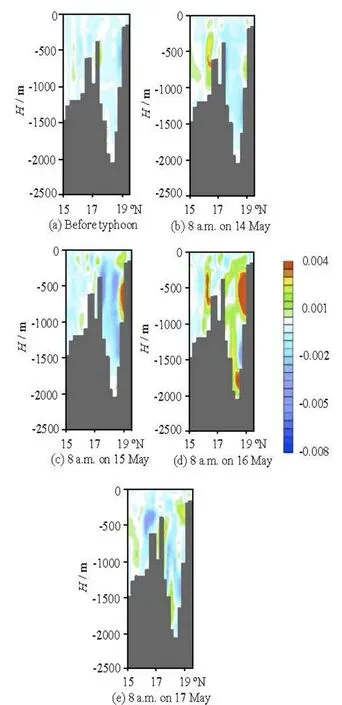
Fig.7 Vertical velocity distribution (m/s) in SCS basin boundary along 111.5ºE. Compared with the results (Fig.6) at different times produced by POM, the vertical water movement of basin boundary was more obvious than that in open ocean
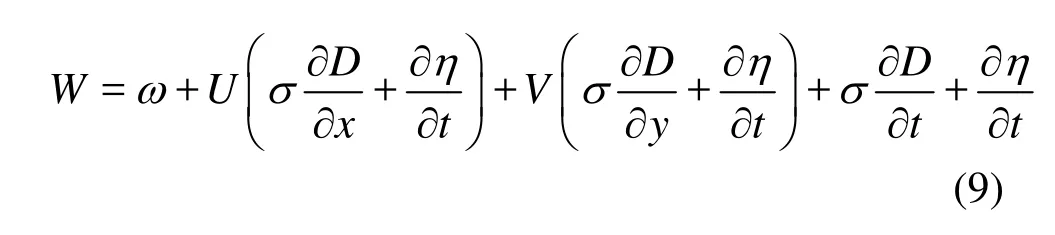
The vertical velocity is mainly affected by horizontal velocity, terrain and sea surface undulation (Eq.(9)). Another deduction from Eq.(9) is that the horizontal velocity increases during typhoon, and the sea surface undulation is also enhanced, therefore, vertical velocity changes distinctly. In northern SCS, the shelf is gentle but the continental margin is very steep and close with basin. We selected a connector between (107oE, 16oN) and (120oE, 23oN) to investigate the dynamic structure in the slope section of SCS (see Fig.1). For the vertical velocity on the 14th to 17th of May as shown in Fig.6, the large values of water flow appears in different depths with the phase changing with time. It was obvious that the current violent reaction to Typhoon Chanchu is due to the shear velocity in the mixed layer, and it produced significant vertical water flow when horizontal velocity was reversed. There was a noticeable upwelling phenomenon in the basin boundary at 111.5oE (see Fig.6).
In Fig.7, the maximum vertical water flow of SCS appearing in the steep basin boundary, which is consistent with Spall’s theory[11]. The relative vorticity, which is produced by vertical movement stretching in the interior basin, only can be consumed near the boundary with large lateral eddy viscosity. Typhoon Chanchu passed through the SCS basin from the 14th to the 17 th of May, the maximal depth was about 2 000 m affected by the local movement of boundary water, there was upwelling generated in the upper lateral boundary, while downwelling intensity increased at the bottom of the boundary. After the typhoon crossed the basin, the subsurface upwelling intensity significantly decreased. The upwelling of basin lateral boundary influenced by Typhoon Chanchu was 10 times greater than in the normal state. So we can reach a conclusion that with the effect of strong wind forcing, the momentum and the energy disturbances in the middle of the basin can cause upwelling in the narrow viscous boundaries.
4.3Response of thermal and dynamic structure in sea subsurface
In recent years, the response of thermal and dynamic structure in sea subsurface during typhoon attracted the attention of physical oceanography scholars[14-16]. According to the Ekman pumping theory, we get the relationship between wind stress and sea vertical velocity (positive for upwelling and negative for downwelling in Eq.(10))
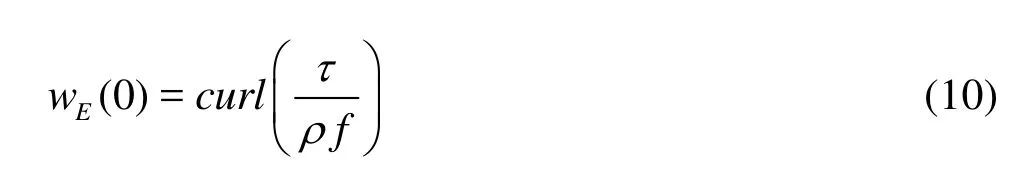
wherewE(0) is the sea surface vertical velocity,τthe wind stress,ρthe sea water density, andfthe Coriolis parameter. Therefore, under the influence of the northern hemisphere typhoon, counterclockwise vortices are formed in sea surface, and the upwelling is generated in the role of curl field at typhoon center.The mixed layer increases and SST decreases due to entrainment effect. Typhoon Chanchu was located in the center of SCS at 8 a.m. on May 15 through comparatively analyzing the vertical sections of calculated results as in Figs.8-10 (with the typhoon back section 12oN, typhoon center section 14.5oN and typhoon front section 17oN).
1.2.1 杆努尽烟水提液的制备 取杆努尽烟干样2 kg,用蒸馏水浸泡,并于90℃的电热恒温水箱中连续浸提12 h,收集并过滤浸提液,旋蒸后合并浸提液,浓缩至药物浓度2.5 kg/L(按生药量计),最后分装灭菌,置于4℃冰箱保存备用。
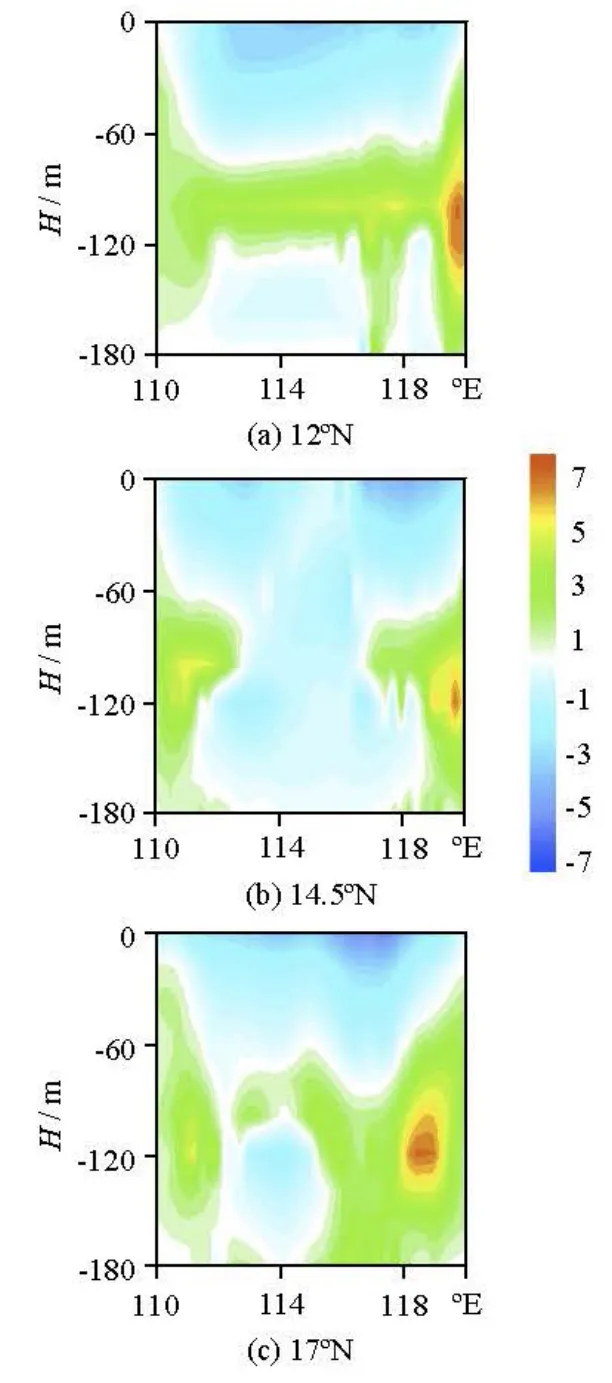
Fig.8 Change in temperature of the mixed layer at 8 a.m. on 15 May
The temperature difference of subsurface (Fig.8) was calculated for 8 a.m. on May 15 and 8 a.m. on May 11 (before typhoon), which was similar to Price’s observation distribution[4]. That is, with the effect of typhoon, sea surface water has low temperature and high salinity, while under-layer temperature rises. In the normal SCS condition, vertical flow magnitude is about 10-6m/s, which is very small compared with horizontal current. In the response process of SCS, subsurface vertical velocity increases 500 times. Typhoon Chanchu’s active domain in SCS was primary in the deep water region, and hence thermal structure and dynamic structure was little affected by terrain within 200 m depth, so it can distinctly reflect the subsurface response process. In the Typhoon Chanchu period, local sea water flowed spread from the center (Fig.9), upwelling and downwelling were staggered. That is due to the Ekman pumping phenomenon with a partial eddy structure under the geostrophic action.
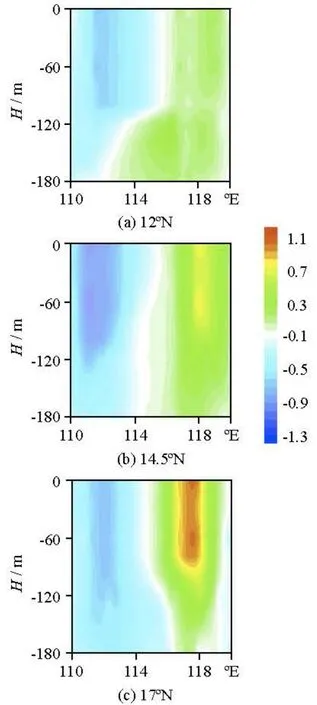
Fig.9 Change in horizontal velocity of the mixed layer (positive for east direction) at 8 a.m. on 15 May
POM was started from January, when it could steadily calculate and simulate sea conditions in May, the MM5’ 1 h wind and air temperature fields in May 2006 were induced as sea surface boundary condition to drive the ocean model. The POM wind stress is calculated from the following equation
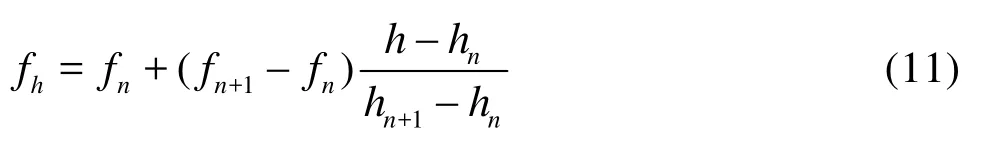
wherehn=Hσn(hn≤h<hn+1),σnis the sigma vertical stratification factor, andfis the physical variables.
As is shown in Fig.11, the vertical motion of water was relatively strong at the depth of 120 m. At this layer horizontal water flow had been significantly weakened compared with sea surface flow, so it was prone to generate shear velocity. At the forced stage of typhoon, downwelling was caused by convergence current at the edge of typhoon, while upwelling was caused by divergence current in the center of Typhoon Chanchu, however, the maximum vertical flow position was not consistent with the maximum wind stress position, which was influenced by the topography and the geostrophic current.
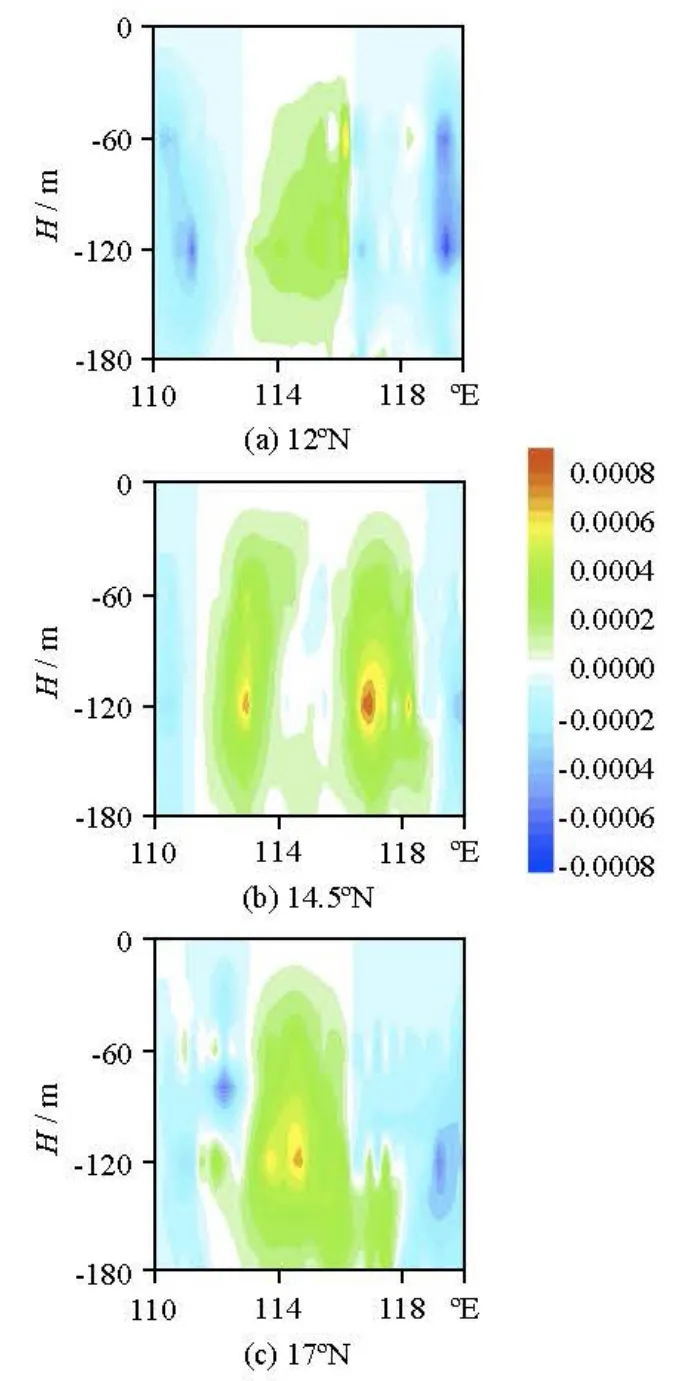
Fig.10 Change in Vertical velocity of the mixed layer at 8 a.m. on 15 May
5. Conclusions
According to COADS net heat flux data, the net heat flux of SCS is in the range of 100 W/m2-200 W/m2in May. Equation (8) is in the condition for the balance of the vertical heat flux transport and the non-adiabatic heating, without considering the local variation of temperature and horizontal advection conditions, and the SST rises in May (positive for the downward direction and negative for the upward direction in Eq.(8)). In simulation, Typhoon Chanchu’s wind velocity was taken as 45 m/s2at 8 a.m..
Typhoon Chanchu started as a tropical storm, forming 550 km southeast of the Mindanao Island of Philippines on 9 May, 2006. It was upgraded to a typhoon with maximal wind velocity of 33 m/s when moving into SCS along northwest direction at 8 a.m. on 13 May. Typhoon Chanchu’s wind speed exceeded 45 m/s and suddenly turning 90onorthward at 2 a.m. on 15 May as it approached the strong typhoon level, at last it made landfall at 2 a.m. on 18 May on Guangdong province in China. Typhoon Chanchu was a typical typhoon generated in La Nina years. It initially formed in the western Pacific, and was supplied ample energy by high temperature sea water when entering SCS. Thus, the typhoon had strong wind velocity and a wide affecting range. Figure 1 shows the running track and strength of Typhoon Chanchu. Contour line denotes isobaths in meters. The left path is MM5 simulation results, while the right path is actual track of Typhoon Chanchu. The numbers are the dates in May, 2006. The colors of typhoon paths show the typhoon intensity, red line indicating typhoon, blue line strong tropical storm, green line tropical storm, and black line tropical depression, respectively. The brown line denotes a section plane, which will be described in the following description. It is found that after moving into the SCS from 12 to 18 of May, Typhoon Chanchu kept strong wind velocity motion in SCS for a few days, which provided a good condition to simulate the SCS response process to Typhoon Chanchu.
(1) At 8 a.m. on May 16, the maximum wind velocity reached 45m/s and the maximum net heat flux was 1.1 kW/m2in Typhoon Chanchu’s domain. The SST and the air-sea temperature difference indeed had significantly association with heat flux transport, and high temperature sea water was propitious to enhance typhoon intensity. When SST was reduced to a certain extent, the typhoon intensity no longer increased. The correlation analysis between SST and net heat flux had local difference. The more the SST decreased, the lower the correlation coefficient was.
(2) With strong influence of wind forcing, upwelling was caused by the internal vertical movement stretching action in the upper narrow viscous basin boundary, while downwelling had weakened in the under layer boundary. In Typhoon Chanchu period, the extreme depth affected by boundary water local vertical movement was about 2 000 m, and it was prone to appear vertical water flow in the critical state of mixed layer. Water exchange was clearly enhanced in the Luzon Strait, the internal water of SCS flew northeast through the Luzon Strait to the western Pacific.
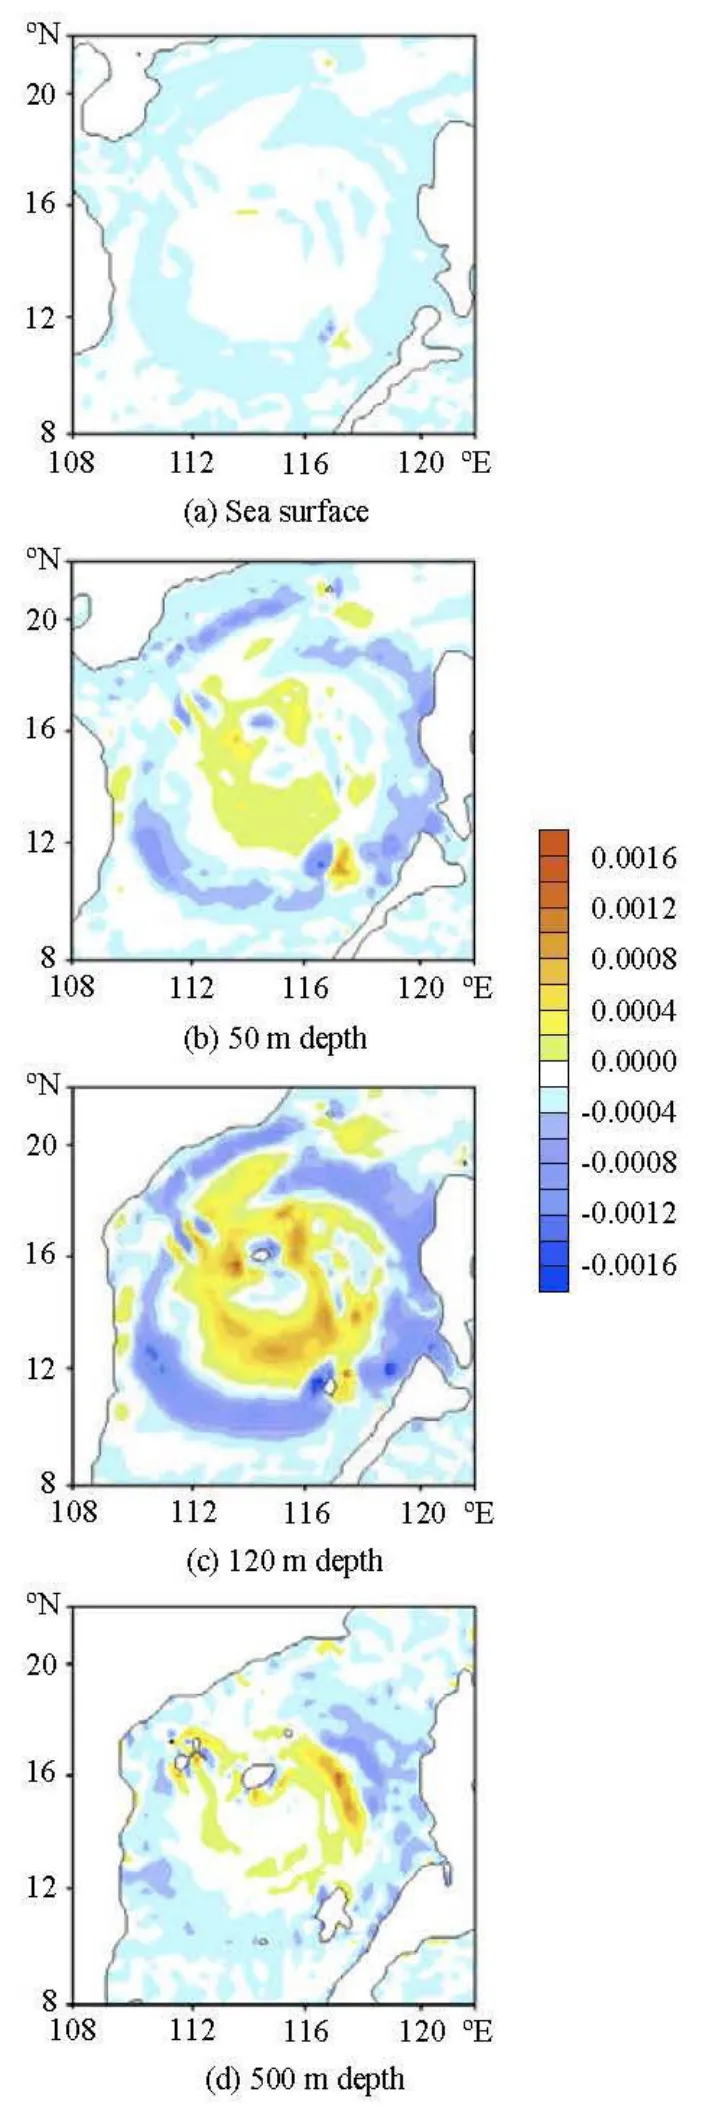
Fig.11 Comparison of vertical velocity (m/s) at different horizontal sections at 8 a.m. on May 11
(3) The SST decreased in the typhoon center, while sea subsurface temperature increased around. Vertical velocity was relatively intense at 120 m depth.Another important circulation feature produced by POM is that, downwelling was caused by convergence current at the edge of typhoon, while upwelling was caused by divergence current in the center of Typhoon Chanchu, however, the maximum vertical flow position was not consistent with the maximum wind stress position.
[1] CHU P. C., VENEZIANO J. M. and FAN C. et al. Response of the South China Sea to tropical cyclone Ernie 1996[J].Journal of Geophysical Research,2000, 105(C6): 13991-14009.
[2] SRIVER S. L., HUBER M. Observational evidence for an ocean heat pump induced by tropical cyclones[J].Nature,2007, 447(7144): 577-580.
[3] TANG Ling, ZHAN Jie-min and CHEN Yi-zhan et al. Typhoon process and its impact on the surface circulation in the northern South China Sea[J].Journal of Hydrodynamics,2011, 23(1): 95-104.
该堆于2009年停堆。在完成重大升级改造后,新版Apsara于2018年9月10日实现临界,使用低浓铀燃料,最大输出功率2 MWt。
对于给定的一个包含n个d维数据点的数据集X={ x1,x2,…,xi,…,xn},其中xi∈Rd,K 表示整个数据集经过K-means聚类算法被划分为数据子集的数目,K个数据子集表示为C={ }ck,k=1,2,…,K ,其中每个划分代表一个类ck,每个类ck有一个类中心μk。采用欧几里得距离作为不同数据点间的相似度和距离判断的标准,计算ck类内各点到聚类中心μk的距离平方和DisSum( )ck,见公式(1):
[4] PRICE J. F. Upper ocean response to a hurricane[J].Journal of Physical Oceanography,1981, 11(2): 153-175.
[5] ZHENG Z. W., HO C. R. and ZHENG Q. et al. Satellite observation and model simulation of upper ocean biophysical response to upper typhoon Nakri[J].Continental Shelf Research,2010, 30(13): 1450-1457.
[6] ZHAN Jie-min, YAN Xiao-hai. A large eddy simulation turbulence model and a local filtering assimilation method for ocean circulation problems[J].Acta Oceanologica. Sinica,2004, 26(3): 8-15(in Chinese).
[7] MELLOR G. L., BLUMBERG A. F. Wave breaking and ocean surface layer thermal response[J].Journal of Physical Oceanography,2004, 34(3): 693-698.
1.1 仪器 LC-20A HPLC(日本岛津公司);AB SCTEX QTRAP 5500 串联质谱(美国AB公司);T25 D高速匀浆机(德国IKA公司);MS3 D S25涡旋混合仪(德国IKA公司);BSA224S - CW 万分之一电子天平(德国 Sartorius公司);LDZS - 2 高速离心机(北京京立离心机公司);0.22 μm 有机系微孔滤膜(北京科瑞海科学仪器有限公司)。
[8] SHAY L. K., UHLHORN E. W. Loop current response to hurricanes Isidore and Lili[J].Monthly Weather Research,2008, 136(9): 3248-3274.
[9] BIGNAMI F., HOPKINS T. S. Salt and heat trends in the shelf waters of the southern Middle-Atlantic Bight[J].Continental Shelf Research,2003, 23(6): 647-667.
[10] DRENNAN W. M., ZHANG J. A. and FRENCH J. R. et al. Turbulent fluxes in the hurricane boundary layer. Part II: Latent heat flux[J].Journal of the Atmospheric Sciences,2007, 64: 1103-1115.
[11] SPALL M. A. On the thermohaline circulation in flat bottom marginal seas[J].Journal of Marine Research,2003, 61(1): 1-25.
治疗前,2组患者的FMA-UE、ARAT、FTHUE-HK、MAL-AOU、 MAL-QOM、MBI评分差异无统计学意义。治疗后,2组患者FMA-UE、ARAT、FTHUE-HK、MAL-AOU、MAL-QOM、MBI评分与治疗前比均有显著提高(均P<0.05),治疗后2组间比较,gmCIMT组患者的FMA-UE、ARAT、FTHUE-HK、MAL-AOU及MAL-QOM评分的改变比常规组更加显著(均P<0.05),MBI评分2组间差异无统计学意义。见表1,2。
[12] JIANG Xiao-ping, ZHONG Zhong and JIANG Jing. Upper ocean response of the South China Sea to Typhoon Krovanh (2003)[J].Dynamics of Atmospheres and Oceans,2009, 47(1-3): 165-175.
[13] NIE Yu-hua, ZHAN Jie-min and CHEN Zhi-wu. Simulation and influence factor analysis of circulation and thermal structure of the surface layer of the South China Sea[J].Acta Scientiarum Naturalium Universitatis Sun Yat Sen,2011, 50(2): 134-138(in Chinese).
[14] LIU Jiu-liang, CAI Shu-qun and WANG Sheng-an. Current and mixing on the northern South China Sea[J].Chinese Journal of Oceanology and Limnology,2010, 28(5): 974-980.
[15] SUN Lu, ZHENG Quan-an and WANG Dong-xiao et al. A case study of near-inertial oscillation in the South China Sea using mooring observations and satellite altimeter data[J].Journal of Physical Oceanography,2011, 67(6): 677-687.
[16] ZHANG Shan-wu, FAN Zhi-song. Effects of high-order nonlinearity and rotation on the fission of internal solitary waves in the South China Sea[J].Journal of Hydrodynamics,2013, 25(2): 226-235.
10.1016/S1001-6058(14)60052-4
* Project supported by the National Nature Science Foundation of China (Grant No. 40906006), the Fundamental Research Funds for the Central Universities.
Biography: CHEN Yi-zhan (1984-), Male, Ph. D. Candidate
LUO Ying-ying,
E-mail: luoyy2@mail.sysu.edu.cn
猜你喜欢
杂志排行

水动力学研究与进展 B辑的其它文章
- Numerical simulation of landslide-generated impulse wave*
- A random walk simulation of scalar mixing in flows through submerged vegetations*
- Scaling of maximum probability density function of velocity increments in turbulent Rayleigh-Bénard convection*
- Dispersion in oscillatory electro-osmotic flow through a parallel-plate channel with kinetic sorptive exchange at walls*
- Evaluation of the use of surrogateLaminaria digitatain eco-hydraulic laboratory experiments*
- A numerical study on dispersion of particles from the surface of a circular cylinder placed in a gas flow using discrete vortex method*