Effect of vegetated-banks on local scour around a wing-wall abutment with circular edges*
2014-06-01AFZALIMEHRHosseinBAKHSHISomayeh
AFZALIMEHR Hossein, BAKHSHI Somayeh
Department of Water Engineering, Isfahan University of Technology, Isfahan, Iran, E-mail: hafzali@cc.iut.ac.ir GALLICHAND Jacques
Department Des Sols Et De Génie Agroalimentaire, Pavillon Paul-Comtois, Université Laval, St-Foy, QC, Canada SUI Jueyi
Environmental Engineering program, University of Northern British Colombia, Prince George, BC, Canada
Effect of vegetated-banks on local scour around a wing-wall abutment with circular edges*
AFZALIMEHR Hossein, BAKHSHI Somayeh
Department of Water Engineering, Isfahan University of Technology, Isfahan, Iran, E-mail: hafzali@cc.iut.ac.ir GALLICHAND Jacques
Department Des Sols Et De Génie Agroalimentaire, Pavillon Paul-Comtois, Université Laval, St-Foy, QC, Canada SUI Jueyi
Environmental Engineering program, University of Northern British Colombia, Prince George, BC, Canada
(Received June 4, 2013, Revised January 13, 2014)
Failure of bridges due to local scour in the vicinity of bridge abutments is a common occurrence. In this study, experiments under two different channel conditions were conducted to assess the impacts of vegetation on channel banks on local scour around a wing-wall abutment with circular edges. Some experiments were conducted in channel with vegetation on channel banks, and other experiments in channel without vegetation on channel bank. The flow velocity and Reynolds stress distributions in scour holes around a wing-wall abutment with circular edges were compared under these 2 different channel conditions. Results reveal that the vegetated-banks can reduce the time for achieving the equilibrium condition from 17 h to 9 h. Also, vegetated-bank channels can result in a significant decrease in the maximum scour depth from 0.084 m (for bare channel bank) to 0.00032 m. Additionally, around the abutment, vegetated-banks play a significant role in diminishing the Reynolds stress (RS) near the bed and removing negative values in RS distribution by weakening unfavorable pressure gradient and down-flow in the upstream of abutment.
local scour, vegetated-banks, wing-wall abutment, circular edges, Reynolds stress (RS)
Introduction
Abutments located at the end of the bridge help to transmit the weight of the bridge to the foundation. Many studies have been conducted to understand the characteristics of local scour around abutments using flow velocity and shear stress data, e.g., cf. [1,2]. Local scour around abutments has been identified as an issue with potentially catastrophic consequences. Excessive scour can cause abutment damage and bridge failure. Due to the location of abutments in bridges over the rivers, vegetated-banks can affect the local scour process in the vicinity of these structures. Vegetation exists widely around rivers, especially in flood plains and river bank. Vegetation in river systeminfluences flow field and sediment transport. Riparian vegetation promotes geomorphic stability through increasing flow resistance and therefore, reducing nearbank flow velocity[3]. As a consequence, the impacts of vegetation should be considered in hydraulic designs.
The flow around an abutment which is embedded vertically in sediment is a complex phenomenon due to the flow separation and development of three-dimensional vortex flow in the scour hole. Kwan[4]measured 3-D flow field in a scour hole at a wing-wall abutment using the hydrogen bubble technique and found that a primary vortex similar to horseshoe vortex and down flow were responsible for the scouring at abutments. Ahmed and Rajrantam[5]studied the flow field around the abutments located on planar or unscoured bed. They claimed that the bed shear stress near the corner of abutments displayed larger values up to 3.63 times the approaching bed shear stress. Barbhuiya and Dey[6,7]investigated the 3-D flow field around vertical-wall, wing-wall and semicircular abu-tments, using the acoustic Doppler velocimeter (ADV). Barbhuiya and Dey[6]measured the flow fields in scour holes at different vertical or azimuthal sections of vertical-wall, wing-wall and semicircular abutments. They pointed out the existence of primary vortex associated with down-flow inside the scour hole at the upstream and downstream of abutment and a reversed flow near the abutment due to the flow separation. Also, they found that circulation was strong upstream of the abutments and its effect diminished with augmentation ofθ, showing a negligible vortex motion atθ=90o. Further augmentation inθbeyond 90 made the flow directed outward in the downstream of abutment. Stream-line abutments with wing-wall or semi-circular shapes generated feeble strength vortices, producing smaller scour depth in comparison with that caused by wing-wall abutment. On the other hand, recent investigations indicated that vegetated-banks considerably affect the flow structure, especially the velocity and Reynolds stress distributions[8,9].
Although many investigations have been conducted to assess local scour for different shapes of abutments, to reduce local scour depth around abutment still remains as one of the unexplored research topics. Vegetated channel bank is one of key elements in environmental hydraulic whose impacts on flow field and scouring process around abutments has not been thoroughfully investigated. Also, no study has been carried out to assess the impacts of the wing-wall shape with semicircular edge on scouring process near abutments. The objectives of this experimental study are: (1) to study the effect of vegetated-banks on scouring process around a wing-wall abutment with circular edges over a sand-bed channel and (2) to compare the flow field and Reynolds stress distributions in the upstream of abutment for the vegetated-bank channel to those for bare-banks channels.
1. Methodology
Experiments were carried out in a rectangular flume which is 7 m long, 0.33 m wide and 0.36 m deep at the Hydraulics Laboratory of Isfahan University of Technology in Iran. A rectangular weir located at the end of the flume controlled water level during experiments. A pump with a maximum discharge capacity of 0.022 m3/s circulated water from sump. An electromagnetic flow-meter was installed in the supply conduit to continuously measure the discharge passing through the flume.
At first, different flow discharges and approaching flow depths were used to study the effect of these parameters on the velocity fields and the Reynolds stress distributions. It was found that the larger the flow discharge, the larger the shear velocity. However, the pattern of the velocity field and the shear stress distribution rests invariant when the flow discharge changes, showing a convex shape in front of structure and a concave shape at the rear of structure for different discharges and flow depths. The authors found similar results in their previous papers[10,11].
Some studies[12,13]reported that for the relative submergence ofh/d>2.5 andh/l>1, in whichhis the flow depth,dis the sediment size andlis the structure length parallel with the flume sides, the scouring depth remains constant. Sui et al.[14]and Garibzadeh et al.[15]used the approaching flow depth ofh=0.06 m andh=0.09 m, respectively and found similar patterns for scouring process.
The selection of flow velocity and flow depth mainly depends on the laboratory setup and the flume dimensions. One may determine a theoretical value for flow depth by the continuity equation or the Shields diagram, however, this flow depth may not convenient to apply due to very severe scouring in practice. Therefore, it is a time-consuming trial-anderror process to have a suitable approaching flow depth for further analysis and visualization of scouring process. Due to the space limitation and tremendous calculations and plotting, it is impossible to present all results under different experimental conditions, except to present the important results of scouring process around abutment in this study.

Fig.1 Abutment and vegetated bank

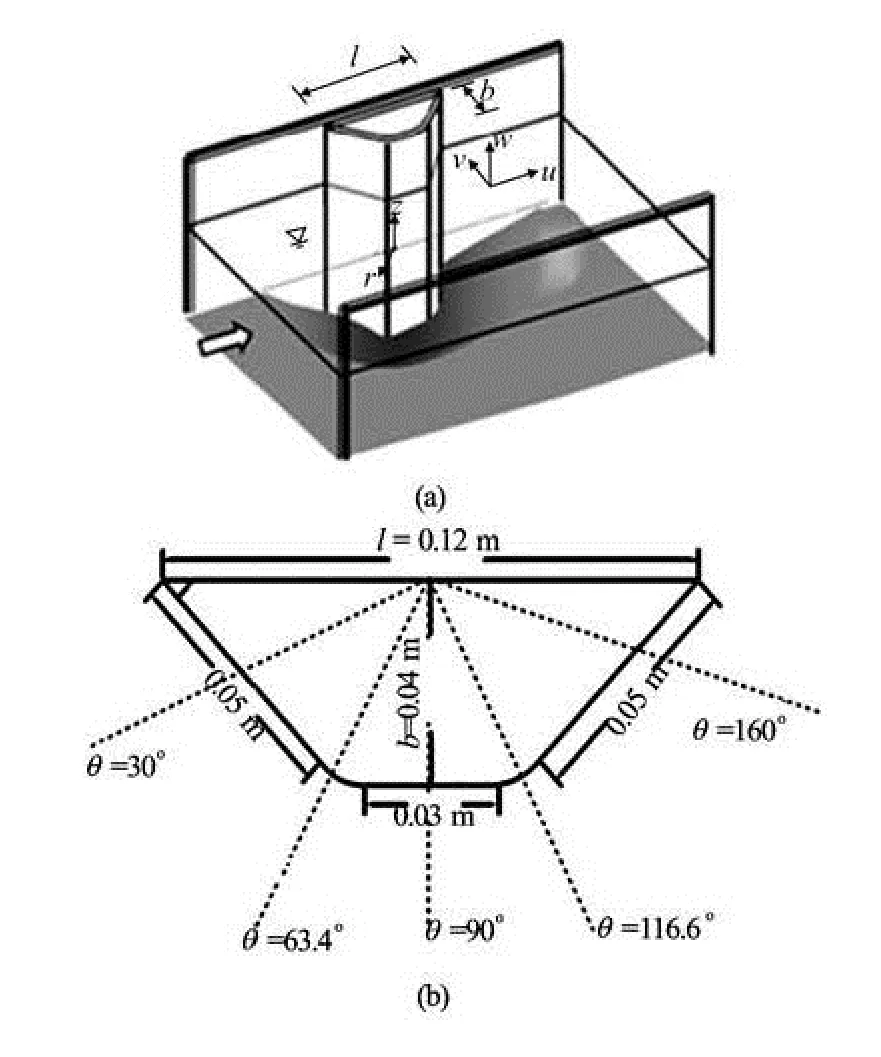
Fig.2 Dimensions of abutment and section of flow measurement, and the coordinate system
Rice stems which has a median diameter 0.0027 m were used as the vegetation and embedded on flume wall, as shown in Fig.1. The thickness of vegetation in each bank (flume wall) was 0.005 m. The rice steam distribution was calculated as the number of stem per unit length (370 stems/m). To make sure that the vegetation will not be washed away by flow, rice stems were stitched by thin cotton wire over the plastic carpet and then was stuck to the flume walls.
To start the experiments, the flume was carefully filled with water by a pipe at a low flow rate to obtain the desired water depth and to avoid undesirable scour. Then, the experimental runs were commenced by adjusting the flow discharge for the desirable depth. The flow depth was measured by a point gauge with ±0.001m accuracy installed on the moving carriages at several points around the abutment. Experiments were carried out under a clear-water scour condition. To achieve clear-water scour conditions and maximum scouring depth, the valueu*/u*c=0.9 was selected whereu*is the approaching shear velocity, which was calculated by fitting near the bed data to the log law[10,16], andu*cis the critical shear velocity of sediment particle, which was estimated by trial and error method in the laboratory. The first run of experiments was conducted in flume without vegetation on flume wall (namely bare-bank channel). In this run critical approaching flow depth,hc, was determined by using the trial and error method to visualize the incipient motion of bed material. To visualize the particle movement, water depth changed slowly until the particles start to move, this critical depth occurred at 0.13 m. Then to obtainu*/u*c=0.9, the approaching flow depth was calculated as 0.145 m. Accordingly, in flume with vegetated banks (namely vegetated-bank run), the flow depth was taken as 0.145 m. The critical and approaching flow depths for the bare-banks run were determined as 0.15 m and 0.16 m, respectively. The average approaching flow velocity,U, was obtained from the depth-averaged (profile-averaged) velocity at the central axis and near the vegetated-banks. For the vegetated-bank run, the depth-averaged approaching flow velocity at the central line and near the channel bank (namely flume wall) presented different values of 0.27 m/s and 0.23 m/s respectively due to sidewall effect, and for bare-bank run the depth-averaged velocity was measured 0.27 m/s. Considering, the approaching flow depths ofh=0.16 m andh= 0.145 m and abutment length ofl=0.12 m, the range of contraction ratio (h/l) was 1.2 to 1.33 which were not adequate for the development of a strong vortex system in a narrow channel condition, therefore, the side walls effect was not considered in this study.
The time for achieving an equilibrium scour depth around abutment for the bare-banks run was 48 h, assuming that the equilibrium scour depth was achieved when scour hole variation was 0.001 m per 3 h[17]. For the run with the vegetated-banks, the equilibrium scour depth was achieved after 9 h, however, each of our experiments lasted for more than 48 h. When the equilibrium state was achieved, water was drained from the scour hole. Then a chemical material was sprayed over the scour hole to stabilize it. After 24 h, scour hole dimensions were measured by a movable limnimeter with an accuracy of ±0.001m. The maximum scour depth,ds, located near the abutment atθ=90o, was 0.032 m for the vegetated-bank run and 0.084 m for the bare-bank run.
Two coordinate systems were used in this study: the first one is to present velocity components and the second one is to show the location of measured velocity around the abutment. Accordingly, the mean flow velocity components (u,v,w) correspond to the stream-wise (or longitudinal), transverse (span-wise), and vertical directions, respectively and the coordinates of (r,θ,z) correspond to location of measured velocity, as shown in Fig.2.
The instantaneous 3-D velocity components were detected by an ADV. Due to obscure phase between the outgoing and incoming pulses that are located outside the range from -180oto 180o, some spikes were observed in the recorded data, especially for the regions with strong vortex. Dey and Barbhuiya[18]believethat spikes may occur due to high turbulent and aerated flow. Four methods of filtering for ADV data were studied, including acceleration and maximum/ minimum thresholds, SNR/ correlation and phasespace. However, the method of SNR/correlation was used in this study. Data with averaged signal-to-noise ratio (SNR) lower than 15 db and average correlation lower than 70% were filtered out. Velocity was recorded for each point with a sampling frequency of 200 Hz and a sampling duration of 120 s, where the height of sampling volume was 0.0055 m. The probe was capable of measuring velocity in the range of ±0.03m/s to ±2.5 m/s .
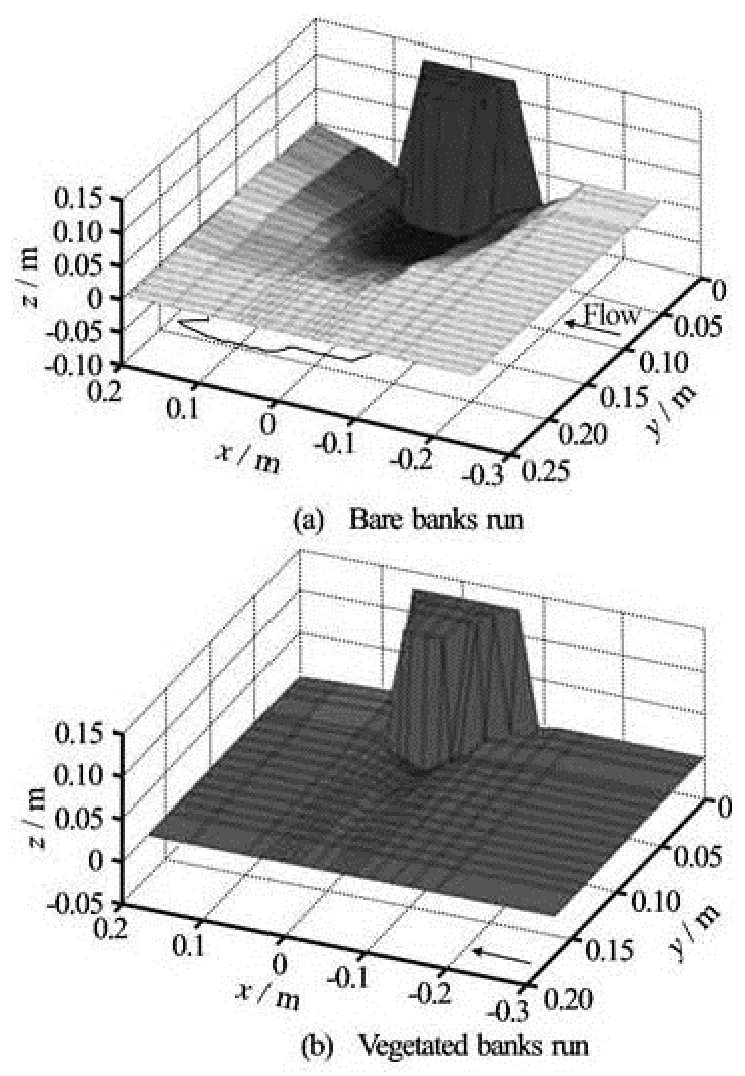
Fig.3 Layout of scour hole
2. Results and discussion
Experiments show that for flow dischargeQ= 13liter/s, the particles started to move at the flow depth ofh=0.13 m andh=0.15 m for the vegetatedbanks runs and bare-banks runs, respectively. Therefore, the vegetated banks enhance the conditions of incipient motion of the particles with the same size in comparison with that for the bare-banks channel.

Fig.4 Longitudinal profiles for the depth of scouring
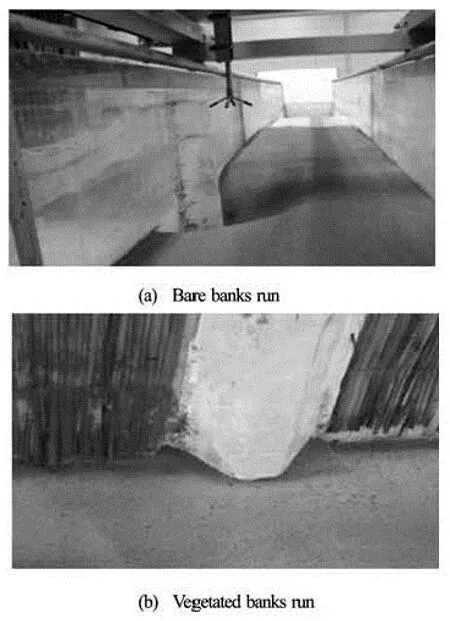
Fig.5 Scour hole for the bare banks and vegetated banks run
The time for achieving an equilibrium scour depth depends mainly on the grain size of sediment and abutment shape. Kohli and Hager[19]pointed out that the scouring process is a continuous process and there will be no real equilibrium scouring depth. Figure 3 shows the simulated scour hole by using MATLAB and Fig.4 gives the longitudinal profile of scour hole when the maximum scour depth is achieved. From Figs.3, 4 and 5, one can see that the scour depth around abutment is less in the vegetated channel than that in channel without vegetation. Accordingly, for the bare-banks run, the maximum scour depth reaches 0.084 m, while the maximum scour depth is only 0.0032 m for the vegetated-bank run. Some experimental results indicate that under the same shear velocity ratio (u*/u*c), the maximum scour depth increases with the increase in the approaching flow depth[20]. Therefore, the reason for the decrease in scour depth at the presence of vegetation on channel banks is notdue to the increase in approaching flow depth. Additionally, the vegetated banks can also reduce the time for achieving an equilibrium scour depth up to 9 h compared to that for the bare banks rune of 17 h.
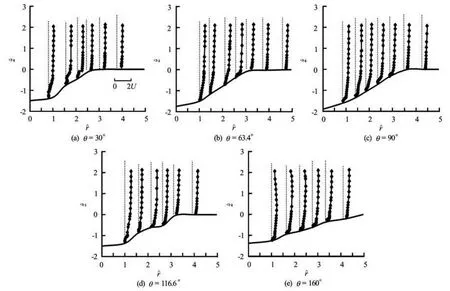
Fig.6 Vertical distribution ofat azimuthal section for the bare-bank channel
2.1Velocity field around the abutment
In this study, the dimensions of the abutment were normalized by the width of the abutment (normal to vertical walls,b), and velocity components were normalized by the average approaching flow velocity (U), respectively. Also, the velocity components were shown in theplane at different azimuthal anglesθwhereisr/bandisz/b.
2.2Velocity components for the bare-banks run
Figure 6 shows the distributions of normalized time-averaged stream-wise velocity component=u/Uat different vertical sections for the bare-bank run. In this figure,andare radial distances from the abutment and the sand bed respectively, before scouring process starts. Before each experiment starts, the bed level at the crest of bed material was assumed to bez=0. For the bare-banks, the streamwise velocity was lowered below the original bed (z=0), especially near the scour hole. Barbhuiya and Dey[21]and Dey and Barbhuiya[22,23]also reported the negative stream-wise velocity near the scour bed both upstream (especially atθ=30o) and downstream (especially atθ=160o) of the abutment. The reason for this negative velocity is the reversal flow due to flow separation. However, with the decrease in the abutment width, the separation zone becomes too small to be detected by ADV. The velocity distribution above the original channel bed is almost similar to the turbulent flow distribution on the flat bed and can be described by a power law in the upstream region (30oto 90o) of the abutment. At the downstream of the abutment, forθ=160o, the stream-wise velocity near the water surface decreases significantly due to wake vortex effect.
Figure 7 presents distribution of normalized time-averaged transverse velocity componentˆ=v/Uat different vertical sections for the bare-bank run where the variations in velocity profiles were observed atˆ<0. Results show that the absolute value of transverse velocity (v) increases at the edge of abutment. In the region upstream of abutment, the transverse velocity displays negative values; however, in the region downstream of abutment (e.g., atθ= 116.6o,θ=160o), transverse velocity displays positive values. The positive values ofvin the region downstream of abutment, especially atθ=160oindicate the circulation of flow as a result of wake vortex in this region.

Fig.7 Vertical distribution of ˆvat azimuthal section for the bare-bank channel
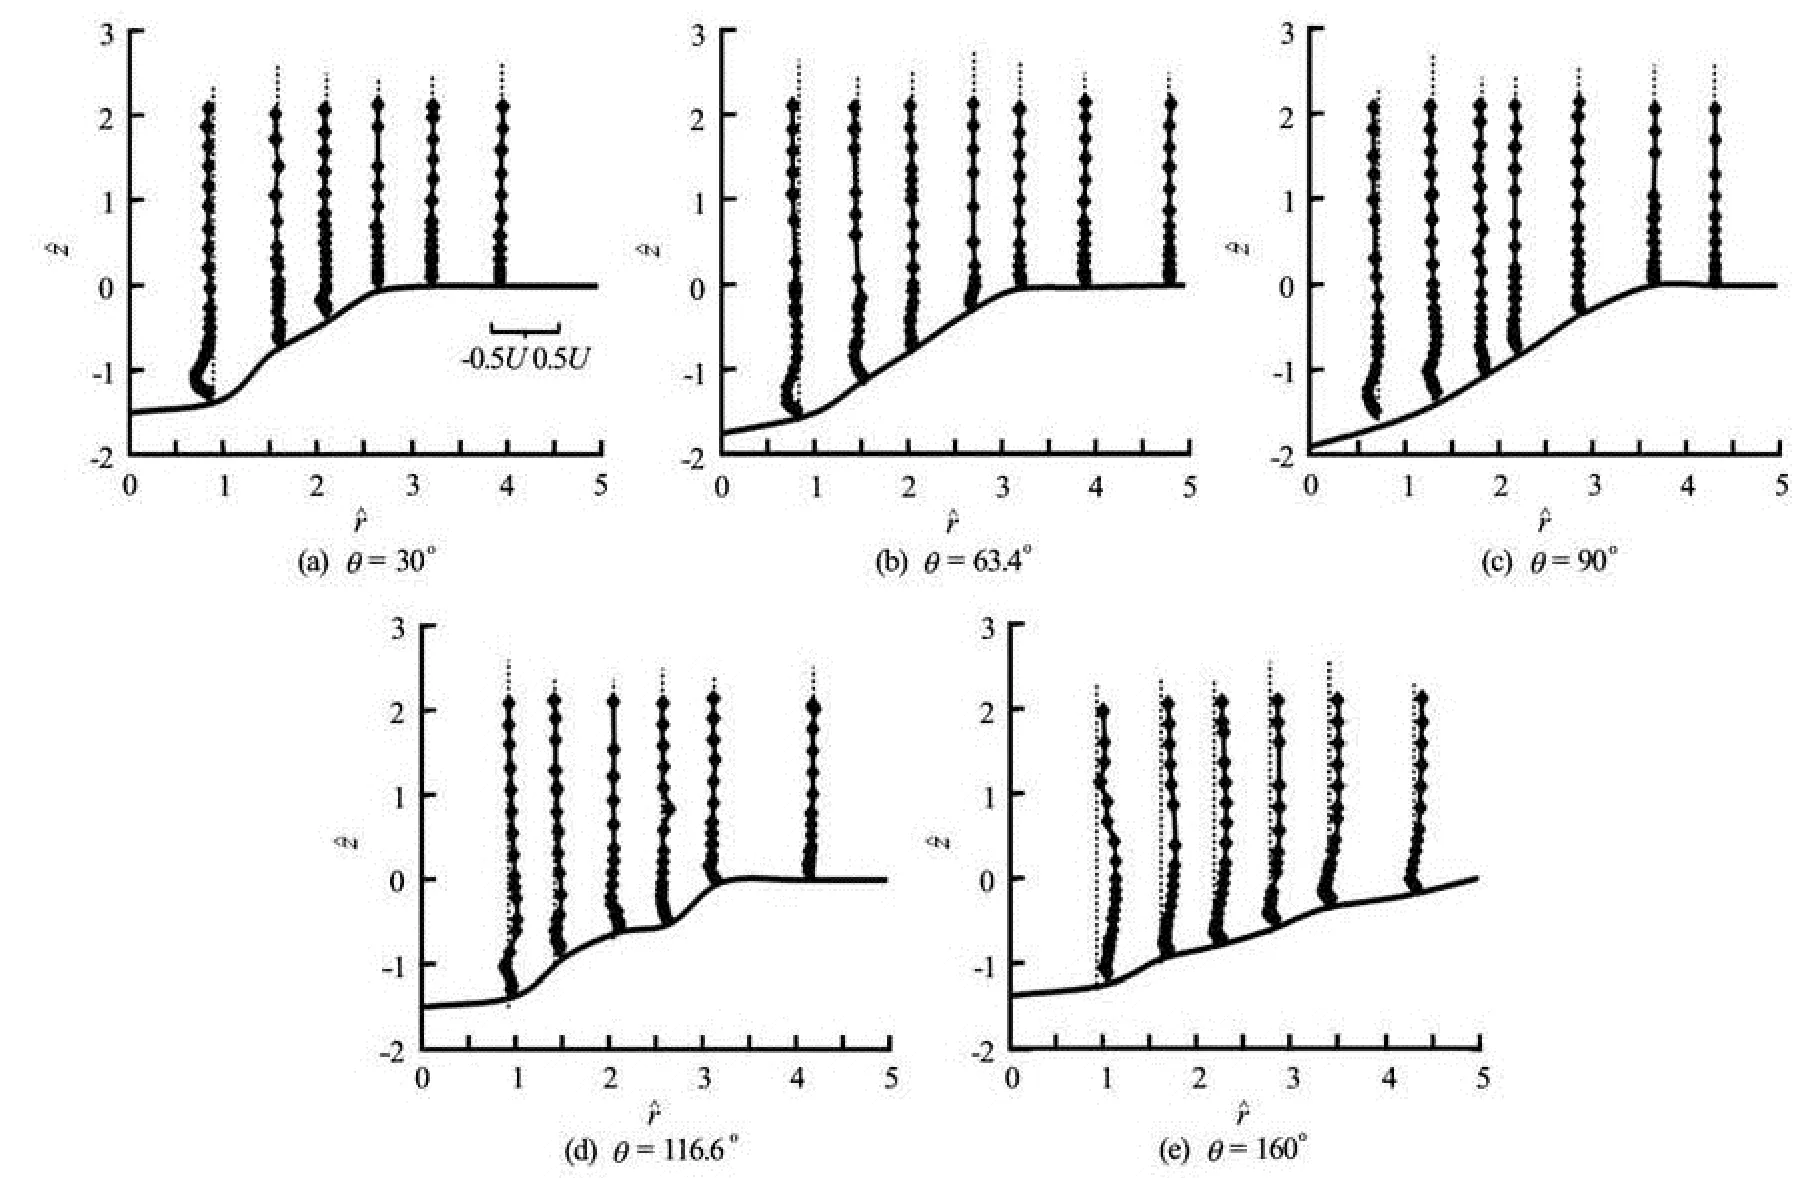
Fig.8 Vertical distribution of ˆwat azimuthal section for the bare-bank channel
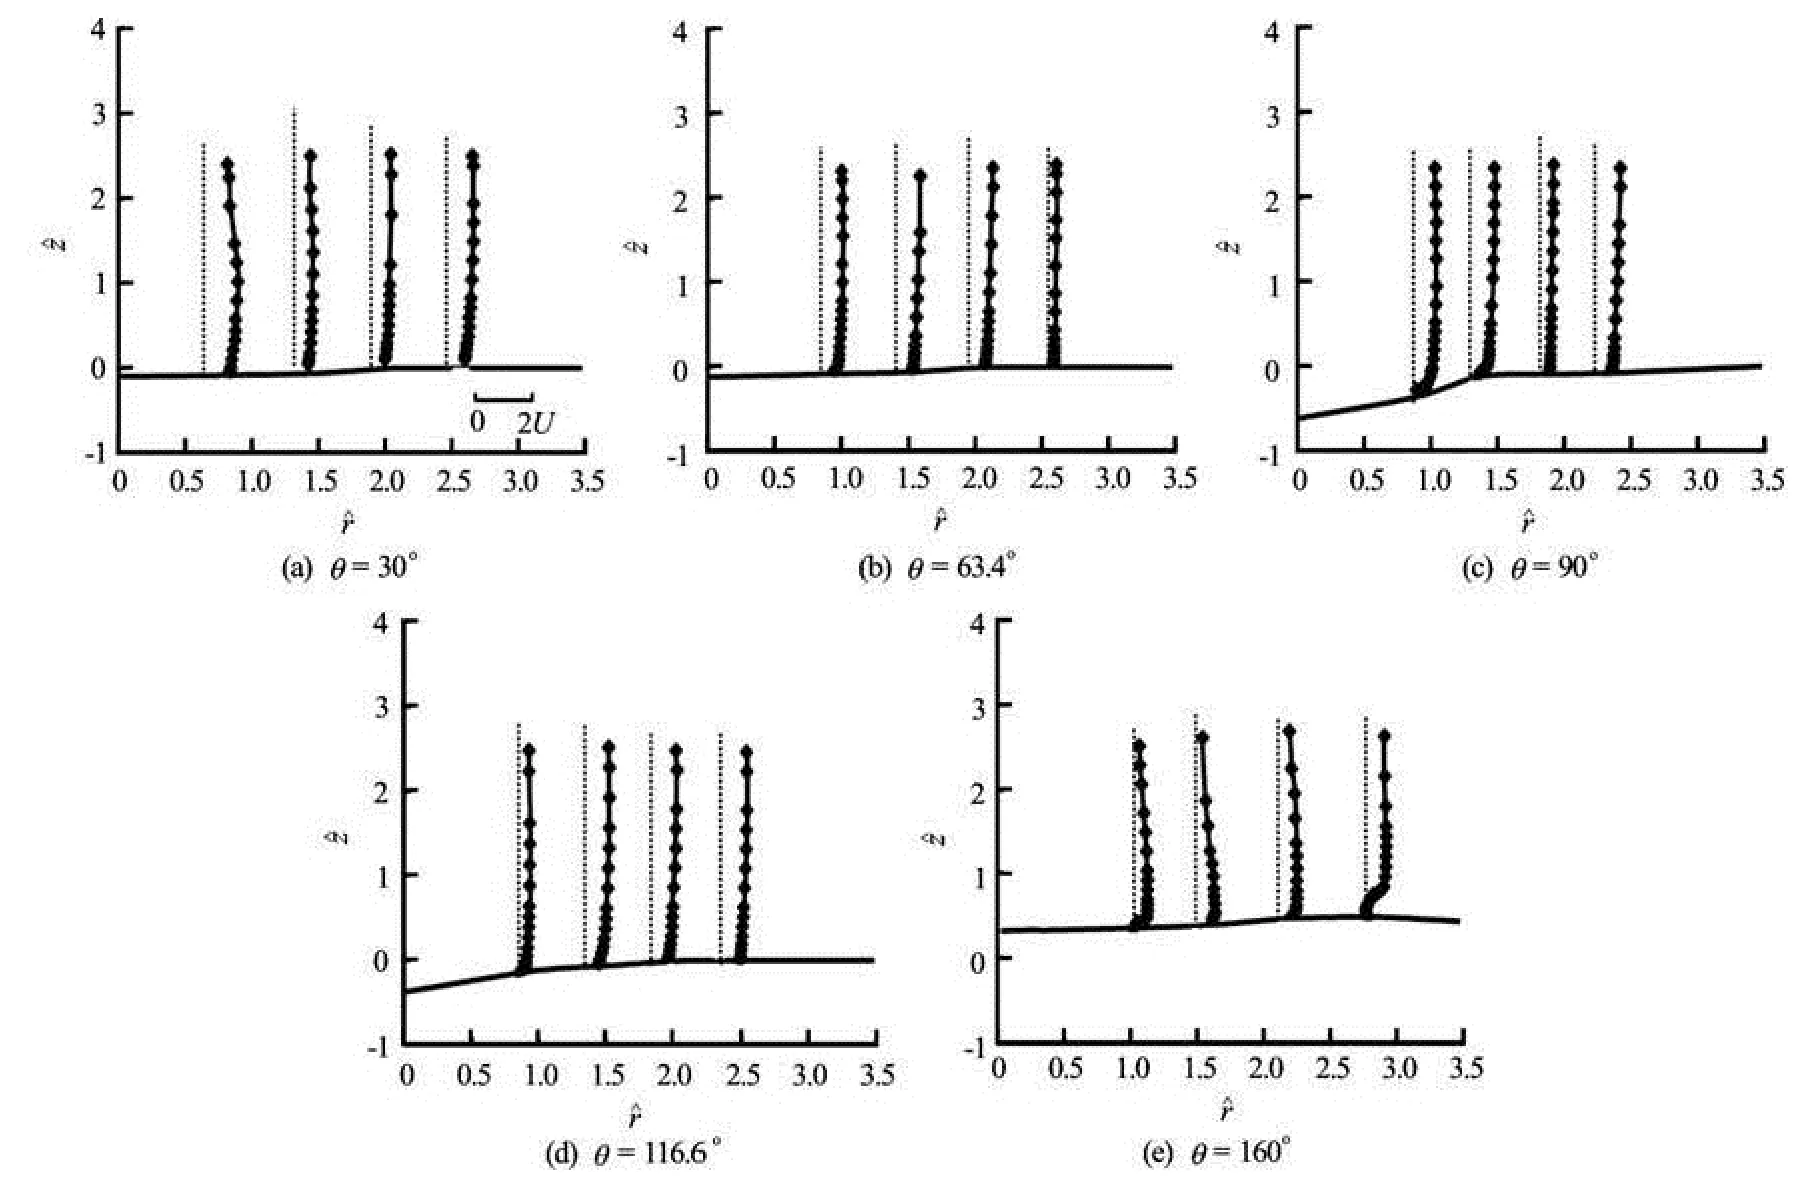
Fig.9 Vertical distribution ofat azimuthal section for the vegetated-bank channel
Figure 8 shows the distributions of normalized time-averaged vertical velocity componentwˆ=w/Uat different sections for the bare-banks run with negative values alongzdirection except near the scour bed. One can see from Fig.8 that the velocity distribution of ˆwhas a concave shape close to the scour bed forθ≤90oand convex shape forθ≥90oand an approximately constant vertical trend near the water surface. Accordingly,near the bed in the region downstream of abutment is larger than that in the region upstream of abutment, has the maximum value ofw=0.153Uwithz=0.225bin the region downstream forθ=160o(wherezis distance from bottom of the hole). In the region upstream of abutment, the maximum value ofw=0.113Uwithz=0.715bappears atθ=90o. The positive velocity near the scour bed were measured up tor=3bwhere maximum positive vertical velocity was observed atz= 0.735b. Also, a negative vertical velocity of -0.439Uwas measured atθ=30owithz=0.88b. At the upstream of abutment, an adverse pressure gradient creates a downflow to product a strong counterclockwise vortex. At the downstream of abutment, the vertical velocity becomes positive whenθincreases beyond 90o. Atθ=116.6o, a strong upward flow occurs near the abutment as a result of suction which helps to remove the bed material from this location. At the downstream of abutment near the bed, the vertical velocity is larger than that in the region upstream of abutment and covers a zone up toy= 1.125bandr=4.25b.
2.3Velocity distribution around the abutment in a vegetated-banks channel
Figure 9 shows the distribution of normalized time-averaged stream-wise velocity componentˆ= /u Uat different vertical sections in the vegetatedbanks channel. The stream-wise velocity increases near the scour bed in the region upstream of abutment, especially close to the vegetated bank. Accordingly, the minimum stream-wise velocity of 0.00538Uis located atθ=30owithr=0.963bfor the bare-bank channel, while for the vegetated-bank channel the minimum stream-wise velocity decreases to 0.661Uat the same point. As was mentioned before, stream-wise velocity near the scour bed decreases due to the primary vortex, showing feeble helicoidal flow near the vegetated-banks. The minimum stream-wise velocity of 0.0161Uappears atθ=90owithr=0.875bandy=0.075b. Atθ=160o, similar to the bare-bank run, stream-wise velocity for the vegetated-banks decreases near the water surface. Therefore, vegetated-banks have no noticeable effect on the wake vortex in the region downstream of abutment.
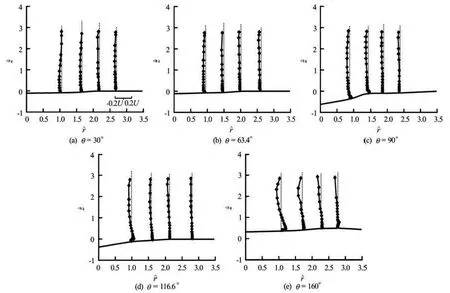
Fig.10 Vertical distribution ofat azimuthal section for the vegetated-bank channel
Figure 10 shows the distribution of normalized time-averaged transverse velocity component=v/Uat different sections in the bare-bank channel. In the vegetated-bank channel, the distribution of transverse velocity is generally similar to that in barebank channel. However, the value of absolute velocity at the corner of abutment in the vegetated-bank channel deceases compared to that in the bare-bank channel. These changes indicate that the primary vortexbecomes weak without vegetation on the channel banks.
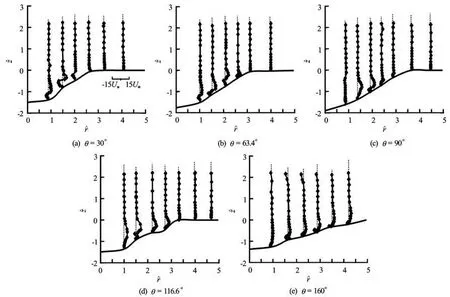
Fig.12 Vertical distribution of' at azimuthal section for the bare-bank channel
Figure 11 shows the distribution of normalized time-averaged vertical velocity componentwˆ=w/Uat different vertical sections in the vegetated-bank channel. Accordingly, there is no positive velocity for in the region betweenθ=30oandθ=63.4o. Near the abutment, the feature of vertical component of velocity is more similar to that outside the scour hole. The minimum vertical velocitywis -0.103Uforθ=30owithz=0.625b. The maximum vertical velocity of 0.0573Uoccurs atθ=90owithz=0.125b. At this angel, the vertical velocity in the vegetatedbank channel increases compared to that in the barebank one. In the region ranging fromθ=90otoθ= 160o, the vertical velocity profiles in the vegetatedbank channel shows similar feature to that in the barebank channel, with the maximum vertical velocity of 0.175b.
2.4Reynolds shear stress distribution
2.4.1 Reynolds shear stress in the bare-bank channel

2.4.2 Reynolds shear stress in the vegetated-bank channel

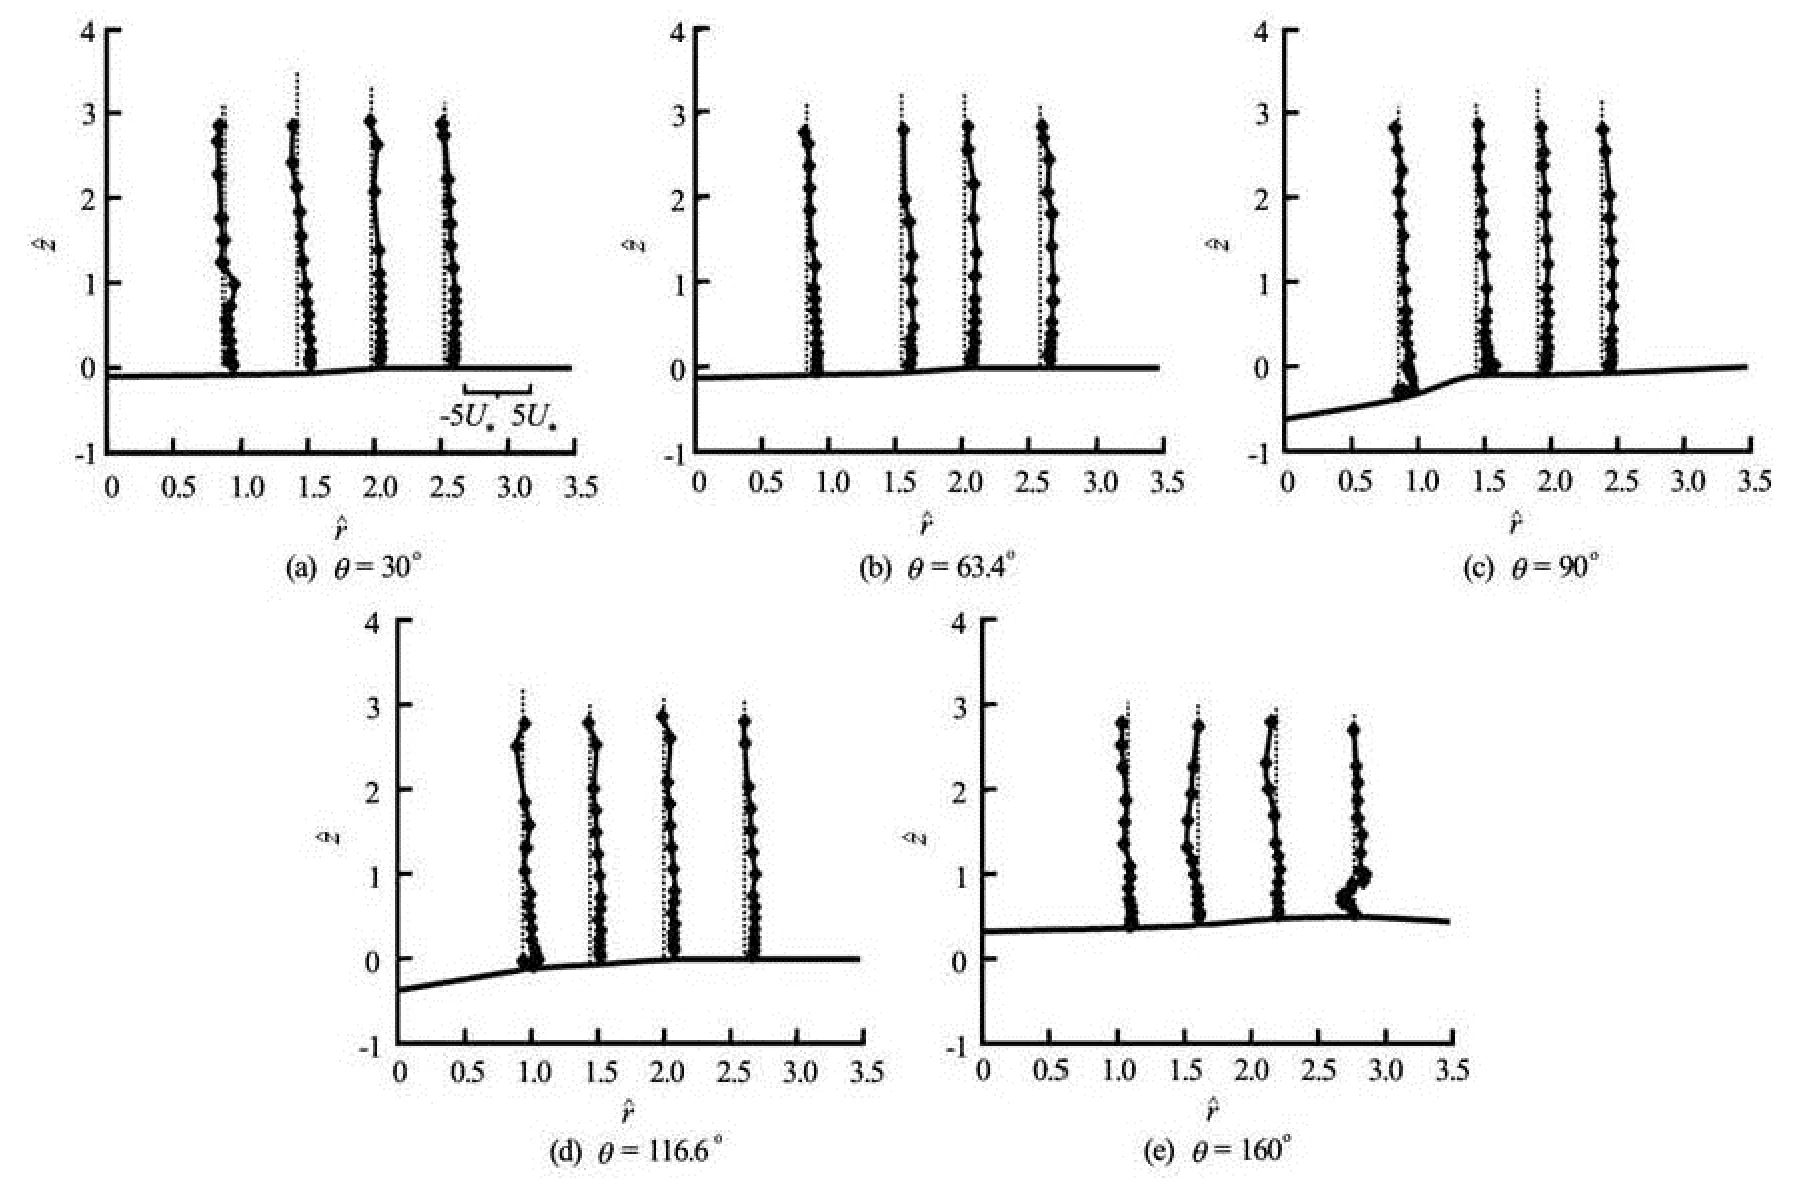
Fig.13 Vertical distribution ofat azimuthal section for the vegetated-bank channel
3. Conclusions
Based on the experiments conducted in both vegetated-bank channel and bare-bank channel, this study compares the velocity field and Reynolds shear stress distributions in the scouring hole around a wing-wall abutment with the circular edges in these two types of channels. Results do not depend on a specific flow discharge or approaching flow depth because the changes in these parameters do not affect the flow pattern. This means that either a decrease or an increase in the approaching flow depth (h) and the mean velocity (u) makes no influence on the shape of their distributions. The following conclusions are drawn from this study:
(1) Instability of the vegetation-water flow interface in the presence of velocity gradient and shear velocity leads to the faster movement of particles in comparison with those in a bare-banks channel.
(2) In the vegetated-bank channel, the shape of scour hole is different from that in a bare-banks channel, leading to an increase in the stream-wise velocity and a decrease in the positive vertical velocity near the bed in the upstream of abutment, especially near the bank due to the reduction in the primary vortex power.
(3) Vegetated banks cause a decrease in time to achieve equilibrium scour hole from 17 h to 9 h, and a reduction in scouring depth from 0.084 m to 0.032 m in comparison with those in a bare banks channel. This is attributed to the decreasing effect of primary vortex which has been considered as one of the most important reasons for causing local scour.
(4) Vegetated banks play no role on the vortex structure in the downstream of abutment. Regardless of vegetation on channel banks, there is similar reduction in stream-wise velocities near the bed and positive vertical velocities (upward flow).
(5) Vegetated banks reduce the Reynolds shear stress near the bed. Also, no negative Reynolds shear stress was noticed due to the weakened adverse pressure gradient and the down-flow in upstream of abutment.
This research work lays the step stone for the further investigation on the impacts of vegetation on channel banks on the local scour process around hydraulic structures. The future studies on this research topic will certainly provide innovative results which will benefit engineering and scientific communities.
[1] SUI J., HICKS F. and MENOUNOS B. Observations of riverbed scour under a developing hanging ice dam[J].Canadian Journal of Civil Engineering,2006, 33(2): 214-218.
[2] WANG Jun, SUI Jueyi and KARNEY Bryan W. Incipient motion of non-cohesive sediment under ice cover-an experimental study[J].Journal of Hydrodynamics,2008, 20(1): 117-124.
[3] CAROLLO F. G., FERRO V. and TERMINI D. Flow velocity measurements in vegetated channel[J].Journal of Hydraulic Engineering, ASCE,2002, 128(7): 664-673.
[4] KWAN T. F. A study of abutment scour[D]. Doctoral Thesis, Auckland, New Zealand: University of Auckland, 1988.
[5] AHMED F., RAJARATNAM N. Observations on flow around bridge abutment[J].Journal of Engineering Mechanics,2000, 126(1): 51-60.
[6] BARBHUIYA A. K., DEY S. Vortex flow field in a scour hole around abutments[J].International Journal of Sediment Research,2003, 18(4): 1-16.
[7] BARBHUIYA A. K., DEY S. Local scour abutments: a review[J].Sadhana,2004, 29(5): 449-476.
[8] AFZALIMEHR H. Effect of flow non-uniformity on velocity and turbulence intensities in flow over a cobble-bed[J].Journal of Hydrological Processes,2010, 24(3): 331-341.
[9] NASIRI E., AFZALIMEHR H. and SINGH V. Effect of bed forms and vegetated-banks on velocity distributions and turbulent flow structure[J].Journal of Hydrology Engineering,2011, 16(6): 495-507.
[10] AFZALIMEHR H., ANCTIL F. Velocity distribution and shear velocity behavior of decelerating flow over a gravel-bed[J].Journal of Canadian Civil Engineering,1999, 26(4): 468-475.
[11] AFZALIMEHR H., FAZEL NAJFABADI E. and SINGH V. P. Effect of vegetation on banks on distributions of velocity and Reynolds stress under accelerating flow[J].Journal of Hydrologic Engineering,2010, 15(9): 708-713.
[12] RAUDKIVI A. J., ETTEMA R. Clear-water scour at cylindrical piers[J].Journal of Hydraulic Engineering, ASCE,1983, 109(3): 339-350.
[13] FROEHLICH D. C. Armor-limited clear-water contraction scour bridge[J].Journal of Hydraulic Engineering, ASCE,1995, 121(6): 490-493.
[14] SUI J., AFZALIMEHR H. and KABIRI SAMANI A. et al. Clear-water scour around semi-elliptical abutments with armored beds[J].Journal of International Sediment Research,2010, 25(4): 233-244.
[15] GRIBZADEH A., AFZALIMEHR H. and MORADIAN M. Investigation of flow structure around the elliptical abutments[C].The eleventh Iranian Hydraulic Conference.Urmia, Iran, 2012.
[16] GRAF W. H., ALTINAKAR M. S.Fluvial hydraulics[M]. Chichester, England, UK: Wiley and Sons, 1998.
[17] KUMAR V., RANGA RAJU K. G. and VITTAL N. Reduction of local scour around bridge piers using slots and collars[J].Journal of Hydraulic Engineering, ASCE,1999, 125(5): 1302-1305.
[18] DEY S., BARBHUIYA A. K. Turbulent flow field in a scour hole at a semicircular abutment[J].Canadian Journal of Civil Engineering,2005, 32(1): 213-232.
[19] KOHLI A., HAGER W. H. Building scour in floodplains[J].Proceedings of the Institution of Civil Engineering on Water Maritime and Energy,2001, 148(2): 61-80.
[20] WONG W. H. Scour at bridge abutments[D]. Doctoral Thesis, Auckland, New Zealand: University of Auckland, 1982.
[21] BARBHUIYA A. K., DEY S. Turbulent flow measurement by the ADV in the vicinity of a rectangular crosssection cylinder placed at a channel sidewall[J].Journal of Flow Measurement and Instrumentation,2004, 15(4): 221-237.
[22] DEY S., BARBHUIYA A. K. 3D flow field in a scour hole at a wing-wall abutment[J].Journal of Hydraulic Research,2006, 44(1): 33-50.
[23] DEY S., BARBHUIYA A. K. Velocity and turbulence in a scour hole at a vertical-wall abutment[J].Journal of Flow Measurement and Instrumentation,2006, 17(1): 13-21.
10.1016/S1001-6058(14)60051-2
* Biography: AFZALIMEHR Hossein (1960-), Male, Ph. D., Associate Professor
SUI Jueyi, E-mail: jueyi.sui@unbc.ca
杂志排行

水动力学研究与进展 B辑的其它文章
- Numerical simulation of landslide-generated impulse wave*
- A random walk simulation of scalar mixing in flows through submerged vegetations*
- Scaling of maximum probability density function of velocity increments in turbulent Rayleigh-Bénard convection*
- Dispersion in oscillatory electro-osmotic flow through a parallel-plate channel with kinetic sorptive exchange at walls*
- Evaluation of the use of surrogateLaminaria digitatain eco-hydraulic laboratory experiments*
- A numerical study on dispersion of particles from the surface of a circular cylinder placed in a gas flow using discrete vortex method*