Structure Optimization Design of Time-Grating with Variable Coupling Coefficient Based on ANSOFT Electromagnetic Analysis
2013-12-07JIANGYanyunSHIJinghuiHEJianTANGQifuYULei
JIANG Yanyun,SHI Jinghui ,HE Jian ,TANG Qifu ,YU Lei
1.a. Engineering Research Center of Mechanical Detection Technology & Equipment, Ministry of Education;b. Remote Test and Control Institute, Chongqing University of Technology, Chongqing 400054, China;2.Changzhou Entry-exit Inspection and Quarantine Bureau of P.R.C,Changzhou 213003, China
StructureOptimizationDesignofTime-GratingwithVariableCouplingCoefficientBasedonANSOFTElectromagneticAnalysis
JIANG Yanyun1a*,SHI Jinghui2,HE Jian1a,TANG Qifu1a,YU Lei1b
1.a.EngineeringResearchCenterofMechanicalDetectionTechnology&Equipment,MinistryofEducation;b.RemoteTestandControlInstitute,ChongqingUniversityofTechnology,Chongqing400054,China;2.ChangzhouEntry-exitInspectionandQuarantineBureauofP.R.C,Changzhou213003,China
Inordertoimprovethesignalstrengthofthetime-gratingwithvariablecouplingcoefficient,theairgapwidthbetweenthestatorandrotor(A),thestatortoothwidth(B),thetoothwidthratioofrotorandstator(C)andthetooththickness(D)wereselectedasthecontrolfactors.ByusingofanL16(45)orthogonalarray,the16differentparameters’inductionsignalstrengthwerecollected.Therangeanalysisandthevarianceanalysiswereperformedthroughelectromagneticanalysisdata.TheresultindicatesthattheoptimalcombinationfoundofA~Dis0.300mm,1.500mm,4∶1and3.000mm,andtheinductionsignalincreasesof16.1% .TheimpactorderoftheparametersfortheinductionsignalisA>C>B>D, andAandChave a high significant effect on the induction signal. The method is more practical value of construction work.
Time-Grating, ANSOFT simulation, range analysis, optimization design
1.Introduction
Time-Grating with Variable Coupling Coefficient[1], which based on the electromagnetic induction principle,takes the space of the rotor displacement conversion for induction electric signals. This type sensor has the advantages such as simple structure, low cost and high precision. Studies have shown that structure of the sensor will affect the induction signal intensity, and the signal is too weak will reduce sensor measurement stability. Finite element simulation application has made remarkable effect in engineering design field. However, it is very difficult to get any combination of structural parameters of the pendulous, and it takes a lot of time for modeling and computing solution. In this paper, the orthogonal table was used to design the sensor structure of the different parameters combination, the finite element simulation was used to get the value of induction signal, and the best group of structure parameters which makes the induction signal be highest was obtained through range analysis. Finally, through variance analysis, the significant influence level of the main structural parameters on induction signal was accurately drawn, thus guiding the signal optimization design of the structure.
2.Analysis the wave of time-grating sensor with variable coupling coefficient
The key of time-Grating with Variable Coupling Coefficient is based on three-phase machinery.
The mathematical model is:
φ(A)=φA·cos(ωt)cos(2πx/W)
(1)
φ(B)=φAcos(ωt+2π/3)cos(2πx/W+2π/3)
(2)
φ(C)=φAcos(ωt+4π/3)cos(2πx/W+4π/3)
(3)

(4)
Expression (4) can also write like this:

(5)
Here,Ais the signal amplitude,ωis the angular frequency,Wis the spatial of windings, Δφis the additional phase angle. The time-grating enwinds the propel coil and inductive coil (probe) on the tooth of the stator, magnetic field molds loop circuit through the stator,the rotor tooth and the air gap between the intertrochanteric. When the rotor rotates, the shape of air gap between the intertrochanteric varies, then the magnetic resistance in the loop circuit also varies. Therefore, the magnetic flux of the inductorium changes and molds a whirled magnetic field which is rapidly moved. Eventually, it reflects in the induced electric motive force of the inductoriums.
3.Orthogonal design of time-grating sensor with Variable coupling coefficient structure parameters
The orthogonal design is the most important design method of the multi-factor experiment. It is designed according to the fractional principle of factor design. Orthogonal experiment design is based on orthogonal design of certain rules, which is to ensure that all information of the affecting test performance parameters can be obtained by using a minimum number of tests in all-factor experiment. It can reduce the number of finite element simulation, and ensure that the sensing signals analysis and optimization is completed in minimum test number of structural parameters by using the orthogonal experimental design to arrange sensing signals structure parameters[2].
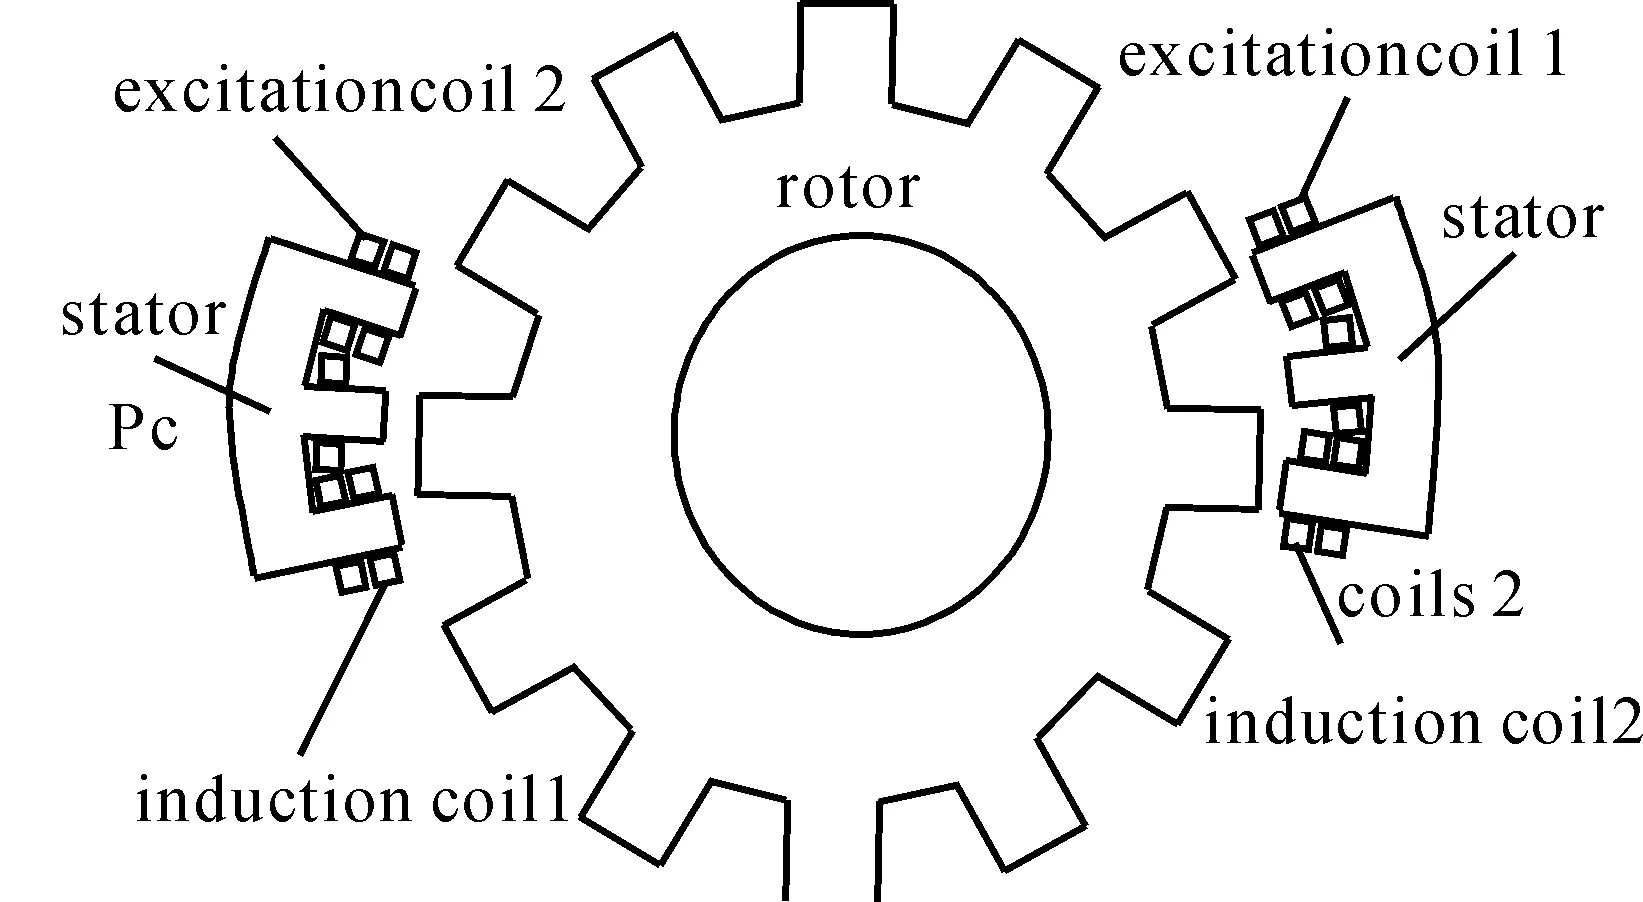
Fig.1 The model of Time-Grating sensorwith variable coupling
Induction signals strength, which is affected by coupling intensity between excitation coil and sense coil, mainly relates to the magnetic circuit model and the air magnetic lea.
TGS132F sensor is used in the experiment. Based on the four factors of the air gap width between the stator and rotor (A), the stator tooth width (B),the tooth width ratio of rotor and stator (C) and the tooth thickness (D), the orthogonal test, according to the design principle, is designed with four levels and four factors by adopting orthogonal table L16(45). Using the modal analysis of large-scale finite element analysis software ANSOFT to get the value (f) of the induction signal, the orthogonal table is obtained as shown in Tab.1.
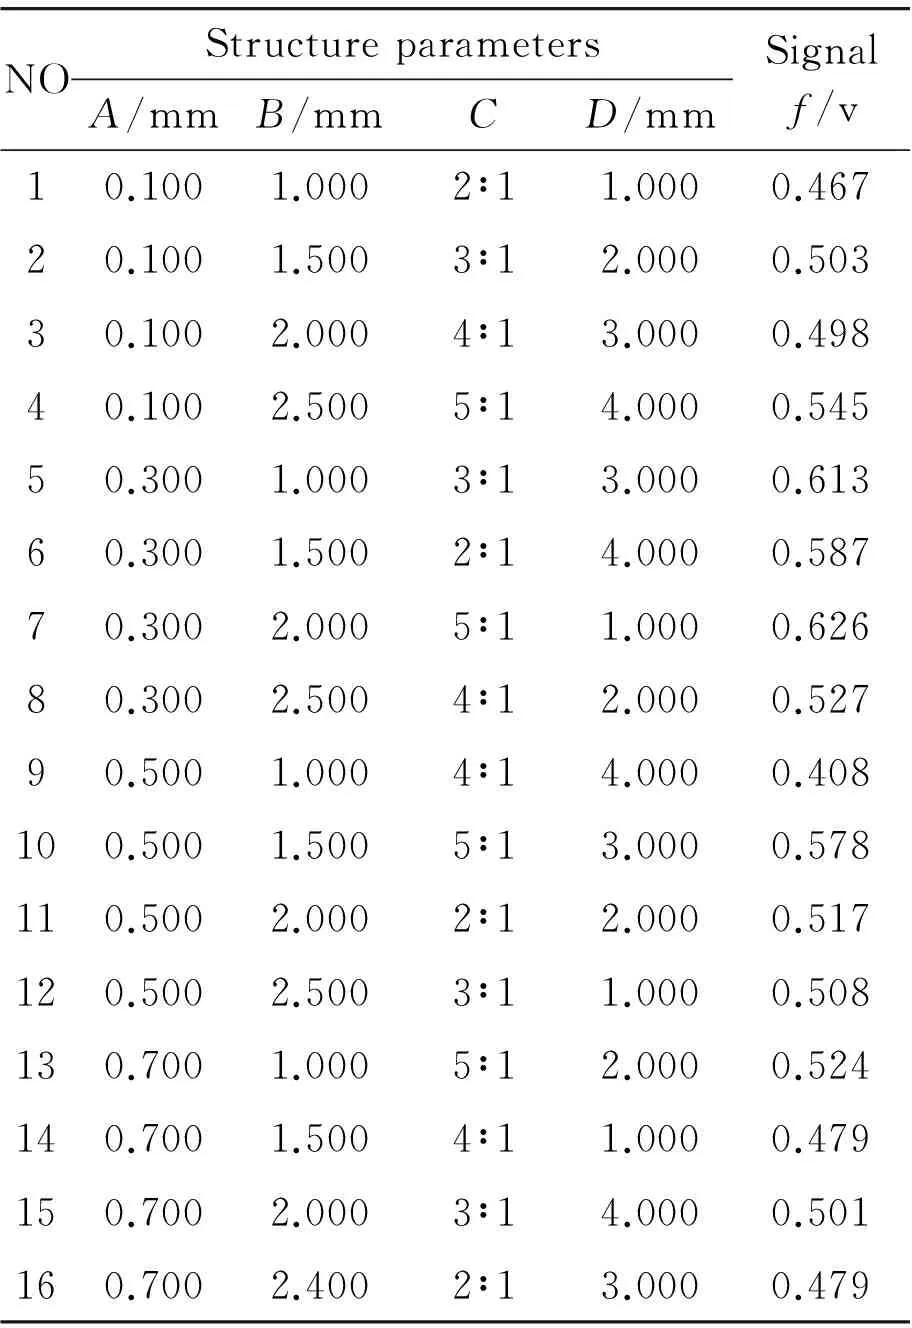
Tab.1 Factors assignment to orthogonal arrayof Time-grating sensor
4.Induction signal range analysis of the Time-Grating sensor structure
4.1.Theprincipleofrangeanalysis
It can solve the under two problems that using the range analysis method to calculate R values in each column of the orthogonal table:
1) Solving the best horizontal combination. This problem comes down to find out that, which factors are taken, the results will be better.
2) Solving the order of the influence factors. Calculating formula is as follows:

(6)
Rj=Kj(max)-Kj(min)
(7)
Among them,iis the number of levels,jis the column numbers of orthogonal table,ris the number of duplicate test in the same level of the factor,Kijis the test average of columnjand leveli,Tijis the sum of experimental resultyiof the columnjand leveliin orthogonal table, andRjis the range of the columnj.
4.2.Resultsofrangeanalysis
According to the principle of range analysis, the results are obtained and shown in Tab.2.
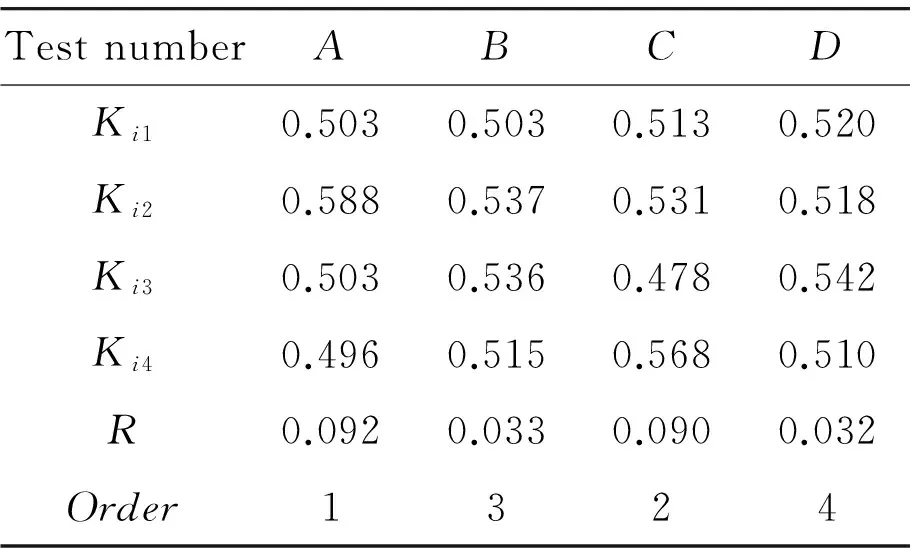
Tab.2 Results of range analysis on the induction signal of Time-Grating structure
As Tab.2 shown, the range size order of the five factors is:RA>RC>RB>RD.That affect order of the indication signal strength is the air gap width between the stator and rotor (A), tooth width ratio of Rotor and stator (C), stator tooth width (B), and the tooth thickness (D). From Fig.2 the optimal anti-vibration structure parameters combination, namely A2B2C4D3, is identified, and the width of air gap width between the stator and rotor is 0.300 mm,the stator tooth width is 1.500 mm, the tooth width ratio of rotor and stator is 4∶1, and the tooth thickness is 3.000 mm. Using the finite element model parameter combination reconstructs model and verifies the simulation results (Fig. 3), the induction signal strength is significantly increased after optimizing. Before optimization signal strength is 0.647 V, and the optimized one is 0.751 V, increased by 16.1%. The authors come to the conclusion that the finite element analysis results are coincide with the simulation results, that is, the signal strength greatly improved.
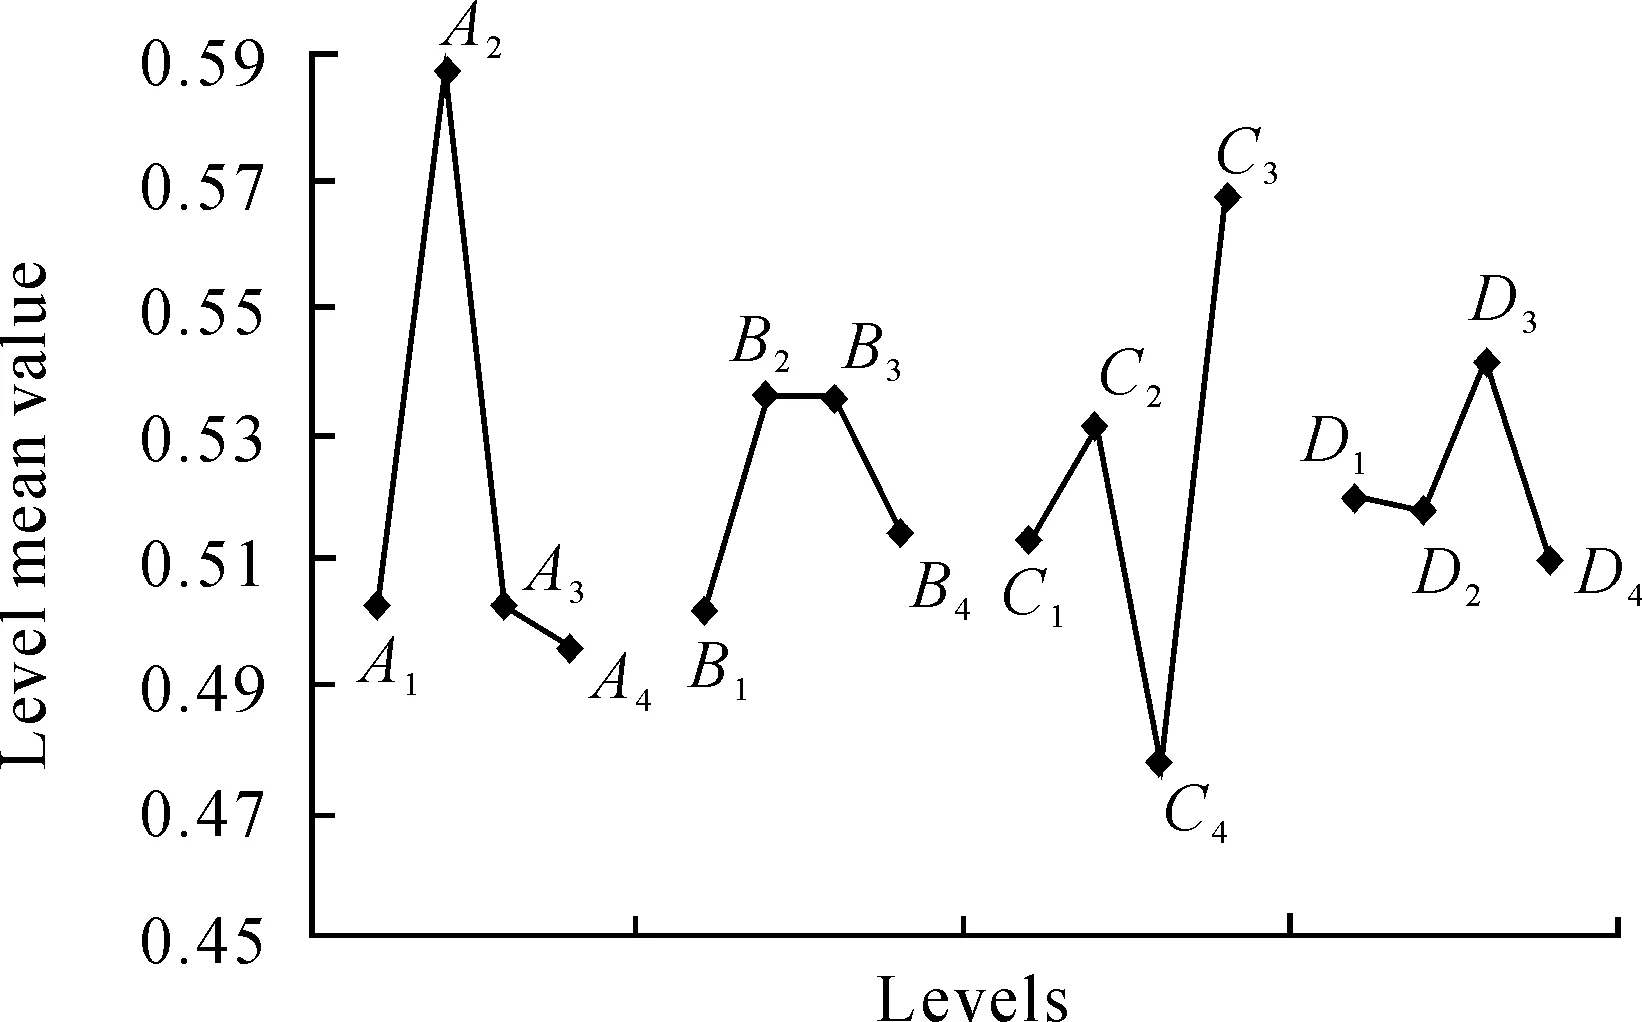
Fig.2 Influence of factors on the fundamental frequency of Rigid-Flex backplane
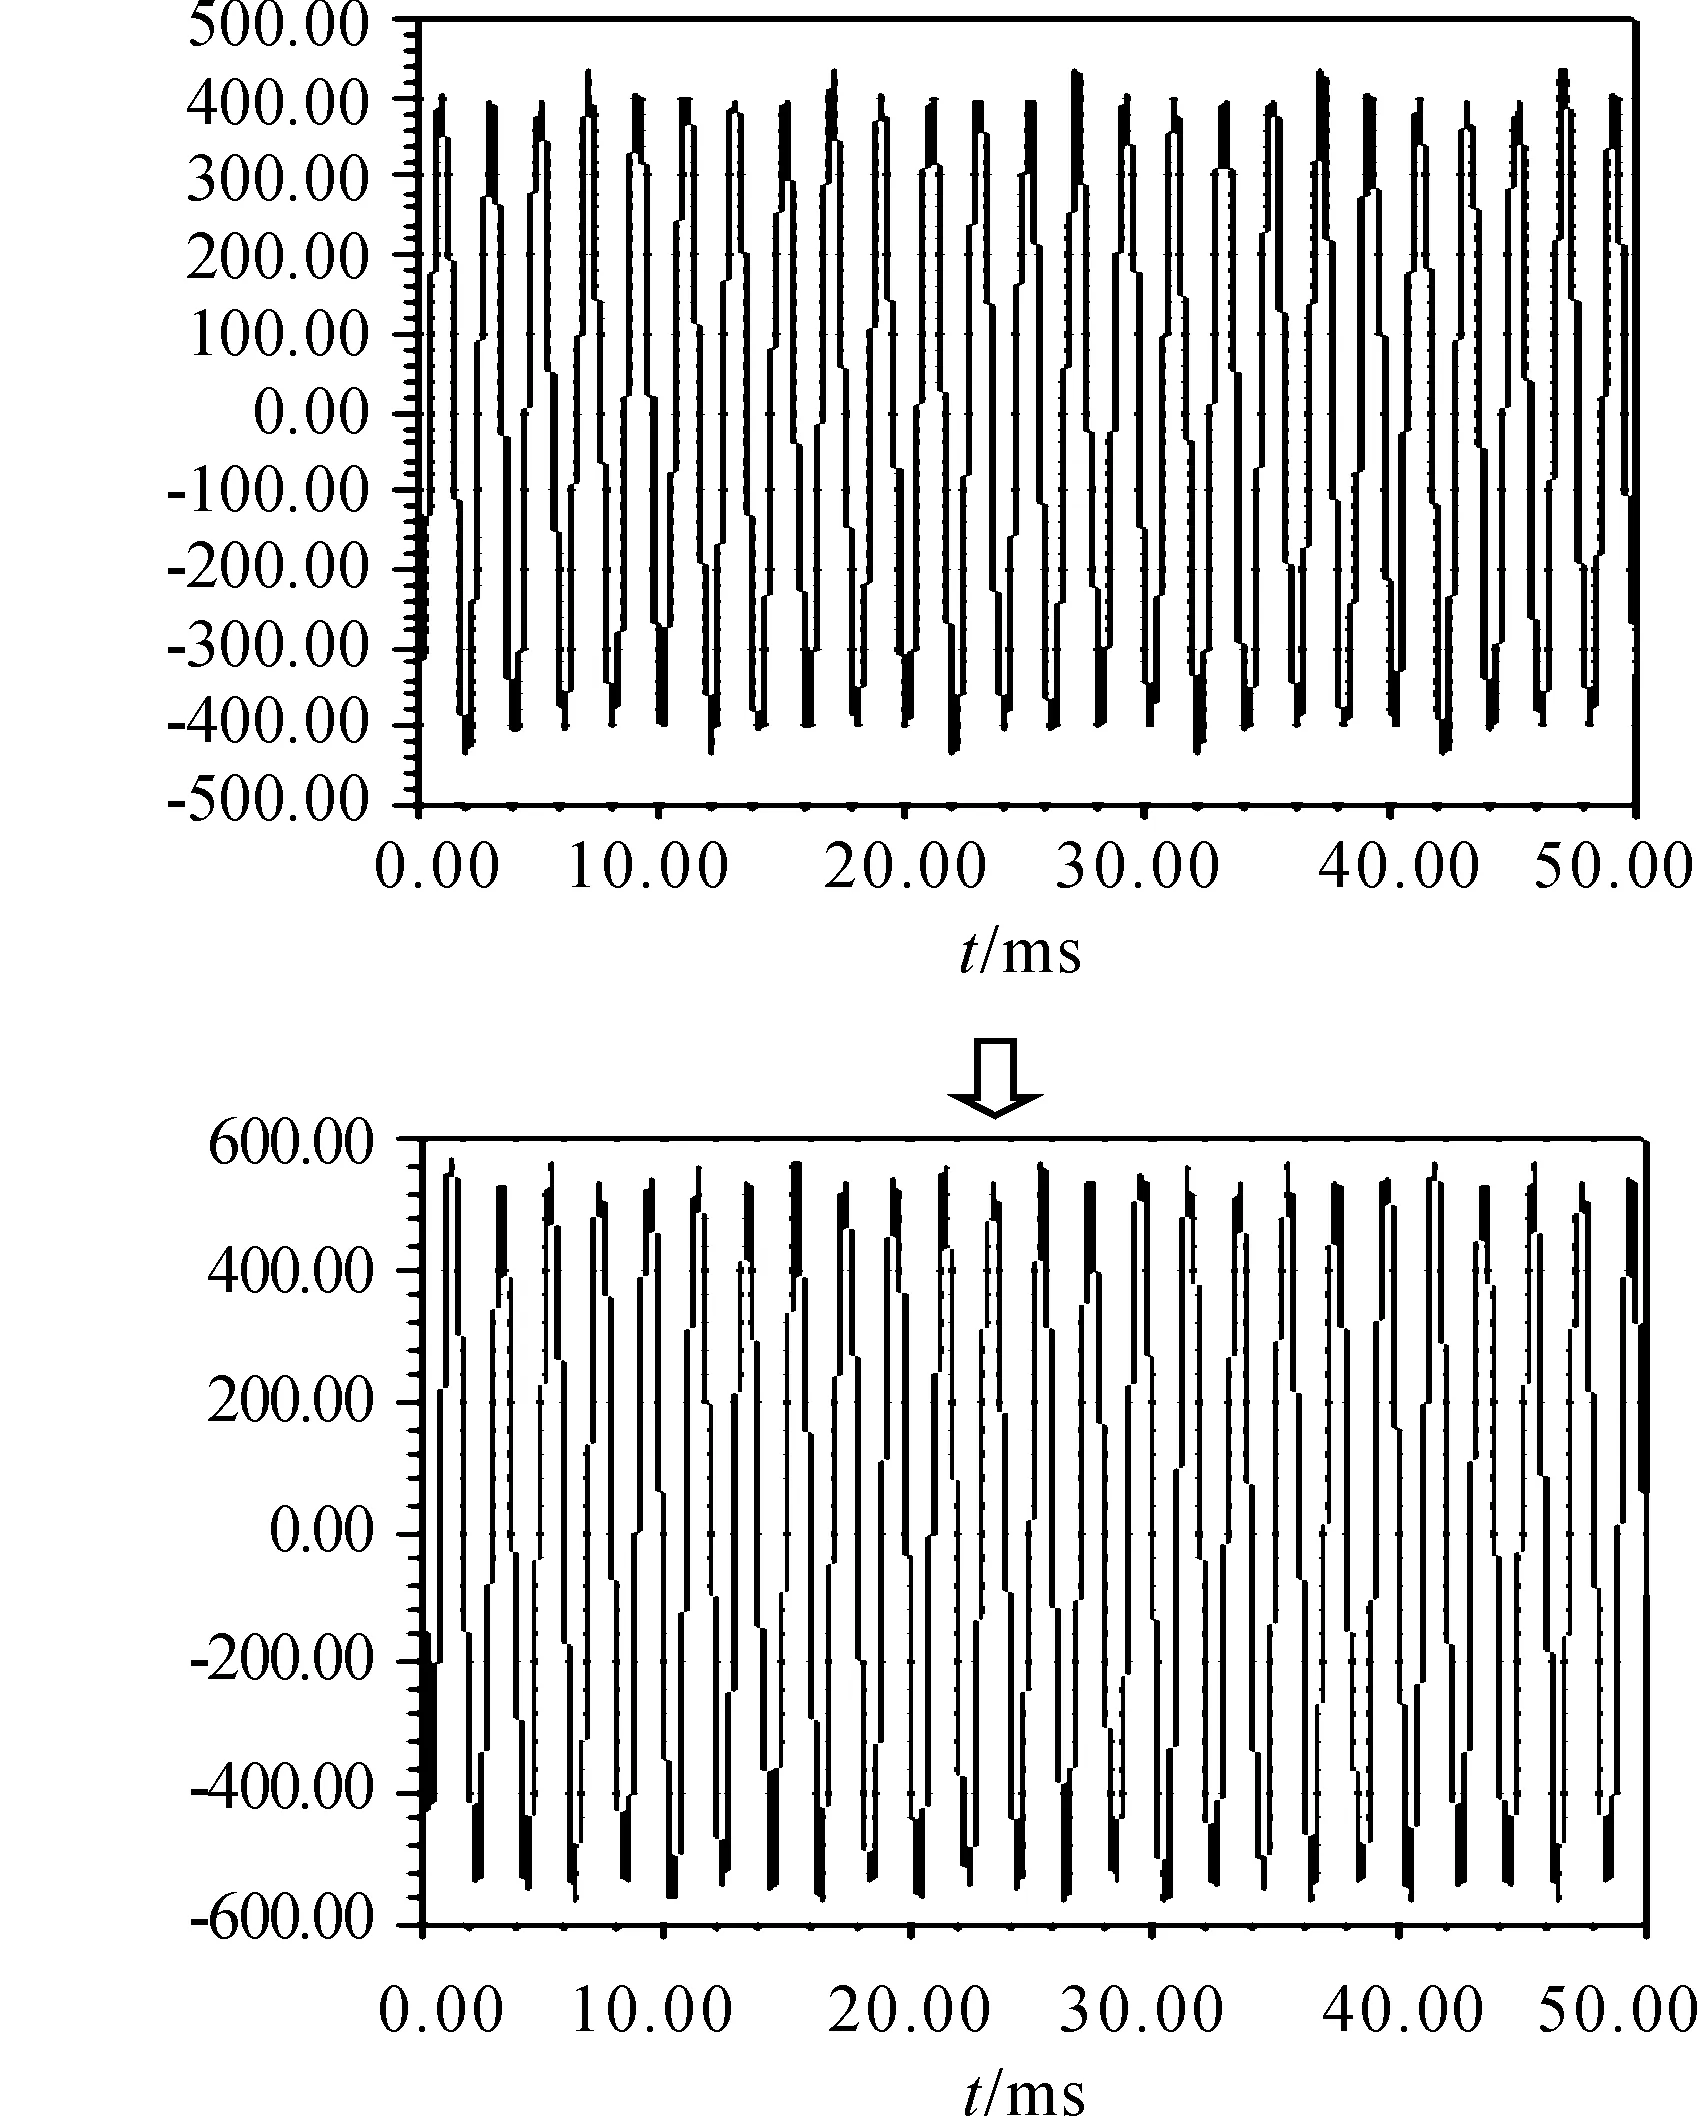
Fig.3 Compare the signal amplitude between before and after optimization
The size of the ranges can evaluation the size order for parameters effect indication signal strength, but in order to study whether the parameters’ influence on the test result is significant, it is needed to use the variance analysis method of orthogonal variance to get significant comparison of variance factors. According to the remarkable results, time-grating structure parameters design can be targeted done, and improve its signal amplitude.
5.Induction signal variance analysis of the time-grating structure
5.1.Theprincipleofvarianceanalysiswithorthogonalexperiment[3-4]
The variance analysis as a way to solve the basic problem is that by analyzing test data to study the factors that influencing the outcome of the trial is significant. The main calculating formula is as follows:
(8)
Defined statistic (Fi):

(9)
IfF0.01(fi,fE)>Fi≥F0.05(fi,fE),iis the significant factor. IfFi≥F0.01(fi,fE),iis the highly significant factor, while ifFi 5.2.Varianceanalysisoftime-gratingstructuralparameters[5] By multivariate statistical analysis according to the above principle, the results table of time-grating structure parameter analysis is obtained (Tab.3). It shows that the air gap width between the stator and rotor (A), whosefvalue reaches 2.064, is the most influential factor of indication signal strength among the four structural parameters. Thus during the design process, the key parameter could be priority controlled to improve the signal amplitude. Thefvalue of each parameter by large to small is significantly ordered to beFA>FC>FB>FD. This analysis result coincides with the range analysis. Tab.3 Results of variance analysis on structure parameters of Time-grating sensor Based on the electromagnetic analysis, combinning the application of multivariate statistical analysis to study indication signal of Time-Grating with Variable Coupling Coefficient with orthogonal experiment, the following conclusions can be drawn: 1) It is easy for designers to intuitively observe time-grating sensor internal magnetic field distribution and get any combination of structural parameters of the pendulous through the electromagnetic analysis . 2) Based on range analysis of the indication signal values at 16 species of parameters combination, the order of the influence level on the signal strength is obtained asA,C, and thenB,D. The optimal anti-vibration structure parameters combination isA2B2C4D3. It means the width of air gap width between the stator and rotor is 0.300 mm,the stator tooth width is 1.500 mm, the tooth width ratio of rotor and stator is 4∶1, and the tooth thickness is 3.000 mm. Before optimization signal strength is 0.647 V, and the optimized one is 0.751 V, increased by 16.1%. 3) By the variance analysis with orthogonal experiment, it is shown that the significant sequence of five parameters which influence the fundamental frequency isFA>FC>FB>FD. This analysis result coincides with the range analysis. The air gap width between the stator and rotor (A), the tooth width ratio of rotor and stator (C), are less influential than them. However, the stator tooth widths (B) and the tooth thickness (D), aren’t the significantly influential factor. It could greatly short the testing cycles, reduce the design cost and significantly improve the product reliability, with the combining application of the finite element simulation, orthogonal experiment method and the multivariate statistical analysis method in engineering design, optimization and analysis. This method is not only suitable for other engineering fields, but also has large practical engineering value. [1] YANG Wei,PENG Donglin,ZHU Ge. Design of time grating senor based on variable coupling coefficient transformer[J].Chinese Journal of Scientific Instrument,2006,27(11);1403-1405. [2] Law R C,Raymond Cheang,Tan Y W.Thermal performance prediction of QFN packages using artificial neural network (ANN)[Z].International Electronic Manufacturing.Technology,2006(IEMT2006):50-54. [3] Tsai M J.Optimal laser-cutting parameters for QFN packages by utilizing artificial neural networks and genetic algorithm[J].Journal of Materials Processing Technology,2008(1/2/3):1-14. [4] Nelson R A. Geologic analysis of naturally fractured reservoir[M]. Boston:Gulf Professional Publishing House,2001:40-78. [5] WU Zhaohua,HUANG Chunyue,ZHOU Dejian,Study on solder joint reliability of ceramic ball grid array component based on design of experiment method[J]. China Welding,2006(3):68-73. 基于ANSOFT有限元仿真的变耦合系数型时栅结构优化设计 蒋艳云1a*,史经辉2,何 健1a,汤其富1a,余 磊1b 1.重庆理工大学 a.机械检测技术与装备教育部工程研究中心;b.远程测试与控制技术研究所,重庆 400054;2.常州出入境检验检疫局,江苏 常州 213003 为了提高变耦合系数型时栅感应信号的强度,选取其转齿和定齿间气隙宽度(A),定子齿宽(B),转子与定子齿宽比(C)和齿厚度(D)4个参数,采用水平正交表L16(45)采集16种不同参数组合的感应信号强度,对电磁仿真求解结果进行极差分析和方差分析。结果表明:最优结构参数组合A~D分别为0.300 mm、1.500 mm、4∶1、3.000 mm,优化后感应信号强度提高16.1%; 各参数影响信号顺序为:A>C>B>D,且A、C显著影响信号.该方法具有较强的工程实用价值。 时栅;ANSOFT仿真;极差分析;优化设计 TH86 2012-12-09 National Natural Science Foundation of China (50575235) *JIANG Yanyun. E-mail: 516311588@qq.com 10.3969/j.issn.1001-3881.2013.06.012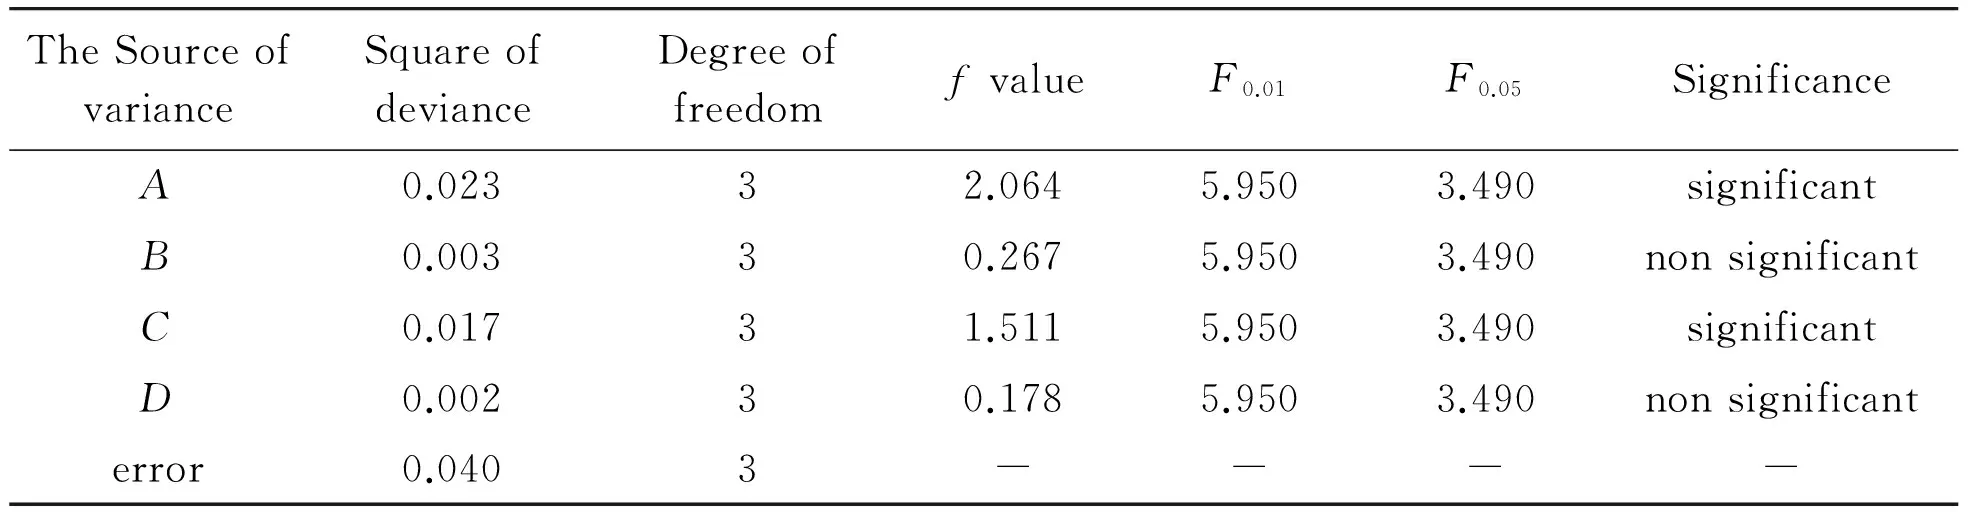
6.Conclusions
猜你喜欢
杂志排行

机床与液压的其它文章
- Research and Realization of the Control System for Cement Screw Packing Machine Based on MCGS and S7-200PLC
- The Analysis and Countermeasure of Centrifugal Atomizer Nozzle Block Up
- Static and Dynamic Characteristic Analysis for Vehicle MRF Damper
- Multi-physics Coupling of Hydraulic System
- Research of Production Configuration Management Based on the Internet of Things-mixed Cloud Enterprise
- Research and Design of Embedded Serial Device Server on the DNC System