Natural variation of an autophagy-family gene among rice subspecies affects grain size and weight
2024-03-07ShiyingHungPengWngCijingLiQingwenZhouToHungYicongCiQinChengHuiWngQiZhongZhihoChenLipingChenHohuHeJinminBin
Shiying Hung, Peng Wng, Cijing Li, Qingwen Zhou, To Hung, Yicong Ci, Qin Cheng,Hui Wng, Qi Zhong, Zhiho Chen, Liping Chen, Hohu He,*, Jinmin Bin,*
a Key Laboratory of Crop Physiology, Ecology and Genetic Breeding, Ministry of Education.Jiangxi Agricultural University, Nanchang 330045, Jiangxi, China
b Weill Cornell Medical, Immunology and Microbiology, 1300 York Avenue, Box 62, New York, NY 10065, USA
Keywords:Grain size GW3a Autophagy Starch content
ABSTRACT Elucidating the genetic basis of natural variation in grain size and weight among rice varieties can help breeders develop high-yielding varieties.We identified a novel gene, GW3a (Grain Weight 3a)(LOC_Os03g27350),that affects rice grain size and weight.gw3a mutants showed higher total starch content and dry matter accumulation than the wild type(WT),Nipponbare,suggesting that GW3a negatively regulates grain size and weight.Moreover,our study found that GW3a interacted with OsATG8 by cleaving it,suggesting that GW3a may be involved in the assembly of autophagosomes and starch degradation in plants.The haplotype analysis of GW3a showed functional differences between indica and japonica rice.Taken together, we conclude that GW3a is expressed in the autophagosome pathway regulating starch metabolism in rice, affecting yield-related traits, such as grain size, grain weight and thousand grain weight(TGW).Our findings also shed new light on autophagy-mediated yield trait regulation,proposing a possible strategy for the genetic improvement of high-yield germplasm in rice.
1.Introduction
Rice (Oryza sativa L.) is one of main food crops that feeds more than half of the global population[1].Grain size,which consists of grain length, width and thickness, is a key determinant of grain yield in rice [2–4].The dry matter in the rice endosperm is composed of 80%starch,and insufficient starch biosynthesis influences rice grain size and yield [5].Autophagy is a massive degradation process by which eukaryotic cells recycle intracellular components, and is involved in leaf starch degradation in plants [6,7].However, the effects of autophagy on crop yield-related traits,including grain size and weight, remains unknown, as do the molecular mechanisms of autophagy in starch biosynthesis.
Autophagy (ATG) is a cellular-degradation pathway conserved among eukaryotes including yeast, worms, insects, plants, and mammals [8,9].Autophagy plays an important role in multiple stages of plant growth and development, including nutrient cycling, cellular senescence and apoptosis, and starch degradation[7,10,11].Many components of autophagy have been characterized, including the ATG1/ATG13 protein kinase complex,ATG9/2/18 transmembrane complex, phosphatidylinositol 3-kinase (PI3K), ATG12-ATG5 and ATG8-PE (ATG8-phosphatidyle thanolamine) from autophagic vesicles, which act in multiple stages of autophagy [12,13,14].ATG8, a core component of autophagy, interacts with and is cleaved by the ATG4 protein to affect starch degradation [15,16].
Interestingly,the silencing autophagy-related genes resulted in excessive starch accumulation in Nicotiana benthamiana and in atg mutants in Arabidopsis thaliana, suggesting that autophagy is involved in starch metabolism in plants [7].Chloroplast degradation is triggered by blocking the metabolism of starch breakdown in both maltose excess1 (mex1) and the disproportionating enzyme1(dpe1) double mutant, indicating a connection between carbohydrate metabolism and autophagy function [17,18].ATG genes may physically promote starch enrichment in seeds of Arabidopsis by regulating the assembly of autophagosomes and facilitating their function [19].
In rice, the starch degradation pathway in the endosperm of osatg7-1 mutants is aberrantly activated, and the seeds are chalky with smaller grains and lower starch content, indicating that autophagy functions in metabolic regulation during endosperm development [20].OsATG8a overexpression increases the number of effective paniclelets and decreases the number of solid grains per panicle, the seed set rate and TGW.Meanwhile, OsATG8b and OsATG8c-mediated increasing autophagy regulates yield by yieldrelated traits[21–24].However,the specific function of the autophagy in rice grain development and the molecular mechanisms underlying starch degradation have remained unknown.
In this study, we identified an important regulatory factor in autophagy, GW3a, by genome-wide association study (GWAS) in rice [25–27].GW3a (LOC_Os03g27350), encoding a cysteine protease ATG4 interacting with OsATG8a/b/c in vitro,negatively regulates rice grain size and weight by controlling starch biosynthesis.Furthermore, Functional difference analysis in GW3a between indica-japonica subspecies and investigation of transgenic plant traits shows that GW3a knockout could increase rice grain size and grain weight via influencing starch content and grain development.
2.Materials and methods
2.1.Plant materials and environments
A set of 211 rice cultivars was used for GWAS based on grain size phenotypes previously reported [28], and candidate genes were identified as previously described[29].Nipponbare was used as a wild-type (WT) plant.gw3a and osatg8a mutants were generated in the Nipponbare background by CRISPR/Cas9.GW3a overexpression lines were also generated in the Nipponbare background.The plants were planted during the 2021 and 2022 crop seasons at the experimental field of Jiangxi Agricultural University,Nanchang,Jiangxi province, China, and T2-generation plants were used for phenotyping.
2.2.Transcriptome analysis
Two rice(Oryza sativa)varieties,indica cv.9311 and japonica cv.Nipponbare,were used for transcriptome analysis.These two varieties were grown in the early (March to July) and mid (May to September)crop season of 2018 at the experimental field of Jiangxi Agricultural University, Jiangxi province, China (28°45′36′′N,115°22′58′′E).From kernels of 9311 and Nipponbare collected at the 5th, 10th and 15th day after flowering, total RNAs were extracted with the Total RNA Purification Kit TRK1001 (LC Sciences, Houston, TX, USA) and sequenced on an Illumina HiSeq 4000 sequencer at LC Sciences (Houston, TX, USA).The RNA-seq data were analyzed using the reference method [30].
2.3.Phenotypic trait measurement and histological observation
During rice maturation, traits were measured including grain length, grain width, TGW, panicle length, grains per panicle, plant height and effective panicle number.At the grain-filling stage,grain length,grain width,TGW,and dry matter accumulation were recorded.Fifty husked and 50 dehusked grains at the 5, 10 and 15 day after fertilization(DAF)were carefully weighed.Young paniclelet glumes were used to observe the dynamic development of the endosperm.Young paniclelet hulls were used to generate paraffin sections for observation with a scanning electron microscope (S-3000 N, Hitachi, Japan) [31].
2.4.Spatiotemporal expression patterns of GW3a
To determine the subcellular localization of GW3a, the fulllength coding sequence (CDS) of GW3a without a stop codon was fused into the N-terminus of green fluorescent protein(GFP)driven by the 35S promoter to obtain the pro35S:GW3a-GFP plasmid,which was transformed into rice protoplasts for subcellular localization of GW3a.Fluorescence was observed with an LSM 900 confocal laser scanning microscope (Zeiss).The GW3a-GFP fusion protein was transiently expressed in Nicotiana benthamiana mesophyll cells by Agrobacterium-mediated infiltration, and fluorescence was captured at 72 h after infiltration with a confocal laser scanning microscope [32].
To identify the spatial expression pattern of GW3a, the promoter region, a 2000-bp upstream fragment of GW3a start codon,was cloned into the pCAMBIA-1305 vector to create an pGW3a:GUS construct for generating pGW3a:GUS transgenic plants.β-Glucuronidase activity was analyzed using pGW3a:GUS transgenic rice plant tissues by histochemical staining assay.GW3a expression in roots, leaves, leaf sheaths, young panicles,and panicles after flowering was measured by quantitative reverse transcription PCR (RT-qPCR) assays.
2.5.Determination of the interaction between GW3a and OsATG8 in vivo and in vitro
OsATG8 was first predicted as a candidate protein interacting with GW3a by String 12 server (https://www.string-db.org/) [33].Yeast two-hybrid (Y2H) assays were performed to identify the binding of GW3a to OsATG8 in vivo.The full-length CDS of OsATG8 was cloned into the vector pGADT7 for the AD- OsATG8 plasmid.The full-length CDS of GW3a was cloned into the vector pGBKT7 for the BD-GW3a plasmid [34].AD-OsATG8/BD-GW3a plasmids were co-transformed into the yeast strain AH109.Cotransformants were selected on SD-Leu-Trp plates and SD-Leu-Trp-Ade-His plates from a Yeast Two-Hybrid Media Kit (Coolaber,China).pGBKT7-EUI/pGADT7-OsDSK2a and pGBKT7/pGADT7 were separately used as positive and negative controls.
To confirm the results in yeast cells, in vitro protein pull-down assays were applied.OsATG8 was cloned into the vector pGEX-4 T-1 containing a glutathione S-transferase(GST)tag for OsATG8a-GST plasmid, and GW3a was inserted into the vector pET-28a (+) containing a 6× His tag for GW3a-6 × His plasmid [34].The vectors were separately transformed into the Escherichia coli BL21 (DE3)strain (Tsingke, China) for protein expression.Purified OsATG8a-GST or GST (200 μg) and 200 μg purified GW3a-His were mixed into 1 mL of GST pull-down buffer (20 mmol L-1Tris-HCl, pH 8.0, 200 mmol L-1NaCl, 1 mmol L-1MgCl2and 0.5% LgepalCA-630) and incubated at 4 °C for 6 h.After incubation, 100 μL GST beads (Zoonbio Biotechnology; China) were added to the mixture and incubated for 2 h at 4°C.After extensive washing and boiling,the pulled-down proteins were separated by SDS-PAGE gel electrophoresis, and then detected by immunoblotting with an anti-His antibody or an anti-GST antibody.
In addition, bimolecular fluorescence complementary (BiFC)assay is an efficient and convenient method to determinate the protein–protein interaction in vivo.GW3a were cloned into pVYNE vector for YN–GW3a plasmid, and OsATG8a/b/c were linked into pVYCE for YC–OsATG8a, YC–OsATG8b and YC–OsATG8c plasmids.All plasmids were transformed into Agrobacterium strain EHA105.Cultured cells of YN–GW3a/YC–OsATG8a,YN–GW3a/YC–OsATG8b,YN–GW3a/YC–OsATG8c were harvested and resuspended in infiltration buffer (10 mmol L-1MgCl2and 200 mmol L-1acetosyringone), and then kept at room temperature for 2–6 h in dark.Agrobacterium suspensions were infiltrated into rice protoplasts,and fluorescent signals were observed at 72 h after infiltration with the confocal laser scanning microscope.
2.6.In vitro GW3a cleavage activity
Purified OsATG8a substrates or its mutant substrates (250 ng)and the same amount of MBP-GW3a were incubated in 20 μL of PBS at RT for 30 min and 120 min, and then 5 μL of 5× SDS-PAGE loading buffer was added [15,35].After boiling at 100 °C for 10 min, the reaction mixtures were separated by SDS-PAGE, and then subjected to immunoblotting with anti-GST (Abmart) or anti-MYC (Abmart) antibodies.
2.7.Starch content measurement
For seedling assay, surface-sterilized seeds were plated on MS plates with or without 5 mmol L-13-MA (3-methyladenine) and grown under normal long-day conditions for 2 weeks.Samples were harvested at the end of the day or night and subjected to iodine staining.Detached leaves and young panicles were also stained with iodine for starch content.Iodine staining was repeated at least three times for each construct [7].
For starch quantification,leaves were decolorized with ethanol,dried, frozen in liquid N2, and homogenized into powder using a mortar and pestle.Starch content was measured with a starch content assay kit(Solarbio,China)[7].The activities of key starch synthesis enzymes were determined [36] using Micro Soluble Starch Synthase (SSS) Assay Kit, Starch debranching Enzyme (SBE) Activity Assay Kit, Granule-Bound Starch Synthase(GBSS)Activity Assay Ki, and Starch Branching Enzyme (SBE) Activity Assay Kit,all from Solarbio.
2.8.Observation and Western blotting of autophagosomes
Plants were grown in an artificial-climate chamber under 12 h light/12 h dark conditions.Leaf and root samples were collected and observed with the confocal laser scanning microscope.For monodansylcadaverine (MDC) staining, the leaves and roots were infiltrated with 100 μmol L-1E-64d (Sigma–Aldrich) in darkness for 8 to 10 h.After the dark treatment, the E-64d–infiltrated parts of the leaves were excised and immediately vacuum-infiltrated with 50 μmol/L MDC (Sigma–Aldrich) for 10 min, followed by washing with PBS buffer twice.MDC-incorporated structures were excited at a wavelength of 405 nm and detected at 400 to 580 nm.
To further observe autophagosome differences between WT and OE plants, mature leaves at the 5 DAF were collected and fixed as previously described [37].Samples were sliced into 80-nm ultrathin sections and micrographs were obtained with a transmission electron microscope(Hitachi,HT7800).Total protein of leaves from WT and OE plants was extracted and their autophagosome content was determined based on the abundance of OsATG8 protein expression detected by Western blot assay with the ATG8-specific antibody [38,39].
2.9.Haplotype analysis
To determine the association between the GW3a locus and grain yield, haplotype analysis was performed with 114 cultivars of 211 rice cultivars.The genomic DNA of each variety was used as template for GW3a amplification by PCR, and the PCR products were sent to Tsingke Biotechnology Co.for sequencing.
3.Results
3.1.Identification of GW3a as a major QTL regulating grain size by GWAS
In order to explore the main factors affecting the grain size in rice, a genome-wide association study (GWAS) was performed with a natural population containing 211 rice varieties from China using a mixed linear model approach in Tassel 5.2.81.Manhattan plots provide a global graphic view of GWAS resulting in all chromosomes for grain size in 2017NC, 2018NC, 2019HN and 2019NC(Fig.1A), and 10 QTL were identified (Table S1).
Among these QTL, a major QTL (lead SNP chr15686242) was identified as a candidate region explaining most of the phenotypic variation.There were 29 candidate genes within 100 kb upstream and downstream of the leading SNP chr15686242,according to the Rice Genome Annotation Project (https://rice.uga.edu/) (Fig.S2).The expression patterns of these 29 genes were analyzed with RiceVarMap (https://ricevarmap2.ncpgr.cn/v1/note/), revealing that three of them (LOC_Os03g27260, LOC_Os03g27310 and LOC_Os03g27350) were highly expressed in young panicles(Fig.S1).
To detect the major gene from the underlying QTL,RNA-seq was used to investigate transcriptional dynamics of grain development with the indica cv.9311 and japonica cv.Nipponbare seedlings at the 5, 10, and 15 day after fertilization (DAF) (Fig.S2; Table S3).A member of the autophagy family gene, GW3a(LOC_Os03g27350)encoding cysteine protease ATG4,showed significant differences in expression between indica cv.9311 and japonica cv.Nipponbare for the QTL that was selected (Fig.S3).
3.2.GW3a is a negative regulator of grain size and weight in rice
To investigate the functional roles of GW3a for grain size and weight in rice,we generated two independent GW3a mutants containing CRISPR-gw3a-1 (CR-1) and CRISPR-gw3a-2 (CR-2) in the Nipponbare background by CRISPR/Cas9 (Fig.1B).Meanwhile,GW3a-overexpressing lines,OE-1 and OE-2,were generated in Nipponbare background.Overexpressing plants showed significantly decreased grain length, grain width, TGW, and TGW of brown grains in comparison with wild-type plants, and the mutants showed significantly increased grain length, grain width, TGW and TGW of brown grains(Fig.1C–J),indicating that GW3a is a negative regulator of grain size and weight in rice.
No changes were detected in panicle length, effective panicle number, or number of grains per panicle.The gw3a knockout mutant plants were shorter in height and slightly higher in yields per plant than the WT plants,whereas the OE plants showed opposite phenotypes (Fig.S4).
3.3.GW3a regulates rice grain size and weight by controlling grain filling development
Insufficient starch biosynthesis affects grain size and yield in rice, which inspired our attention to the grain filling development of WT and gw3a mutants.No significant differences were investigated in grain size on the 5 DAF between WT and mutants.At the 10 DAF, the gw3a knockout mutants had larger grain sizes and higher TGW than the WT (+30.25%, +20.94 %), while the OE plants showed smaller grain sizes and lower TGW than the WT(-12.37%, -10.26%) (Fig.2A–B, E–G).The comparisons of grain sizes at the 15 DAF and TGW were consistent with that at the 10 DAF, and the differences reached 16.47% and 18.10%, respectively,while OE plants were lower at 16.07% and 20.11% than WT at the 15 DAF(Fig.2A–B,E–G).The gw3a mutants at the 10 DAF had a significantly higher filling rate than the wild type.gw3a mutants maintained this advantage in filling rate until seed maturity,while OE plants were lower than WT.We also measured the development of endosperm dry matter after flowering to complement the study of seed filling rate.Endosperm dry matter accumulation at the 5 DAF was significantly higher in the gw3a mutant than in the WT, while it was significantly lower in the OE plants than in the WT (Fig.2C, D, H), and this trend was maintained until the 10 and 5 DAF(Fig.2C,D,H),indicating that GW3a affects grain size and weight in rice by affecting grain filling development.
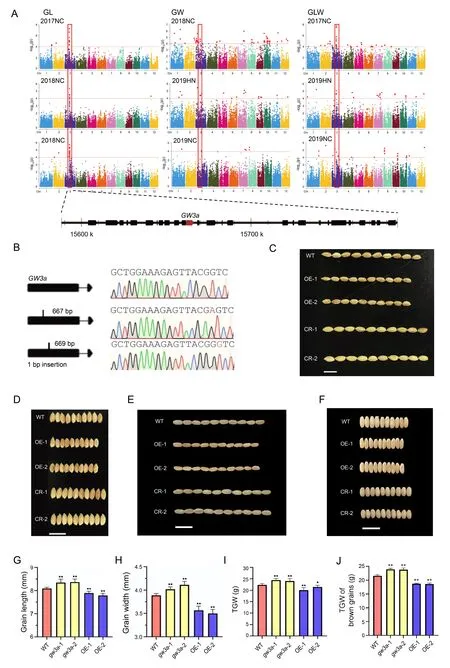
Fig.1.Genome-wide Manhattan plots of association mapping for grain size and phenotypes of GW3a transgenic plants.(A) SNPs of grain size in 2017NC, 2018NC, 2019HN and 2019NC.Red dots represent significant SNPs,NC represents Nanchang,and HN represents Hainan and candidate gene selection.(B)Two types of editing in gw3a mutants.(C)Comparison of ten-grain length between WT,gw3a and OE plants.Scale bars,1 cm.(D)Comparison of ten-grain width between WT,gw3a and OE plants.Scale bars,1 cm.(E) Comparison of ten-brown grain length between WT, gw3a and OE plants.Scale bars, 1 cm.(F) Comparison of ten-brown width between WT, gw3a and OE plants.Scale bars=1 cm.(G)Comparative histogram of grain length at maturity in(C).Values are mean±SD(n=50).(H)Comparative histogram of grain width at maturity in(D).Values are mean±SD(n=50).(I)Comparative histogram of TGW at maturity.Values are mean±SD(n=3).(J)Comparative histogram of TGW of brown grains at maturity.Values are mean ± SD (n = 3).P values were determined by Student’s t-test (**, P < 0.01; *, P < 0.05).
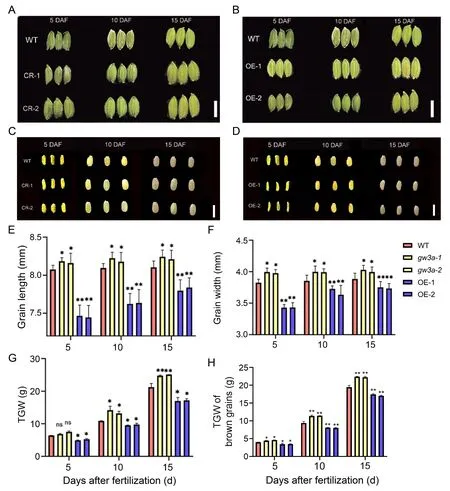
Fig.2.Dynamic analysis of grain development of grains.(A,B)Observation of dynamic grain development at 5,10 and 15 DAF.(C,D)Dynamic observation of dynamic husked grain development at 5, 10, and 15 DAF.(E) Comparison of grain length between WT, gw3a and OE plants.Scale bars, 5 mm.(F) Comparison of grain width between WT,gw3a and OE plants.Scale bars,5 mm.(G,H)Comparison of seed TGW and brown grains TGW between WT,gw3a and OE plants.Values in(E,F)(n=50)and(G,H)(n=3)are means ± SD.P values were determined by Student’s t-test (*, P < 0.05; **, P < 0.01).
3.4.Expression pattern and subcellular localization of GW3a
Because the spatial and temporal expression of a gene is crucial for its function,we first examined the expression pattern of GW3a by promoter (c.2000 bp upstream of the GW3a)-fusion with the encoding sequence of the reporter gene β-GLUCURONIDASE (GUS)(pGW3a: GUS).The pGW3a: GUS transgenic plants in Nipponbare background showed GUS signals in leaf blades, root tips, grain,and floral organs, the weak GUS signals were observed in stained leaves and the 1st DAF young panicles (Fig.3A–I).We then performed RT–qPCR with WT plants to validate the expression pattern of GW3a in rice tissues.GW3a was highly expressed in roots,young panicles at the 5 DAF,and sheaths relative to other tissues,such as leaf blades, florets and stems, consistent with the GUS staining results (Fig.3J).We then examined the subcellular localization of GW3a and observed that GW3a-GFP was located in the endoplasmic reticulum in Nicotiana benthamiana (Fig.3K), an observation in rice protoplasts supported by the subcellular localization of GW3a predominantly in the endoplasmic reticulum (Fig.3L).
3.5.GW3a cleaved the C-terminal of OsATG8
To identify the functions of GW3a in the autophagy pathway,the proteins associated with GW3a were predicted using String 12 server.Among those predicted proteins, we found that OsATG8a/b/c are closely related with GW3a.Then, we confirmed the associations between GW3a and OsATG8a/b/c by yeast twohybrid assays.The results showed that GW3a interacts with OsATG8a/b/c (Fig.4A).The pull down assays showed that GW3a-His was specifically pulled down by beads containing OsATG8a/b/c-GST but not by beads containing GST (Fig.4B).Meanwhile, BiFC assays showed that GFP signals were observed in the endoplasmic reticulum in rice protoplasts (Fig.4C) further confirming that GW3a interacts with OsATG8a/b/c.
To delve deeper into the interactions between GW3a and OsATG8a/b/c, OsATG8a was used as a typical protein and the substrate to detect enzyme activity of GW3a by cleavage reaction in vitro.We constructed GST-OsATG8a-MYC plasmid to obtain GST-OsATG8a-MYC protein, and we also generated the GW3a-MBP plasmid to obtain GW3a-MBP protein.The cleavage reaction assays in vitro showed that GW3a could cleave OsATG8a, leading to its loss of MYC tag detected by Western blot (Fig.4D).Because the 117th amino acid glycine (G117) was highly conserved in rice and Arabidopsis, we then hypothesized that G117 site of OsATG8a was also the cleaved recognition site for GW3a.To investigate whether the conserved G117 site affected the cleavage reaction between GW3a and OsATG8a in vitro, we mutated G117 into arginine (R) (G117R) using the site-directed mutagenesis and G117R mutant protein of OsATG8a was prepared and purified for the cleavage reaction in vitro.The G117R mutant protein of OsATG8a was not cleaved by GW3a (Fig.4D), indicating that GW3a could cleave OsATG8a by specifically recognizing G117.
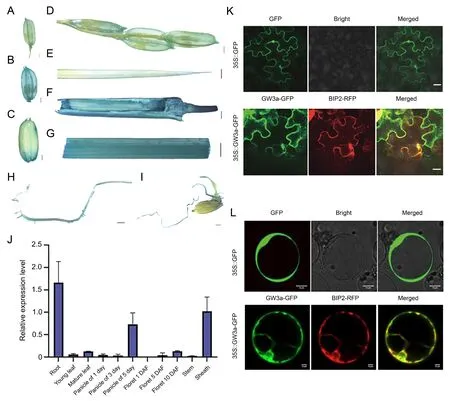
Fig.3.Spatiotemporal expression patterns of GW3a in rice.(A–I) GUS staining of various tissues from GW3a-GUS transgenic lines.Young panicles at one day (A, D), young panicles at five days (B), brown grains (C), leaf blades (E), leaf sheaths (F, G), roots (H, I).Scale bars, 500 μm.(J) Expression of GW3a in rice tissues in the WT (Nipponbare)background by RT-qPCR assays.Values are means ± SD (n = 3, biological repeats).(K, L) Subcellular localization of GW3a.Fluorescent signals in rice protoplast cells of 35S:GW3a-GFP.BIR2-RFP is a marker of the endoplasmic network.Scale bars, 20 μm.
To verify the function of OsATG8a, we generated loss-offunction mutants of OsATG8a by CRISP/Cas9.The grain size and weight analysis showed that both osatg8a-1 and osatg8a-2 showed larger grain size(+4.79%and+4.87%in length;+8.36%and+8.70%in width) and heavier TGW in grains (+6.62% and + 7.71%) and a heavier TGW of brown grains compared to WT (+12.23%and+9.65%)(Fig.S5),indicating that OsATG8a negatively regulates rice grain size and weight.
3.6.The GW3a-OsATG8 interaction affects autophagosome formation and in turn regulates rice starch content
To clarify the relationship between autophagy and starch degradation and accumulation, we treated WT, gw3a mutants and OE plants with or without the autophagy inhibitor 3-methyladenine(3-MA).In the untreated group, the starch content was higher at the end of the day than at the end of the night, and CR mutants showed significantly higher starch content than WT, while OE plants showed significantly lower starch content than WT(Fig.5A–C).In the treated group, the starch content was still slightly higher at the end of the day than at the end of the night,but there was no significant difference between starch content in the mutant and WT.Our findings suggest that autophagy is more active at night and affects starch accumulation in rice (Fig.5A–C).
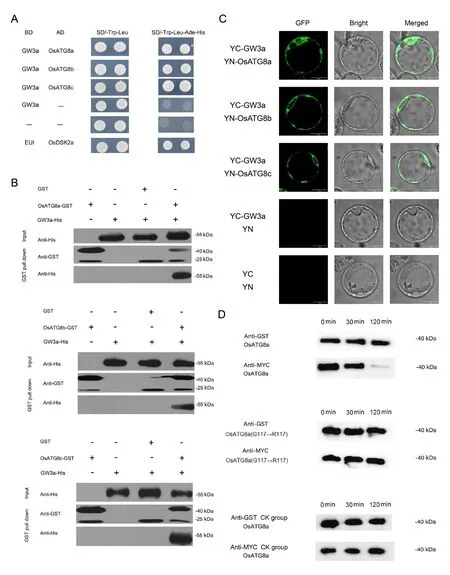
Fig.4.GW3a interacts with OsATG8 in vivo and vitro.(A)Yeast two-hybrid assays showing interactions between GW3a and OsATG8a/b/c.The interactions between pGBKT7-EUI/pGADT7-OsDSK2a and pGBKT7/pGADT7 were used as the positive and negative controls,respectively.(B)Pulldown assays verified the interactions between GW3a and OsATG8a/b/c in vitro.The GW3a-His fusion protein was incubated with OsATG8a/b/c-GST or only GST in GST agarose beads.OsATG8a/b/c-GST or only GST was used as bait,and the pulldown of GW3a-His was detected by anti-His antibody.(C)Bimolecular fluorescent complementation(BiFC)analysis of the GW3a and OsATG8a/b/c interactions in rice protoplasts.Scale bars, 20 μm.(D) Immunoblot assays verified that GW3a could cut the C-terminal of OsATG8a.
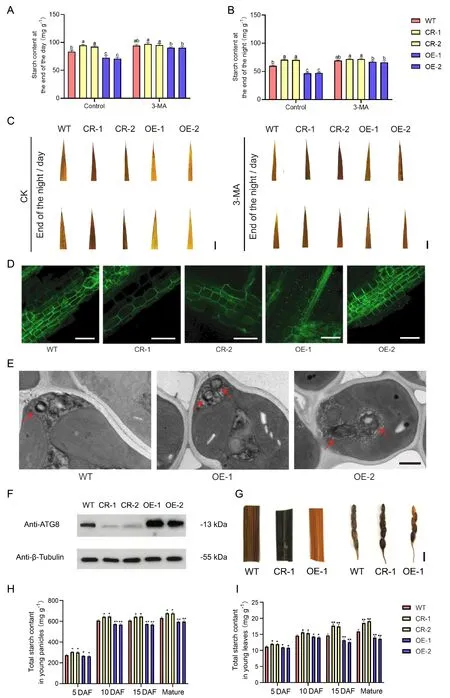
Fig.5.Detection of autophagosomes and starch content.(A,B)Measurement of leaf starch content in WT,gw3a and OE plants after 3-MA treatment.Values in(A,B)(n=3)are means±SD.P values were determined by Duncan’s test(*,P<0.05;**,P<0.01).(C)Iodine staining of WT,gw3a and OE seedlings after 3-MA treatment.Scale bars,1 cm.(D) Observation of autophagosome levels in WT, gw3a and OE leaves after dark processing.Scale bars, 50 μm.(E) Typical TEM images of autophagic structures in different materials after dark processing.In addition to the classical double membrane autophagy, the isolation membrane (autophagic precursor) was also observed in WT and OE plants,indicated by the red arrow.Scale bars,5 μm.(F)Detection of autophagosome levels in WT,gw3a and OE plants by Western-blot assays with ATG8 antibody.β-Tubulin was used as the internal reference.(G)Iodine staining of leaves and panicles at the 5 DAF in WT,gw3a and OE plants.Scale bars,1 cm.(H,I)Detection of starch contents in WT,gw3a and OE leaves, young panicles and grains.Values in (H, I) (n = 3) are means ± SD.P values were determined by Student’s t-test (*, P < 0.05; **, P < 0.01).
Leaves and roots of WT, gw3a mutants and OE plants were stained with MDC to observe autophagosomes by confocal microscopy.The number of autophagosomes in gw3a leaves was less than that in WT leaves, whereas significantly more autophagosomes were observed in OE than in WT leaves(Fig.5D).No significantly difference in autophagosome fluorescence was observed in gw3a and WT roots.We monitored autophagy activity by transmission electron microscopy(TEM),identifying the double membrane autophage and autophagic precursor structures in the cytoplasm of WT and OE plants (Fig.5E).Consistent with MDC staining results,autophage could be observed in WT and OE materials after dark treatment but not in gw3a plants’ leaves, and further confirmed that Western-blot assays with ATG8 antibody detected autophagy levels in the plants (Fig.5F), indicating that GW3a is involved in regulating autophagy activity.Besides, we then attempted to detect starch content in WT, OE and gw3a mutants.The staining reactions with iodine revealed that the starch content was higher in gw3a leaves than in WT leaves, while starch content in the OE leaves was lower than in WT leaves (Fig.5G).We continuously detected the starch contents of other tissues in WT, OE and gw3a plants.Starch contents in other tissues of gw3a were generally highest, and starch contents in OE tissues were lowest (Fig.5H,I).These results revealed that gw3a mutants had higher starch content and fewer autophagosomes, and OE plants had lower starch content and more autophagosomes.In the untreated group, the relative starch consumption of OE was significantly higher than that of WT and gw3a (Fig.S6).After 3-MA treatment, the starch consumption of OE plants was significantly decreased, and there was no significantly difference between WT and gw3a.This implies that plants will contain more starch if the autophagy process is inhibited.To summarize, different plant starch contents result from varying autophagy process; higher autophagy intensities cause starch degradation as shown in OE plants.
We measured dynamic activity of the key starch-forming enzymes including soluble starch synthase(SSS), starch branching enzyme (SBE), starch debranching enzyme (DBE) and granulebound starch synthase (GBSS) in the 5, 10 and 15 DAF plants.The results showed that the activities of SSS, SBE, DBE and GBSS showed an increasing and then decreasing trend after flowering in gw3a, WT, and OE plants (Fig.S7).The amylase activity of gw3a mutants was significantly higher and the amylase activity of OE plants was significantly lower than that of WT (Fig.S7).
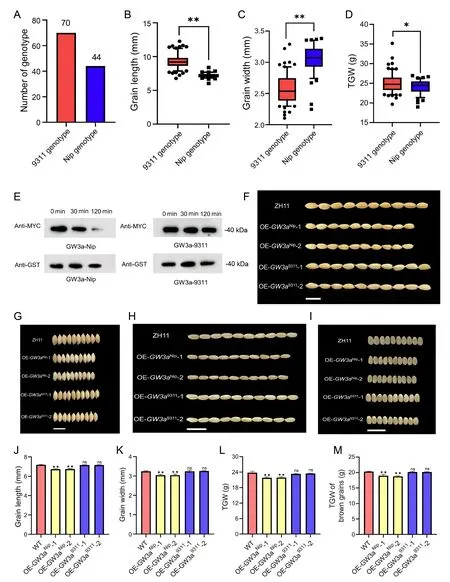
Fig.6.Phenotypic analysis of OE-GW3aNip and OE-GW3a9311 transgenic plants.(A–D)Genotypes and distribution of grain length,grain width and TGW in natural population.(E)Different roles of GW3a between indica c.v 9311 and japonica c.v Nipponbare.(F)Grain length comparison in WT,OE-GW3aNip and OE-GW3a9311 plants.Scale bars,1 cm.(G)Comparison of grain width between WT, OE-GW3aNip and OE-GW3a9311 plants.Scale bars, 1 cm.(H) Comparison of brown grain length between WT, OE-GW3aNip and OEGW3a9311 mutants.Scale bars,1 cm.(I)Comparison of brown grain width between WT,OE-GW3aNip and OE-GW3a9311 mutants.Scale bars,1 cm.(J–M)Comparative histogram of grain length and width at maturity in (F, G).Values are mean ± SD (n = 30).(I, J) Comparative histogram of seed TGW and brown grains TGW at maturity.Values are mean ± SD (n = 3).P values were determined by Student’s t-test (**, P < 0.01; *, P < 0.05).

Fig.7.Working model of GW3a.GW3a functions in grain development and starch biosynthesis by interacting with OsATG8 to affect the assembly of autophagosomes,autophagosomes are involved in degrading starch and thus affecting the grain size and weight (ER, endoplasmic reticulum.AAS, autophagosome assembly site).
3.7.Natural variation and haplotype analysis of GW3a
To further investigate the association between the GW3a locus and starch content in rice, we performed haplotype-association analysis with 114 varieties from our natural population, using the GW3a sequences of Nipponbare and 9311 as reference sequences.GW3a sequence alignments showed that the GW3a sequences of 44 varieties were consistent with Nipponbare genotypes and those of the other 70 varieties with 9311 genotypes(Fig.S8).The varieties with the GW3aNipgenotype generally had shorter grain shape and smaller TGW, and the varieties with GW3a9311genotype generally had longer grain shape and larger TGW (Fig.6A–D).These results explain the GW3a differentiation between indica and japonica subspecies, suggesting that targeted introduction of GW3a gene in indica rice varieties into japonica rice or targeted knockout of GW3a gene in japonica rice can help improve the yield of rice.
To identify the differing roles of GW3a in indica and japonica rice, we mixed the OsATG8a protein with the GW3a proteins encoded by GW3aNipand GW3a9311in vitro, separately.The results showed that the GW3a protein encoded by GW3aNiprecognized and cut the amino acid following the last glycine at the Cterminal of OsATG8, while the protein encoded by GW3a9311did not,indicating that the loss of function of GW3a inhibits the formation of autophagosomes and increases starch accumulation in plants, resulting in longer grain size and higher yields (Fig.6E).We generated GW3a overexpression lines by Agrobacteriummediated transformation of 35Spro:GW3aNipand 35Spro:GW3a9311vectors into the ZH11 background.Seeds and brown rice from OE-GW3aNiphad significantly smaller grain size (-6.19%and -6.13% in length; -7.67% and -7.61% in width) and weight(-8.36% and -7.74% in mature grains; -6.55% and -6.47% in brown grains), while seeds and brown rice from OE-GW3a9311did not differ from seeds and brown rice of ZH11 plants (Fig.6F–M).Phenotypic investigations of NIL lines constructed using Nip and 9311 materials showed that introduction of the GW3a gene from the Nip variety into the 9311 materials resulted in smaller grain size and a reduction in TGW, which further illustrates the differences in the function of GW3a between indica and japonica subspecies (Fig.S8).
4.Discussion
In rice, OsATG8a/b/c, OsATG7-1, OsATG9b and OsATG13a have been reported to be involved in regulating rice grain weight and yield [21,40].However, the regulatory network of grain weight and size is still largely unknown.Therefore, it is important to elucidate the molecular mechanisms by which autophagy affects rice grain weight and size to understand the roles of autophagy on biological processes.
In Arabidopsis, ATG4a regulates the assembly of autophagosomes by interacting with and cleaving ATG8 [15,41].Our finding of more autophagic vesicles were observed in OE plants.These results indicate that the overexpression of GW3a and OsATG8a/b/c in rice promoted the formation of more autophagosomes.Our study also strengthened the notion that GW3a interacts with OsATG8 by recognizing and cleaving the G at its C-terminal,thereby participating in regulating autophagosome assembly.
Cellular autophagy is a complex regulatory mechanism involved in multiple growth stages in plants, including plant growth and development, flowering, aging, environmental stress responses, and immune responses [15,42].In our study, gw3a mutants not only showed higher starch content after autophagy inhibitor treatment at the end of the night than did WT plants,but also showed stronger iodine staining and larger grain size,suggesting that GW3a affects the assembly and number of autophagosomes and the level of autophagy in plants by functioning in starch degradation.GW3a overexpression promotes starch metabolism in plants, while GW3a mutation increases starch accumulation,leading to changes in seed starch content,endosperm dry matter accumulation, and even differences in grain size and thousand grain weight.GW3a negatively regulates rice grain size and weight by interacting with OsATG8a/b/c to control starch biosynthesis.Our study shows that autophagy-mediated starch degradation affects grain size and weight, supporting the role of autophagy in rice growth and development.We propose a working model for GW3a mediation of rice grain size and weight.GW3a functions in modulating grain development and starch biosynthesis via cleavage of OsATG8 to affect the assembly of autophagosomes in endoplasmic reticulum,resulting in changes in content of key enzymes for starch synthesis, influencing grain size and weight (Fig.7).
Previous studies have shown that natural variations in gene regulatory regions result in differences in grain sizes and weights[43,44].Therefore, the GW3a sequences were analyzed with random 114 varieties from our natural population.We found that there were two different GW3a sequences as well as that in Nipponbare (GW3aNip) or in 9311 (GW3a9311), indicating that GW3a functions in the differentiation of indica-japonica rice.GW3aNipoverexpression in ZH11 background showed smaller grain size and lower grain weight and GW3a9311overexpression resulted in no significant differences in grain size and weight,suggesting that GW3a has the potential to be used to improve crop traits in future.
CRediT authorship contribution statement
Shiying Huang:Formal analysis, Visualization, Writing – original draft.Peng Wang:Formal analysis, Visualization, Writing –original draft.Caijing Li:Software, Visualization.Qingwen Zhou:Writing – review & editing.Tao Huang:Investigation.Yicong Cai:Investigation.Qin Cheng:Validation.Hui Wang:Software,Visualization.Qi Zhong:Investigation.Zhihao Chen:Software.Liping Chen:Investigation.Haohua He:.Jianmin Bian:Supervision, Conceptualization, Writing – review & editing.
Declaration of competing interest
The authors declare that they have no known competing financial interests or personal relationships that could have appeared to influence the work reported in this paper.
Acknowledgments
We thank the anonymous referees for their critical comments on this manuscript.This research was supported by the National Natural Science Foundation of China (32160485), Jiangxi Double Thousand Plan (jxsq2023201057), and Key R&D Plan of Jiangxi Province (20224BBF62001; 20224BBF61030).We thank Dr.Jingjing Cai and Dr.Yongdi Zhang of Nanchang University for their help with this study.
Appendix A.Supplementary data
Supplementary data for this article can be found online at https://doi.org/10.1016/j.cj.2023.12.006.
杂志排行

The Crop Journal的其它文章
- Flowering-time regulation by the circadian clock: From Arabidopsis to crops
- Global characterization of OsPIP aquaporins reveals that the H2O2 transporter OsPIP2;6 increases resistance to rice blast
- Drought-triggered repression of miR166 promotes drought tolerance in soybean
- The OsBSK1-2-MAPK module regulates blast resistance in rice
- Rice gene OsUGT75A regulates seedling emergence under deep-sowing conditions
- A telomere-to-telomere genome assembly of Zhonghuang 13,a widely-grown soybean variety from the original center of Glycine max