Large-scale loss-of-function perturbations reveal a comprehensive epigenetic regulatory network in breast cancer
2024-02-24YumeiWangHaiyanWangWeiShaoYuhuiChenYuGuiChaoHuXiaohongYiLijunHuangShashaLiDongWang
Yumei Wang, Haiyan Wang, Wei Shao, Yuhui Chen, Yu Gui, Chao Hu, Xiaohong Yi, Lijun Huang,Shasha Li, Dong Wang
1School of Basic Medical Sciences, State Key Laboratory of Southwestern Chinese Medicine Resources, Chengdu University of Traditional Chinese Medicine, Chengdu 611137, China; 2Department of Pathology, School of Medicine, Qinghai University,Xining 810001, China; 3Omics Biosciences Inc, Beijing 100871, China; 4Laboratory of Integrative Medicine, Clinical Research Center for Breast, State Key Laboratory of Biotherapy, West China Hospital, Sichuan University and Collaborative Innovation Center, Chengdu 610041, China; 5State Key Laboratory of Southwestern Chinese Medicine Resources, School of Pharmacy,Chengdu University of Traditional Chinese Medicine, Chengdu 611137, China; 6Department of Endocrinology and Metabolism,Guangdong Provincial Key Laboratory of Diabetology & Guangzhou Municipal Key Laboratory of Mechanistic and Translational Obesity Research, Medical Center for Comprehensive Weight Control, The Third Affiliated Hospital of Sun Yat-sen University,Guangzhou 510630, China
ABSTRACT Objective: Epigenetic abnormalities have a critical role in breast cancer by regulating gene expression; however, the intricate interrelationships and key roles of approximately 400 epigenetic regulators in breast cancer remain elusive.It is important to decipher the comprehensive epigenetic regulatory network in breast cancer cells to identify master epigenetic regulators and potential therapeutic targets.
KEYWORDS Epigenetic regulators; breast cancer; regulatory network; HTS2
Introduction
Epigenetics refers to the stable and heritable modifications that occur on chromosomes without changes in the DNA sequence.These modifications primarily involve covalent changes in histones and nucleic acids through processes,such as DNA methylation and histone modification.By utilizing these mechanisms, epigenetics govern gene expression through the initiation of transcriptional reprogramming,thereby assuming a vital role in cancer progression1-3.It is important to note that epigenetic modifications are dynamic and reversible that were initially identified by specialized chromatin-modifying enzymes known as “reader,” introduced by“writers” and subsequently removed by “erasers”.Dysfunction of these epigenetic modification-related enzymes serves as the molecular basis for various diseases.Fortunately, many of these enzymes can be targeted by drugs, and small-molecule inhibitors have shown the potential to reverse epigenetic modifications, thus improving patient outcomes4.For example,the histone deacetylase inhibitor, entinostat, has been shown to substantially reduce tumor formation and lung metastasis5.Another example is fisetin, a natural flavonoid that alters epigenetic modificationsviathe PTEN/AKT/GSK-3β pathway, leading to the inhibition of primary breast cancer tumor growth and a reduction in breast cancer lung metastasis6.These findings highlight the therapeutic potential of targeting epigenetic modifications for cancer treatment.
Extensive evidence has highlighted the intricate interplay between epigenetic modifications, particularly DNA methylation and histone modifications, in regulating various pathophysiologic processes.Both DNA methylation and histone deacetylation can repress gene transcription to some extent,whereas histone deacetylation can promote DNA methylation,thereby influencing the expression of atherosclerosis-related genes7.Histone methylation plays a crucial role in guiding DNA methylation patterns, and DNA methylation serves as a template for the re-establishment of histone modifications following DNA replication8.For instance, NSD1-mediated H3K26me2 is essential for recruiting DNMT3A, which subsequently maintains DNA methylation in intergenic regions9.The interplay between DNA methylation and histone acetylation promotes the overexpression of GDNF and contributes to the development of glioblastoma10.Abnormal DNA methylation and histone modification downregulates DLL3 and affects cell apoptosisviathe Notch signaling pathway in hepatocellular carcinoma11.During breast cancer tumorigenesis,the downregulation of ESR1 [estrogen receptor alpha (ERα)],which induces tumor growth and metabolic reprogramming,is influenced by changes in the acetylation of the ERα promoter region and miRNA expression profiles12.
Breast cancer is the most prevalent cancer and poses a considerable threat to women’s health, as reported by the International Agency for Research on Cancer (IARC) of the World Health Organization.Epigenetic regulation plays an important role in the progression and development of breast cancer.For example, the EZH2 gene encodes a histonelysine N-methyltransferase and its epigenetic modification(H3K27me3) collaborates with DNMT1-mediated CpG island methylation in the wwc1 promoter, participating in the invasion and migration of breast cancer13.EZH2 inhibitors promote the epigenetic modification of the downstream target gene, FOSB promoter, from H3K27me3-to-H3K27ac and recruit the C/EBPβ transcription factor to activate the transcription of the FOSB gene, thereby achieving anti-breast cancer effects14.Luteolin affects H3K27ac and H3K56ac in the MMP9 promoter regionviathe AKT/mTOR signaling pathway to regulate the expression of MMP9, thereby inhibiting the proliferation and metastasis of androgen receptorpositive breast cancer cells15.Consequently, a comprehensive exploration of the mutual regulation of epigenetic mechanisms and identification of potential epigenetic drug targets represent crucial areas of investigation in breast cancer epigenetic research.However, given the involvement of up to 400 epigenetic regulators, comprehensively studying the intricate interplay among the epigenetic regulators remains challenging.
High-throughput sequencing-based high-throughput screening (HTS2) is an emerging technology in the realm of high-throughput drug screening.HTS2effectively incorporates high-throughput sequencing techniques to construct gene expression signatures under various experimental conditions16,17.HTS2is particularly well-suited for largescale research in the field of epigenetic regulation.This technology possesses three key characteristics.First, HTS2offers high-throughput capabilities.A single HTS2assay enables simultaneous detection of gene expression for approximately 3,000 genes under 20,000 different conditions.Second, HTS2minimizes human errors.By using a robotic automated platform, this assay reduces human errors and ensures the accuracy and consistency of results.Third, HTS2has been shown to be a cost-effective solution.The cost is significantly lower than RNA sequencing (RNA-seq) and biochip technologies,amounting to < 1/10 of the total cost.This cost advantage translates to substantial savings in both time and resources17.Overall, HTS2represents a powerful tool for investigating large-scale epigenetic regulation.
Building upon the aforementioned findings, we combined small interfering RNA (siRNA) knockdown and an HTS2assay to construct gene expression signatures representing 400 epigenetic regulator perturbations in breast cancer.The epigenetic regulators were classified into five functionally-specific clusters.We also observed a positive association between CLOCK and CBX3 with respect to gene regulation, whereas CLOCK displayed a contrasting relationship with HDAC8.More importantly, we constructed a regulatory network of 299 epigenetic regulators, which revealed 8 modules and uncovered 10 master epigenetic regulators in breast cancer.This work not only facilitated a deeper understanding of the comprehensive regulatory mechanisms involving 299 epigenetic regulators but also provided crucial insight into the specific roles within the context of breast cancer.
Materials and methods
Cell culture
MDA-MB-231 cells were acquired from the China Infrastructure of Cell Line Resources (Beijing, China).The cells were cultured in RPMI-1640 medium (Gibco, Waltham, MA,USA) supplemented with 10% fetal bovine serum (Gemini,West Sacramento, CA, USA) and 100 units/mL of streptomycin and penicillin (Gibco).The cells were maintained in a 5%CO2atmosphere at 37°C.The cell lines underwent authentication based on PCR analysis of short tandem repeats and were verified to be free ofMycoplasmacontamination.
siRNA library
A total of 400 epigenetic regulators were selected based on text mining (Supplementary Table S1).These regulators encompassed proteins and their co-factors involved in various epigenetic modifications, such as histone methylation, acetylation, phosphorylation, erasure, and reading.Additionally,we included enzymes and co-factors associated with DNA and RNA modifications, as well as proteins harboring specific domains known to participate in epigenetic regulation,such as bromo, SET, tudor, PR, and PWWP domains18-22.The siRNA sequences targeting 400 epigenetic regulators were procured from Dharmacon (Lafayette, CO, USA) because of the availability of high knockdown efficiency and minimal offtarget effects.
siRNA library reverse transfection
High-throughput screening of the siRNA library was performed in 384-well plates.The library used for screening included siRNA oligos targeting 400 epigenetic genes (4 pooled siRNA oligos per gene, G-OLIBRARY440-329121542; Dharmacon),siRNA oligos of a negative, non-targeting control siRNA (negative siRNA control, D-001206-13-05-29120912; Dharmacon),a positive control siRNA pool (GAPDH, D-001144-01-05-29120909; Dharmacon), and a positive control siRNA pool(GFP, A08008; Genepharma, Lafayette, CO, USA).The negative siRNA control, positive control siRNA (GAPDH), and positive control siRNA (GFP) were included in five replicates for each plate.siRNA (10 μL per well) of each oligo pool was added at a concentration of 120 nM at the bottom of the 384-well plates using an Agilent automatic handler (Santa Clara, CA, USA).Opti-MEM (10 μL) containing 0.1 μL of INTERFER in transfection reagent ( 409-10; Polyplus, Beijing, China) was dispensed in each well and incubated for 30 min at room temperature(RT).MDA-MB-231 cells were plated on 384-well plates at 3000 cells per well and reverse-transfected with siRNA oligo mix.The final concentration of siRNA oligos in the medium was 20 nM.After 72 h at 37°C, cells were lysed for further detection.
Real-time quantitative PCR
Total RNA was extracted using the RNA isolation kit (Vazyme Biotech Co., Ltd., Nanjing, China), following the standard protocol provided by the manufacturer.Full-length cDNA was synthesized using the HiScript II Q RT SuperMix for qPCR kit (Vazyme Biotech Co., Ltd.).Real-time quantitative PCR was performed using ChamQ Universal SYBR qPCR Master Mix (Vazyme Biotech Co., Ltd.) with GAPDH serving as the reference gene.Data analysis was performed using the 2−ΔΔCTmethod.The related primers in this study are listed in Table 1.

Table 1 Primer sequences used in this study
HTS2 assay
HTS2represents a powerful high-throughput screening platform that utilizes gene expression signatures to quantitatively analyze cellular transcriptional profiles on a large scale.The HTS2procedure is as follows: cells were treated with knocking down perturbations in 384-well plates; the cells were lysed,and the mRNA in the lysate was bound to biotin-labeled oligo-dT and joined with streptavidin-coated magnetic beads;upstream oligos consisting of a 5′ universal primer site and 20 nt gene-specific sequences and downstream oligos containing another 20 nt gene-specific sequences adjacent to an upstream and 3′ universal primer site were annealed to the mRNA template and ligated with T4 ligase; the ligated products with 40 nt gene-specific sequences were used as templates and subjected to PCR amplification; the PCR primers contained an adapter and a barcode site, which identified samples; different genes from the same sample shared the same barcode; and the amplicons, including the barcode and 40 nt ligated oligo regions, were sequenced using next-generation sequencing technology (Supplementary Figure S1)17.
In this study we used the HTS2assay to facilitate high-throughput and comprehensive detection of expression changes in 2,986 genes in the cell sample following the knockdown of each epigenetic regulator.The 2,986 genes were selected based on involvement in 77 signaling pathways associated with major human diseases, such as tumor, immune, and metabolism pathways (Supplementary Table S2).We were therefore able to gather valuable insight into the transcriptional landscape and shed light on the impact of epigenetic regulatory modulation on gene expression.
Bioinformatics analysis for HTS2 data processing
The HTS2assay generates read data, which can then be mapped to probe sequences to obtain counts.Using R language, we calculated the counts per million (CPM) for each gene in every sample.Considering the spatiotemporal specificity of gene expression, we applied a filtering step to retain samples with a knockdown efficiency of > 50%, resulting in a final selection of 299 epigenetic regulators for further analysis.Guided by existing knowledge, we performed functional annotation for these 299 regulators, encompassing chromatin remodeling, DNA-binding, demethylation, methylation,histone acetylation, deacetylation, methylation, demethylation, RNA binding, and ubiquitination (Supplementary Table S3).To identify differentially- expressed genes (DEGs),DEseq2 and edgeR packages were used and compared to the siNC control.Genes displaying a fold-change > 2 and aPvalue < 0.05 after DESeq2 or edgeR analysis were considered to be DEGs23,24.
Next, we utilized the Rtsne package to cluster the 299 epigenetic regulators based on the expression of 2,986 genes following the knockdown of the epigenetic regulators25.Subsequently, the cluster-specific DEGs were obtained by comparing the gene expression signature profiles of the cluster to those of other clusters using DESeq2.The functions of the cluster were the functions enriched by the clusterspecific DEGs by the clusterProfiler package.Subsequently,the corrplot package was used to perform correlation analyses based on the fold-changes of 2,986 genes following knockdown of the epigenetic regulators26.The positive correlations had an R > 0.56, and the negative correlations had an R < −0.2.The clusterProfiler package was used for Gene Ontology (GO) and Kyoto Encyclopedia of Genes and Genomes (KEGG) enrichment analyses.To visualize the results, we utilized R packages, such as pheatmap, barplot,and ggstatsplot27-29.
Construction and analysis of the epigenetic regulatory network
The regulatory network was constructed based on the gene expression signatures of 299 epigenetic regulators.Specifically,if one epigenetic regulator showed significant differential expression after the knockdown of another epigenetic regulator, we considered that there was a regulatory relationship between these two epigenetic regulators and established the edge between the epigenetic regulators in the network.Then,the network was displayed and analyzed using Cytoscape,which enables a comprehensive exploration of the regulatory landscape and interconnections among the identified genes30.The MCODE Cytoscape plugin was used to identify functional modules in the regulatory network.Modules are highly interconnected regions within the network that are functionally related.
The topology of the network was obtained by the Analyze Network tool of Cytoscape.The edge count was the number of edges in a node.The indegree and outdegree were the number of edges going into a node and the number of edges going out of a node, respectively.The average ShortestPathLength was defined as the average number of steps along the shortest paths for all possible pairs of network nodes.The BetweennessCentrality was a way of detecting the amount of influence a node that has over the flow of information in the network.ClosenessCentrality and ClusteringCoefficient were measures of centrality and of the degree to which nodes in a network, respectively.The eccentricity of a node, v, was the maximum distance from v to all other nodes in the network.NeighborhoodConnectivity was defined as the average connectivity of all nearest neighbors of the node.
Online platforms
We obtained the gene expression RNA-seq data, as well as the corresponding survival data and phenotypes, from the TCGA Breast Cancer dataset, which was accessed through UCSC Xena (https://xenabrowser.net/).To perform survival and differential expression analyses of the 10 master epigenetic regulators, we utilized the Sangerbox tool, a free online platform for data analysis (http://sangerbox.com/home).For protein expression data, we accessed the online database known as The Human Protein Atlas (https://www.proteinatlas.org/)31.To generate Kaplan-Meier (KM) plots for the 10 master epigenetic regulators, we utilized the Kaplan-Meier Plotter website(http://kmplot.com/analysis/)32.By leveraging these online platforms, we were able to conduct comprehensive analyses and visualize the survival, differential expression, and protein expression patterns associated with the identified master epigenetic regulators.
ChIP-seq data analysis and visualization
We retrieved the ChIP-seq data of CBX3, CLOCK, HDAC8,and H3K9ac from the ChIP-Atlas database33.These datasets provided valuable insight into the binding patterns and genomic locations of the epigenetic regulators.To visualize the identified peaks on the respective targets, we employed the Integrative Genomics Viewer (IGV) software34.This widely used tool allowed us to examine the precise locations and distribution of the binding sites, which facilitated a comprehensive understanding of the regulatory roles.Furthermore, we performed detailed feature analysis of CLOCK, HDAC8, and H3K9ac peaks using the ChIPseeker package35.
Results
Profiling gene expression signatures through the HTS2 assay for knockdown of 400 epigenetic regulators in breast cancer cells
To comprehensively investigate the role of epigenetic regulators, we profiled gene expression signatures of 400 epigenetic regulators by using the HTS2assay.Initially, MDA-MB-231 cells were transfected in 384-well plates with the siRNAs.As a positive control, we seeded GFP-MDA-MB-231 cells in 3 wells for each 384-well plate.After transfection with siRNAs targeting GFP, the GFP fluorescence signal was significantly reduced,which indicated that the knocking down process of the 384-well plates was successful (Figure 1A).Subsequently, we performed the HTS2assay to detect changes in the expression of 2,986 genes with these 400 epigenetic regulators knocking down samples (Figure 1B and Supplementary Table S4).We assessed the expression changes across 1,264 cell samples(400 × 3 replicates + 64 siNC) obtained from the knockdown of the 400 epigenetic regulators, along with siNC samples serving as negative controls.As expected, we observed a significant reduction in the expression of each epigenetic regulator in the siRNA knockdown samples specifically targeting this gene compared to samples in which other epigenetic regulators were knocked down (Figure 1C and Supplementary Figure S2).Additionally, we performed RT-qPCR experiments on cell samples of siHADC8 and siKAT5, which were randomly selected.The results showed that the knockdown efficiencies were > 80% for both siHDAC8 and siKAT5 (Figure 1D), suggesting highly efficient of siRNA knockdown among all the epigenetic regulators.
To further validate the gene expression signatures generated from HTS2, we performed RNA-seq on cell samples of siNC and siKAT5, which were randomly selected.The analysis revealed a substantial overlap between the upregulated genes identified through KAT5 knockdown in HTS2data and those observed in RNA-seq data following KAT5 knockdown [normalized enrichment score (NES) = 1.87,P< 0.001, false discovery rate (FDR) < 0.001; Figure 1E].Similarly, a consistent pattern was observed for the downregulated genes, wherein the genes identified as downregulated in HTS2data upon KAT5 knockdown also exhibited significant downregulation in the RNA-seq data (NES =−1.76,P< 0.001, FDR < 0.001; Figure 1F).Furthermore,we compared gene expression signatures resulting from the knockdown of HDAC1, HDAC2, HDAC3, HDAC4, HDAC6,HDAC8, and HDAC9 generated by HTS2with in-house HTS2data for PCI-34051, a small-molecule inhibitor specifically targeting HDAC8.As expected, the gene expression regulated by HDAC8 was most similar to the gene expression regulated by PCI-34051 (Figure 1G).Additionally, the upregulated genes of HDAC8 showed significant enrichment among the upregulated genes affected by PCI-34051 (NES =1.69,P= 0.001), while the downregulated genes of HDAC8 were significantly enriched among the downregulated genes influenced by PCI-34051 (NES = −1.49,P= 0.0149; Figure 1H).These findings provided compelling evidence supporting the reliability of the gene expression signatures derived from siRNA knockdown of 299 epigenetic regulators using the HTS2assay.
Identification of functional clusters of epigenetic regulators based on gene expression signatures
Due to the spatiotemporal specificity of gene expression, we selected 299 epigenetic regulators with a knockdown efficiency of > 50% for further analysis.Utilizing these gene expression signatures comprising 299 epigenetic regulators,we classified these regulators into 5 clusters (Figure 2A and Supplementary Table S3).Notably, cluster 5 emerged as the only cluster encompassing regulators involved in all nine functional categories (Figure 2B).Clusters 1 and 3 lacked RNA binding-related epigenetic regulators, while cluster 2 exhibited no involvement of DNA demethylation or ubiquitin-related regulators.Furthermore, statistical analysis was performed for each epigenetic modification.We observed an enrichment of epigenetic regulators associated with histone acetylation and deacetylation in clusters 3 and 4, respectively.Cluster 1 was characterized by epigenetic regulators linked to histone demethylation and clusters 4 and 5 harbored epigenetic regulators involved in histone methylation (Figure 2C).

Figure 1 Continued
Additionally, we performed functional annotation on the common DEGs that were defined as genes exhibiting differential expression in at least one-half of the epigenetic regulator perturbations within a specific cluster.Intriguingly, the functions of the common DEGs within each cluster were significantly distinct, indicating distinct functional roles for each cluster (Figure 2D-2H).For example, cluster 1 predominantly contributed to endocrine system development and myeloid leukocyte differentiation (Figure 2D).Cluster 2 was primarily associated with glucocorticoid metabolic processes (Figure 2E).Cluster 3 exhibited regulation related to immune regulation, particularly T-cell regulation (Figure 2F).Epigenetic regulators in cluster 4 played a role in apoptosis regulation, while cluster 5 was predominantly involved in histone deacetylation (Figure 2G, 2H).These findings underscored the existence of intricate interactions among different epigenetic modifications and suggested that epigenetic regulators within the same class of modifications exhibit diverse functional roles.
Significant gene expression similarities exist between BAZ2B and SETMAR, as well as between CLOCK and CBX3

Figure 1 Continued
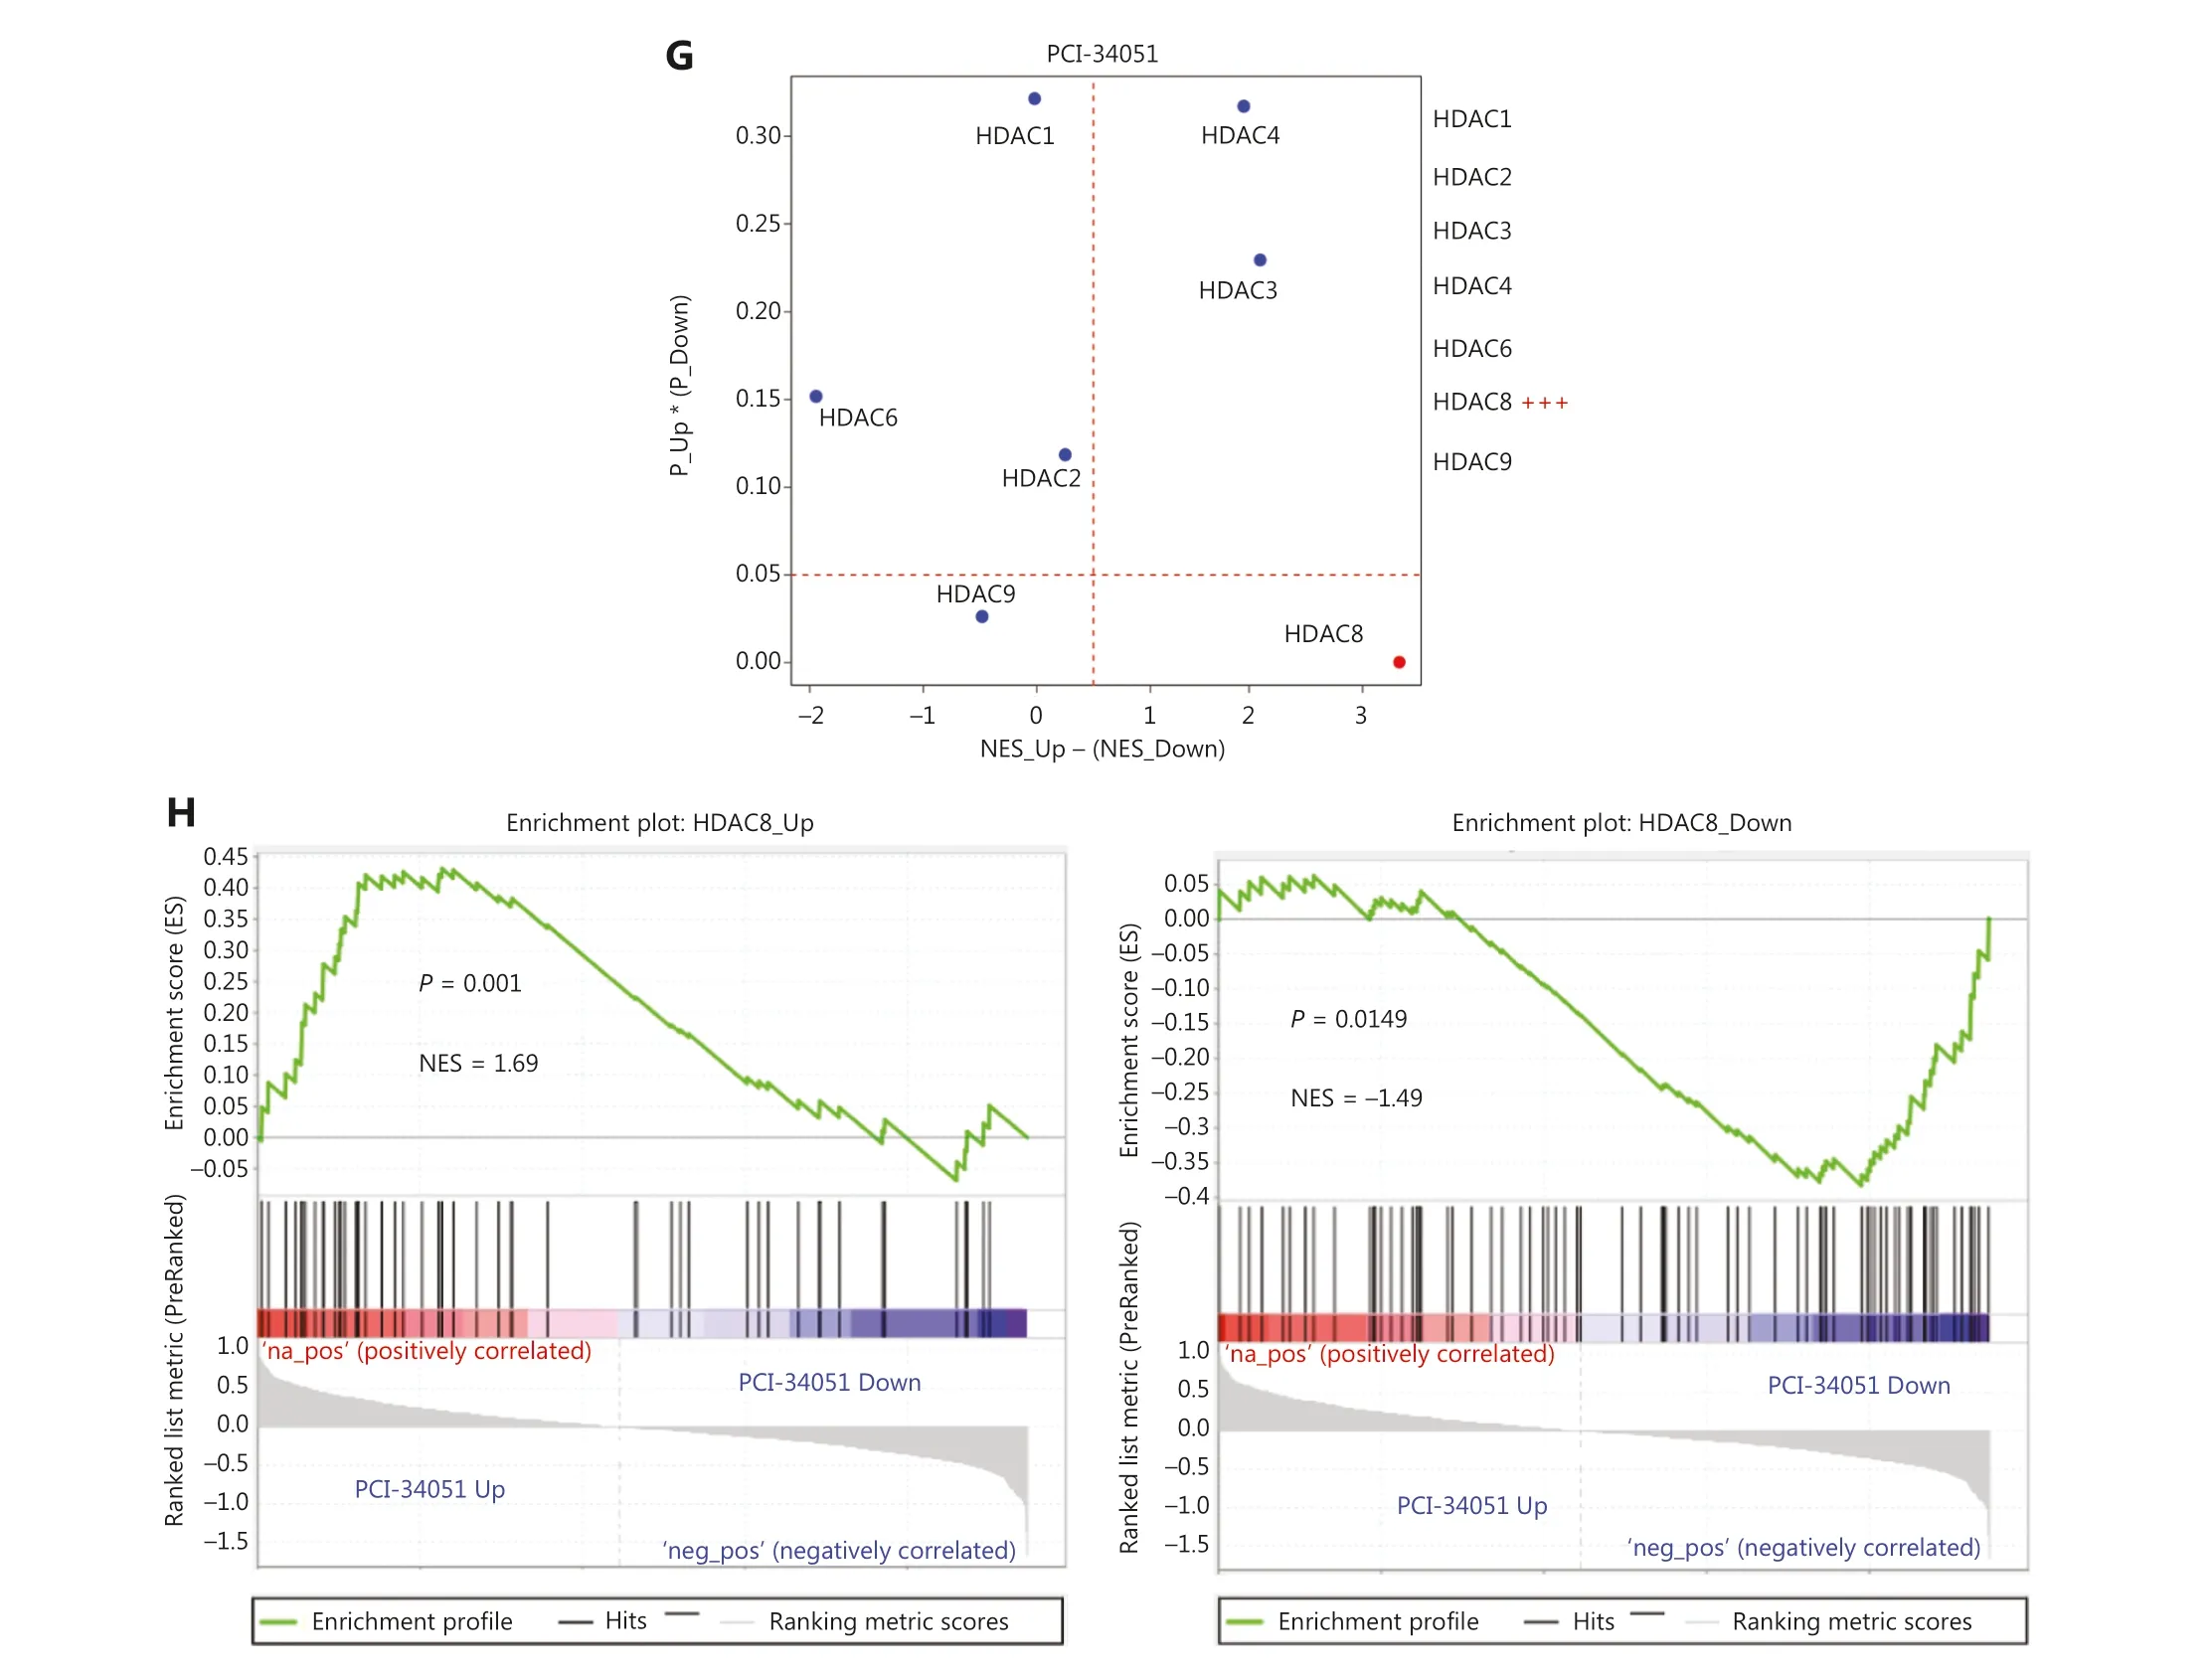
Figure 1 Gene expression signatures of knocking down 400 epigenetic regulators.(A) Successful knockdown of GFP protein as a positive control.The images were captured with a 10× objective fluorescence microscope at a total magnification of 100×.(B) The heatmap of gene expression signatures.(C) Fold-change of epigenetic regulators in all epigenetic regulators knockdown cell samples.(D) RT-qPCR results demonstrating significant knockdown of HDAC8 and KAT5.(E-F) GSEA analysis displaying the high consistency of DEGs between HTS2 and RNA-seq for siKAT5.(G-H) HTS2 results for PCI-34051, an HDAC8-specific inhibitor, exhibiting similar gene expression patterns to HTS2 results for HDAC8 knockdown with other HDACs, including HDAC1, HDAC2, HDAC3, HDAC4, HDAC6, and HDAC9 (as the control).NES: normalized enrichment score; NES_Up and P_Up: NES and P values obtained from the enrichment with the upregulated genes comparing siHDACs versus siNC; NES_Down, P_Down: NES and P value obtained from the enrichment with the downregulated genes comparing siHDACs versus siNC;NES_Up - (NES_Down): the total similarity score of HDACs knockdown with PCI-34051 treatment; P_Up * (P_Down): overall significance of the enrichment for up-regulated genes and down-regulated genes.
Previous studies have primarily focused on the interaction of a limited number of epigenetic regulators in regulating gene expression.In this study we constructed gene expression signatures for 299 known epigenetic regulators, which facilitated a comprehensive exploration of the intrinsic relationships.Correlation analysis of 299 epigenetic regulators based on gene expression signatures revealed that there were 21 epigenetic regulators with significant positive correlations (R > 0.56; Figure 3A).In addition, the 21 epigenetic regulators also exhibited mutual regulation based on the gene expression signatures (Figure 3B).Of the 21 epigenetic regulators, the second strongest correlation (R = 0.6237)was between BAZ2B and SETMAR, both of which belong to cluster 4 (Supplementary Table S3).Furthermore, BAZ2B and SETMAR shared as many as 402 DEGs, accounting for 49.14% (402/818) and 71.40% (402/811) of the DEGs regulated by BAZ2B and SETMAR, respectively.More importantly, the fold-changes in the 402 DEGs were significantly positively correlated between siBAZ2B and siSETMAR samples (P= 4.45e-145, R = 0.9; Figure 3C).Notably, by analyzing multiple gene expression datasets from the public domain (GTEx and TCGA Pan-Cancer), the average co-expression coefficients of BAZ2B and SETMAR in cancers and tissues were as high as 0.75 and 0.74, respectively(Figure 3D).
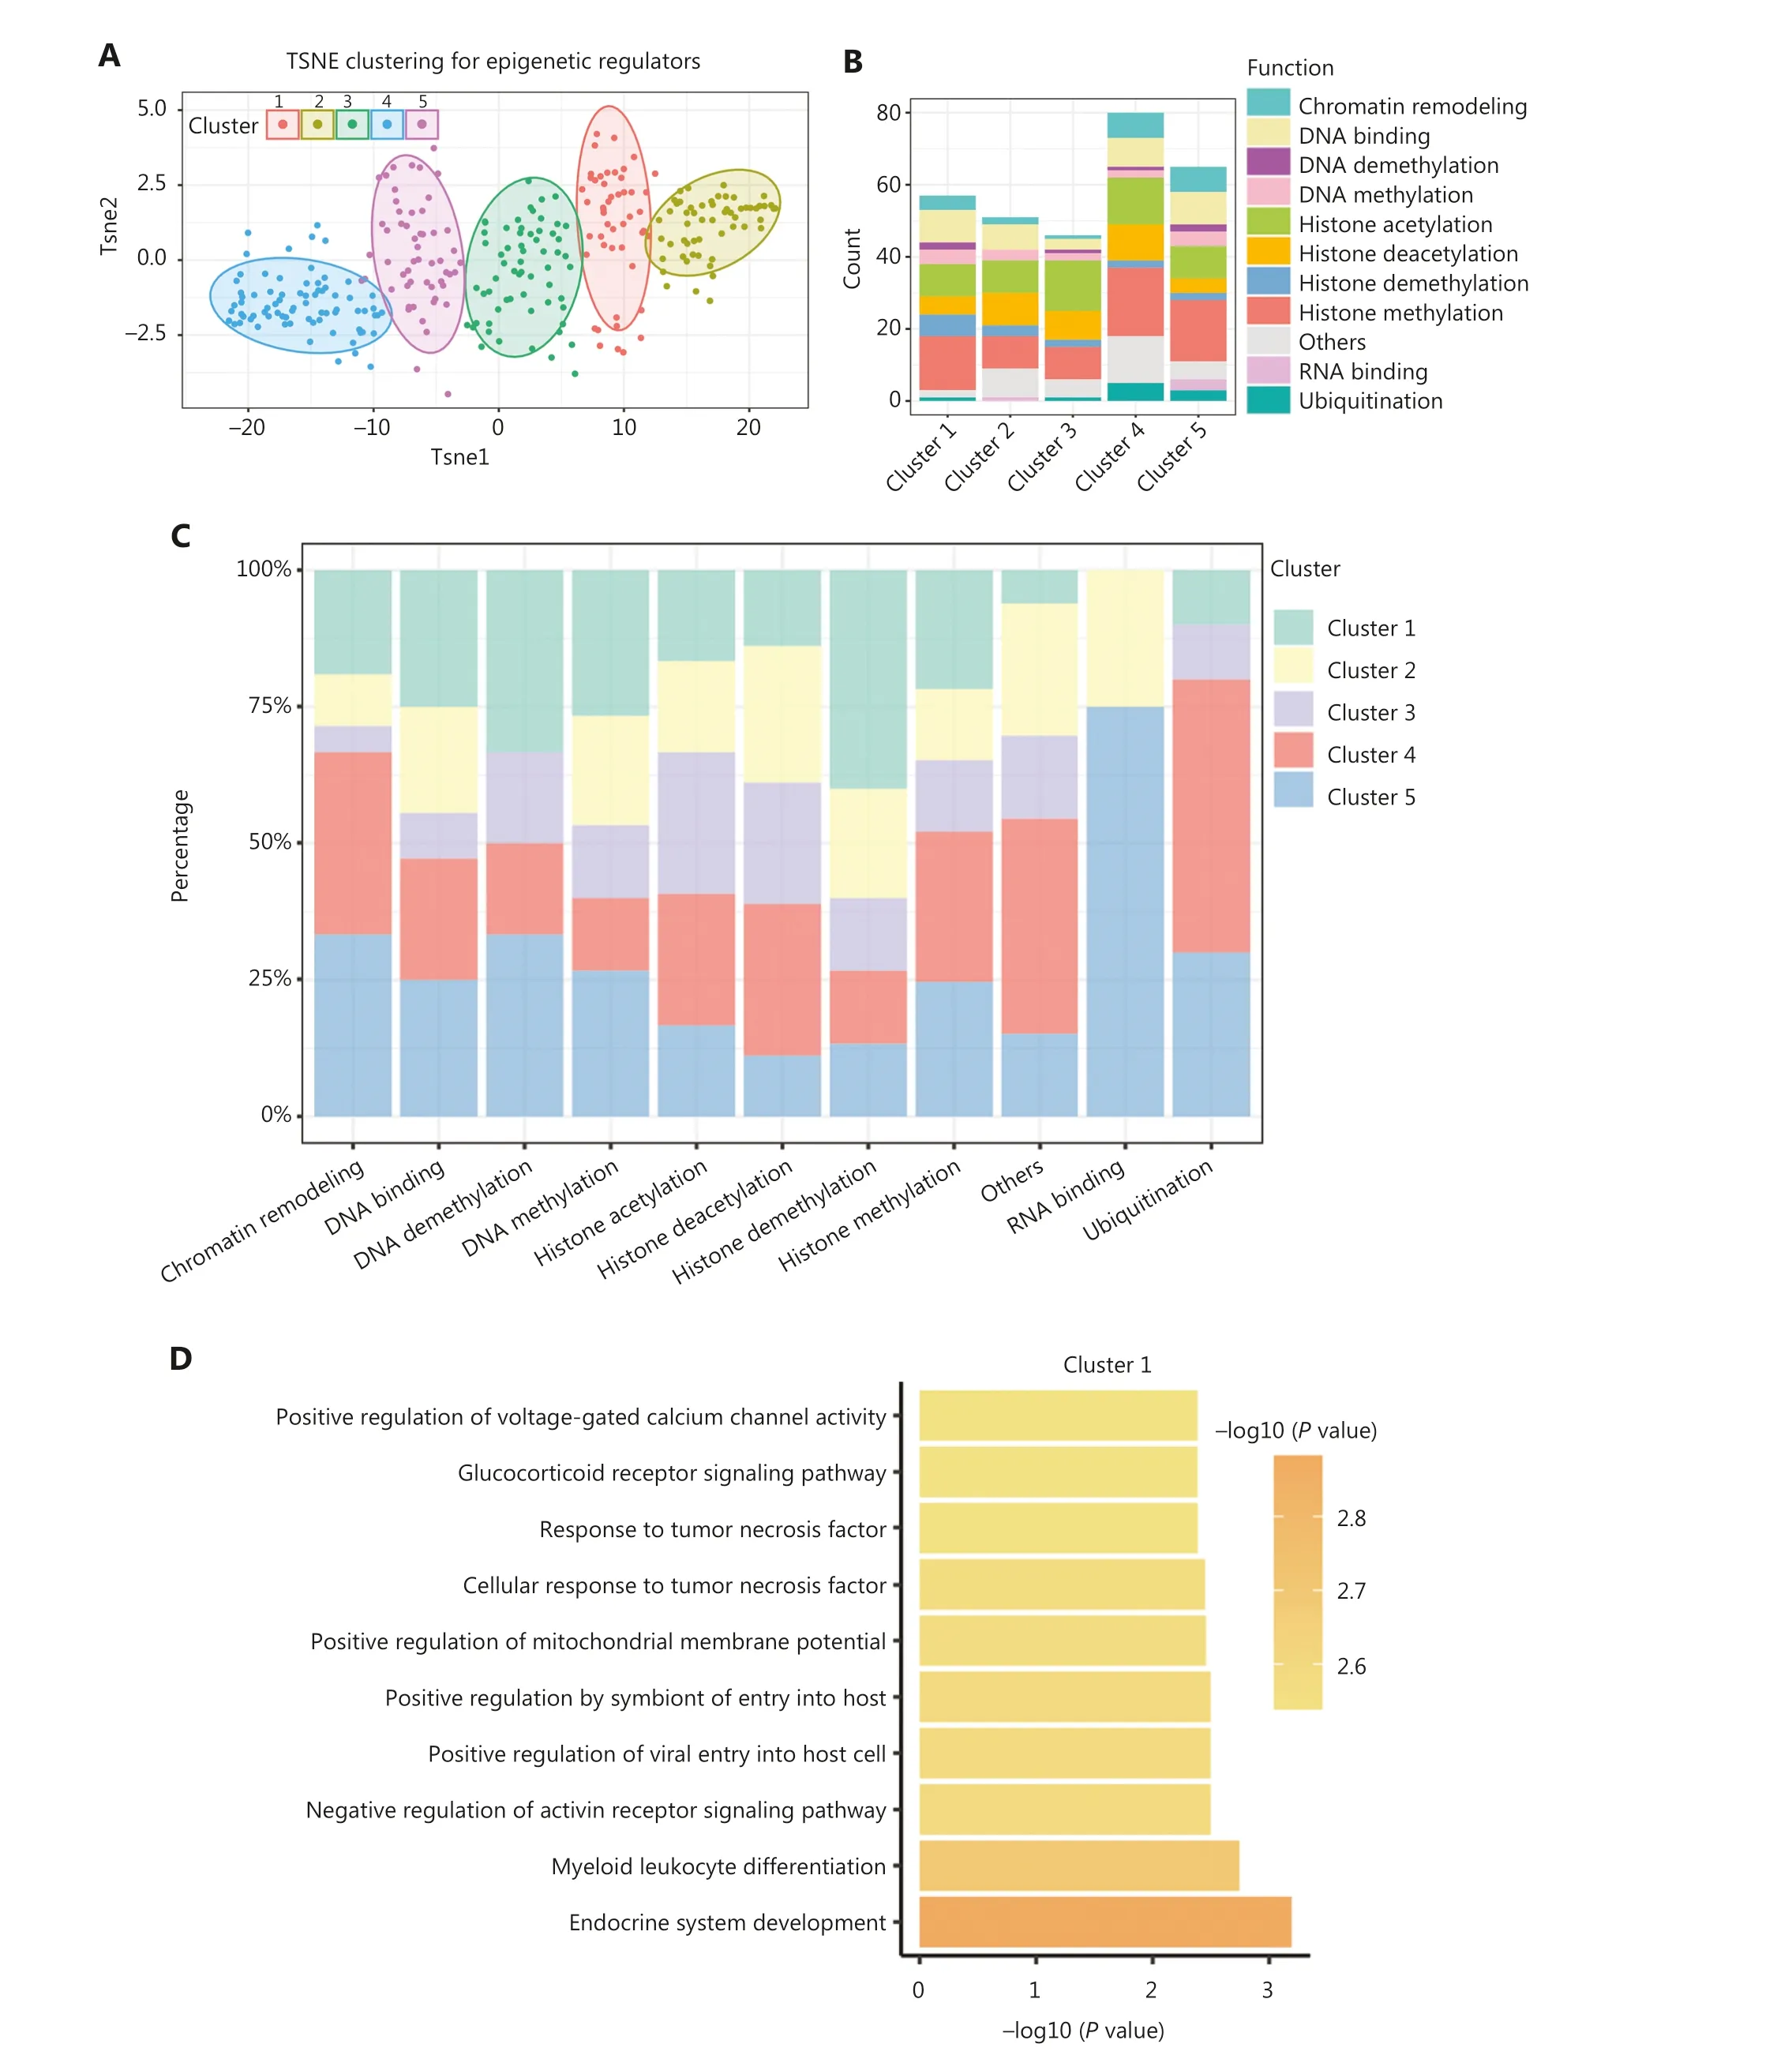
Figure 2 Continued
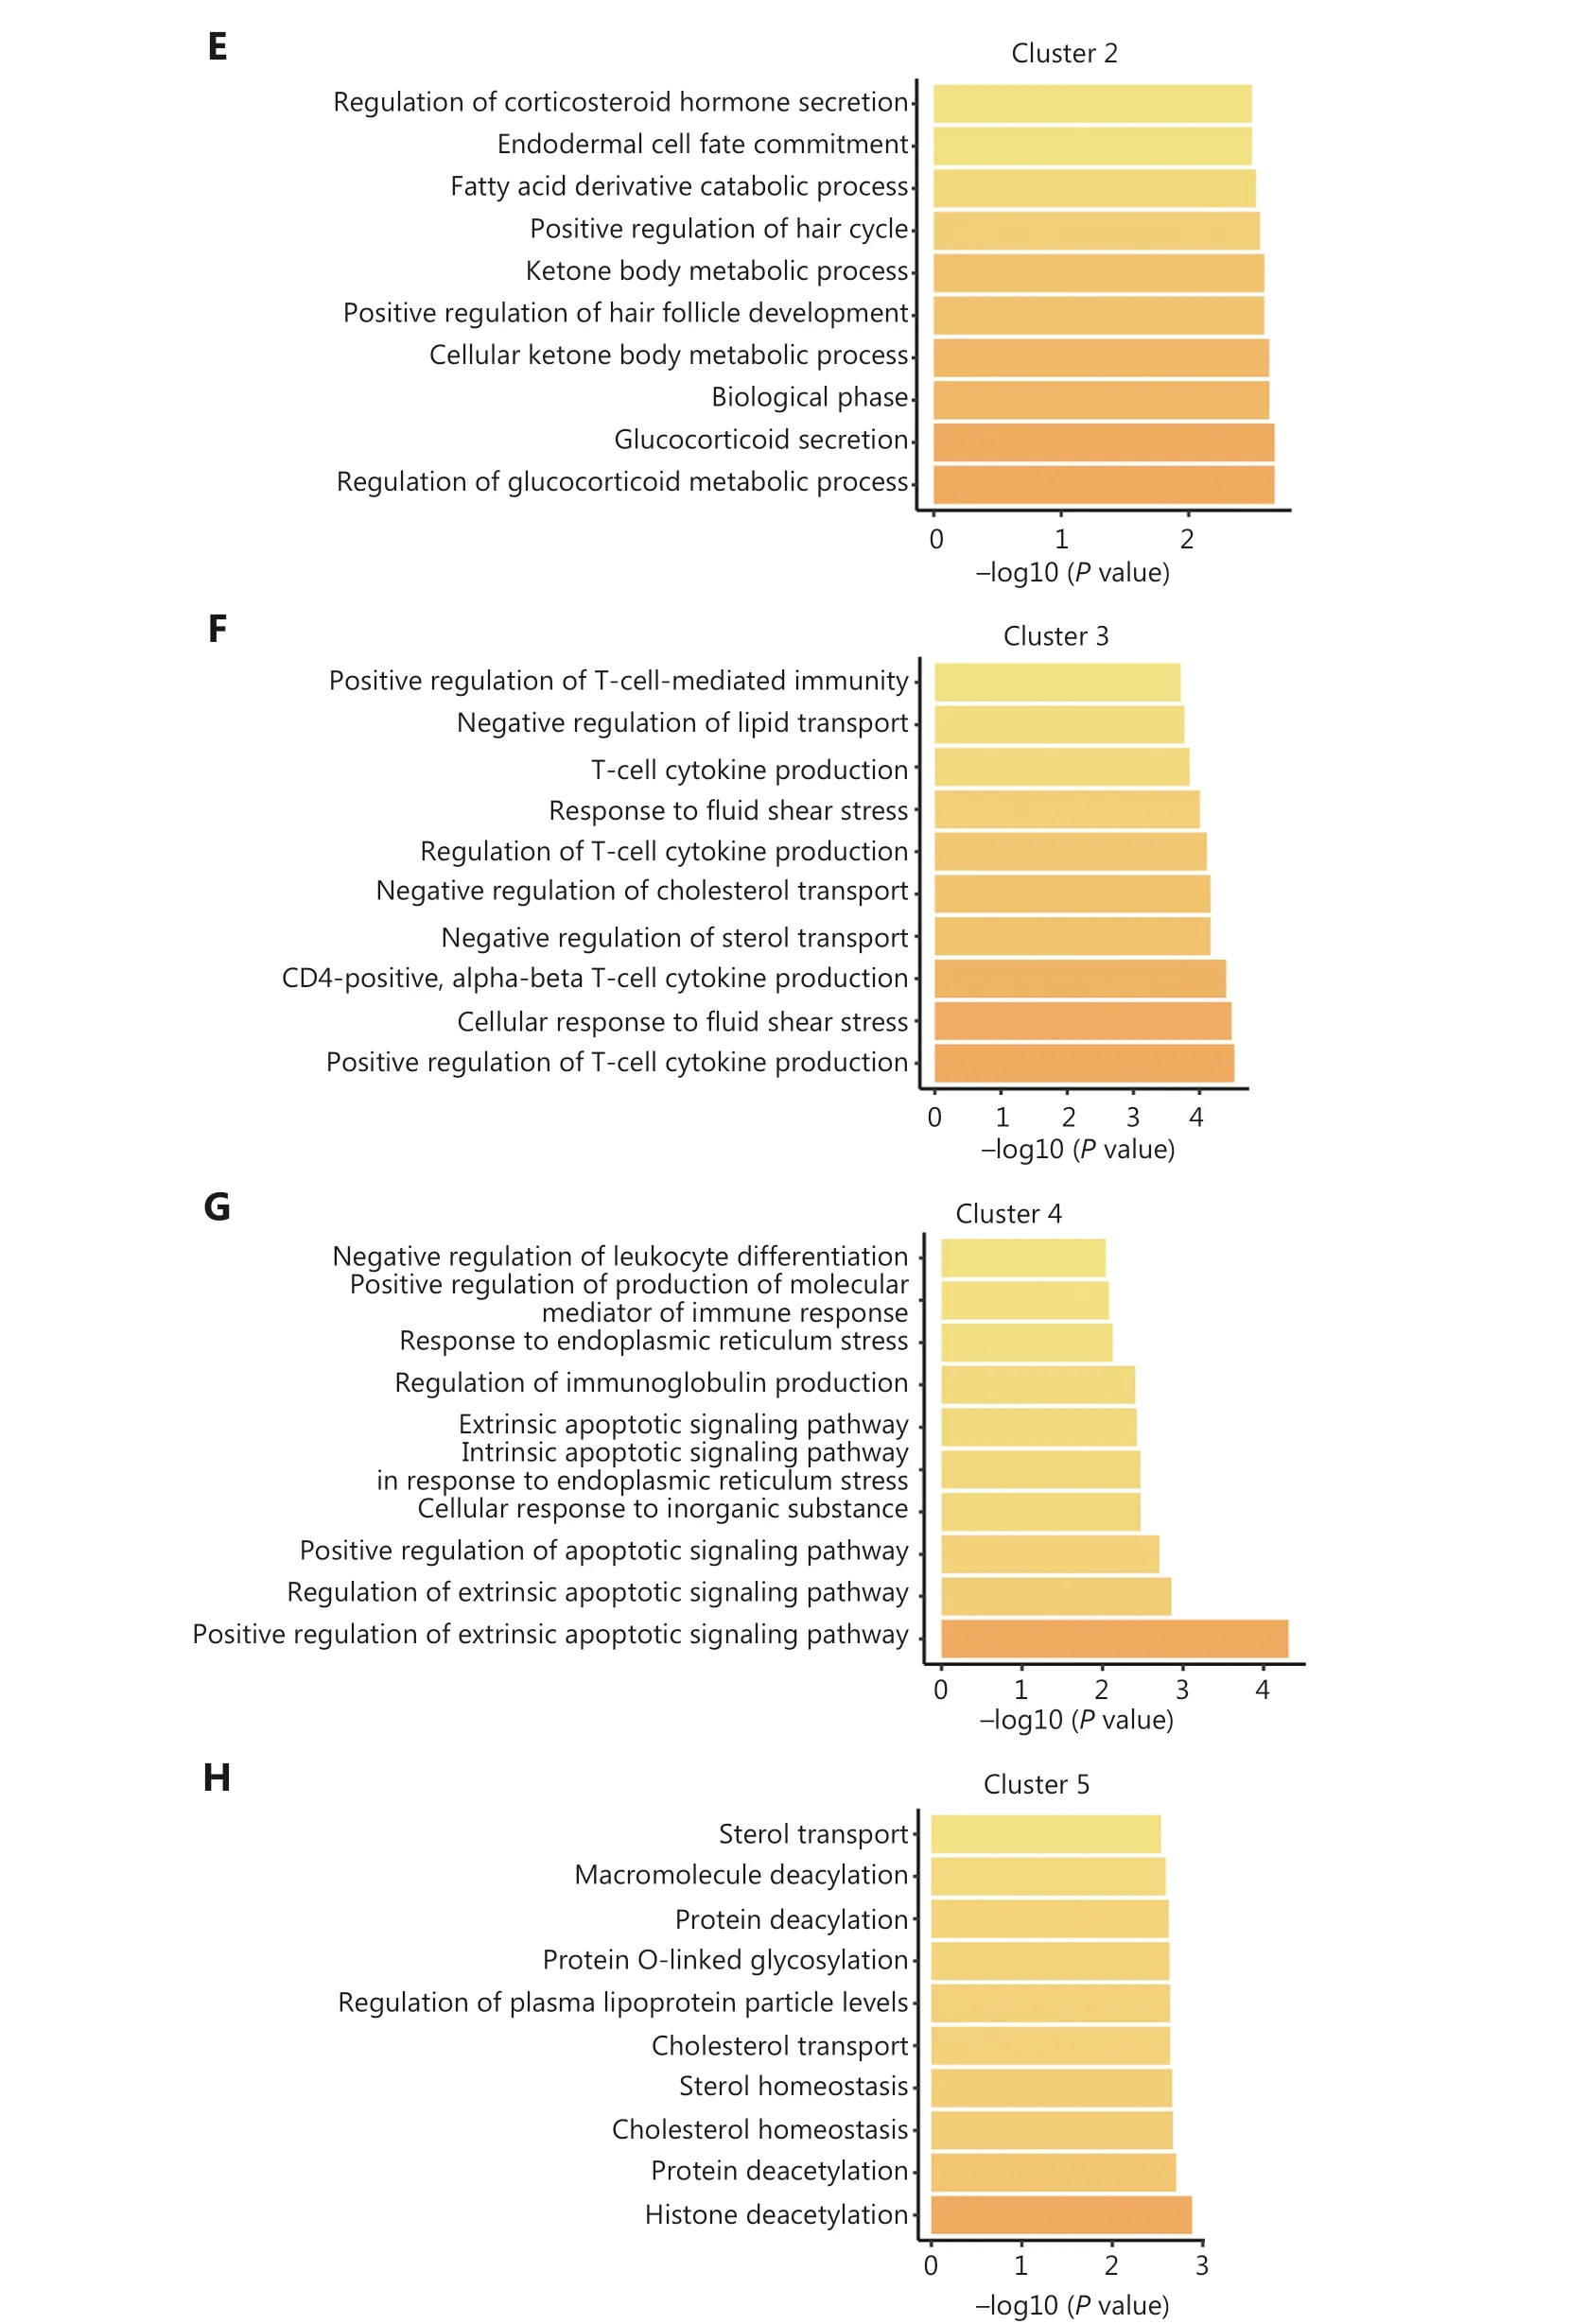
Figure 2 Classification of epigenetic regulators into 5 functionally-specific clusters.(A) Clustering of epigenetic regulators based on gene fold-change.(B) Number of epigenetic regulators in each class within each cluster.(C) Percentage of each class of epigenetic regulators within each cluster.(D-H) Top 10 biological processes associated with each cluster.
The strongest positive correlation was observed between CLOCK and CBX3, both of which belonged to cluster 2 (R = 0.637; Figure 3A and Supplementary Table S3).The expression changes of 187 shared DEGs regulated by siCLOCK and siCBX3 were significantly and positively correlated (P= 2.97e-128, R = 0.98; Figure 3E).We also found that the average co-expression coefficients of CLOCK and CBX3 in cancers and normal tissues were as high as 0.85 and 0.84,respectively (Figure 3F).Moreover, the analysis of ChIP-seq data of CLOCK and CBX3 revealed that these two epigenetic regulators co-localized with chromatins in breast cancer cells (MCF-7) and shared 162 target genes (Figure 3G, 3H).For instance, they both bound to the transcription start site(TSS) of shared target genes, such as BCAS3, FZD1, PFDN4,and PRKAB2 (Figure 3H).Collectively, these results strongly suggested that BAZ2B and SETMAR, as well as CLOCK and CBX3, worked closely to transcriptionally co-regulate a group of target genes.Furthermore, these findings highlighted the ability of gene expression signatures to identify functional correlations among epigenetic regulators.
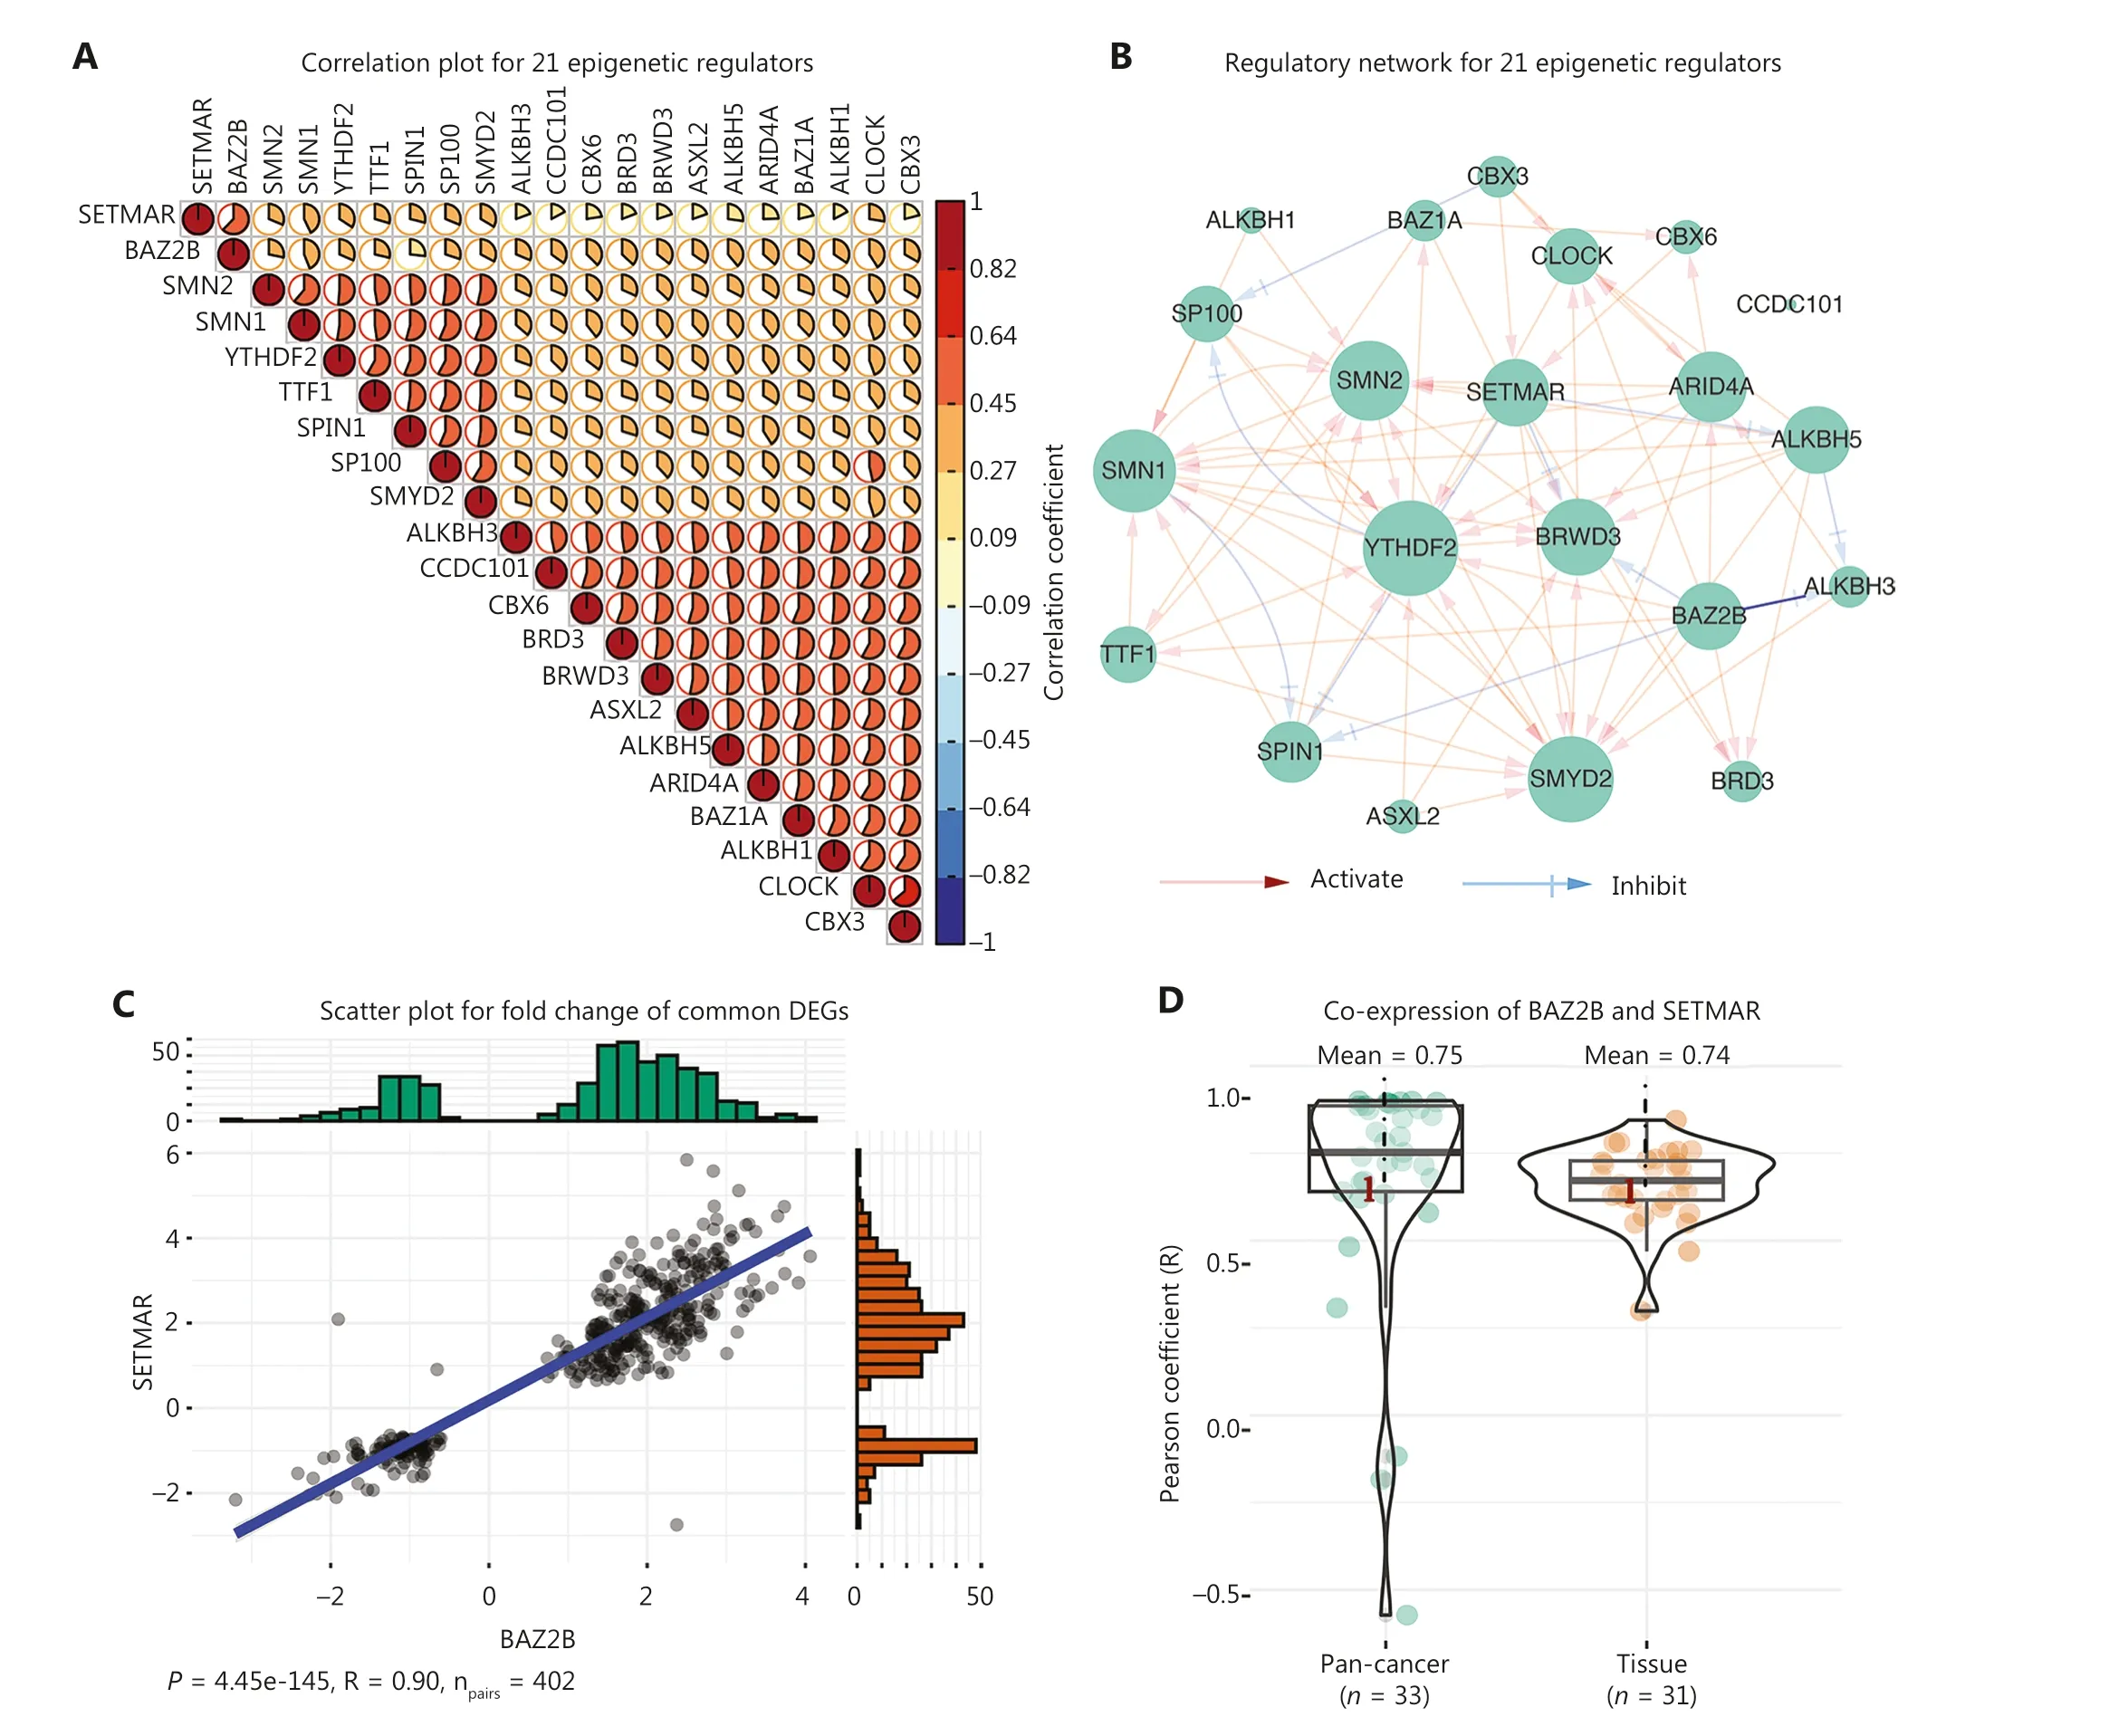
Figure 3 Continued
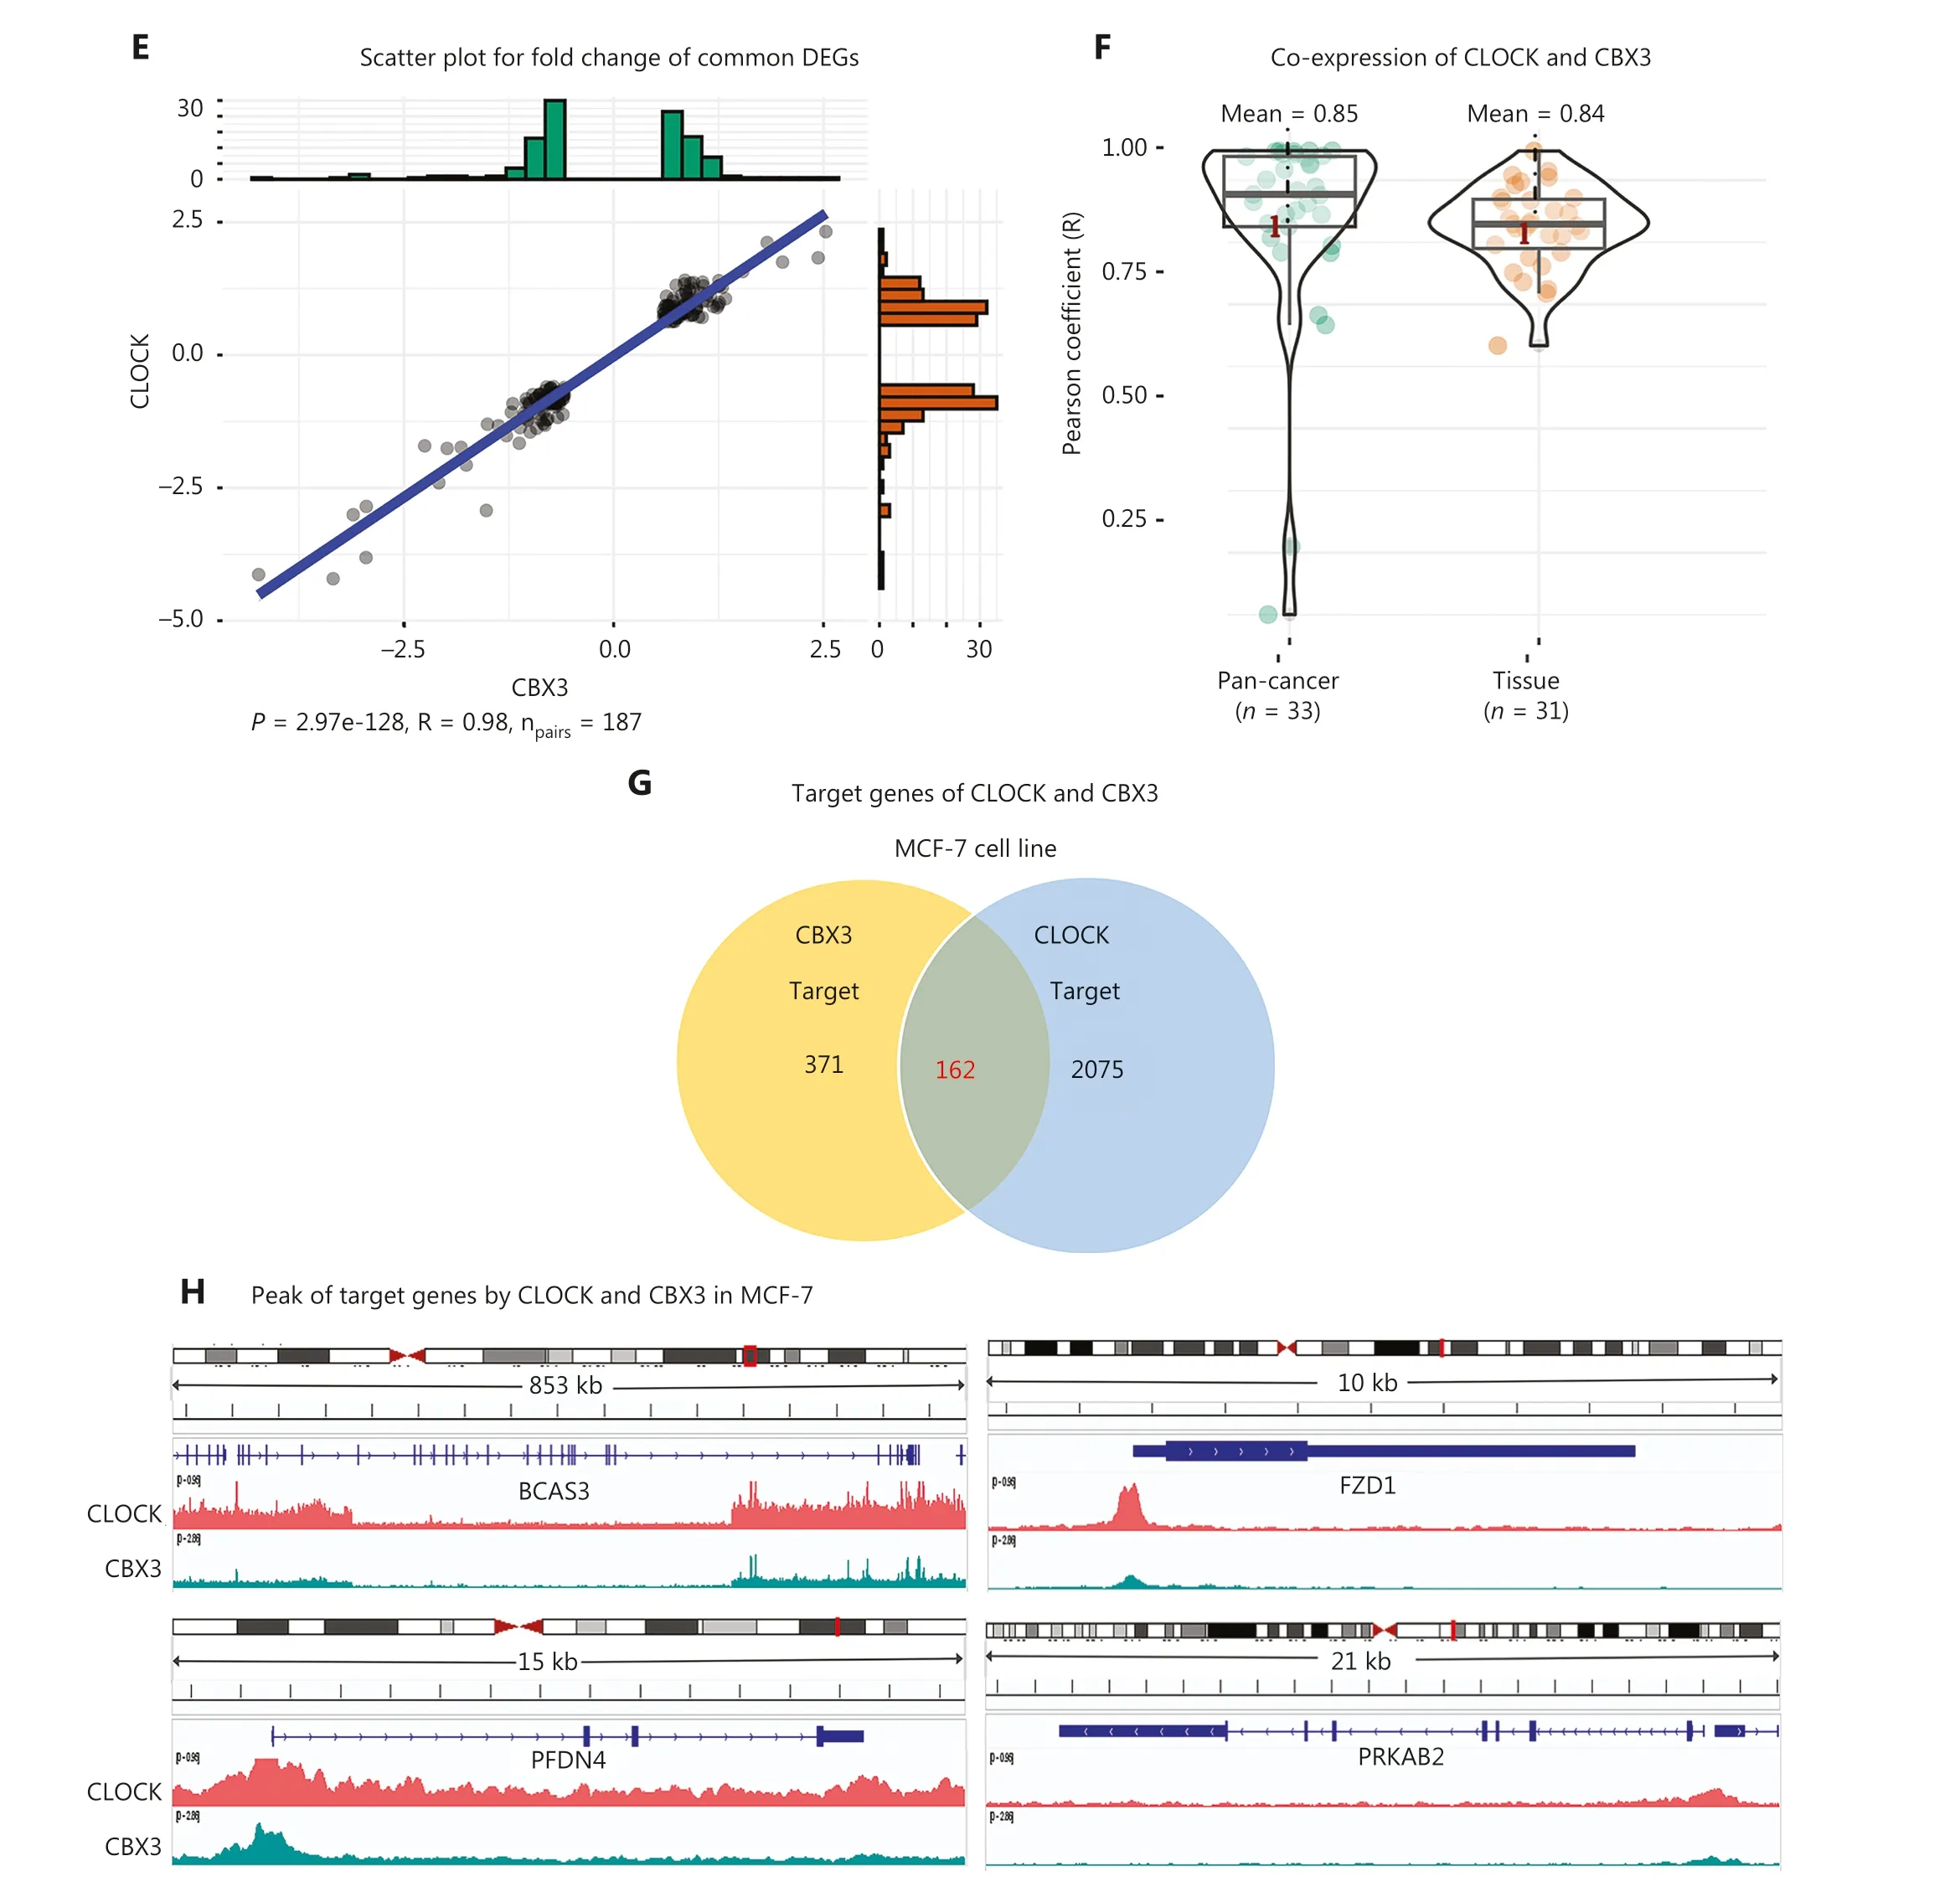
Figure 3 Function similarity between BAZ2B and SETMAR, as well as CLOCK and CBX3.(A) Correlation plot displaying the correlation coefficients of 21 epigenetic regulators.(B) Regulatory network of the 21 epigenetic regulators.(C) Scatter plot showing the 402 shared DEGs regulated by SETMAR and BAZ2B.(D) Co-expression between SETMAR and BAZ2B in tissues and cancers.(E) Scatter plot depicting the 187 shared DEGs regulated by CLOCK and CBX3.(F) Co-expression between CLOCK and CBX3 in tissues and cancers.(G) Venn diagram illustrating the shared targets of CLOCK and CBX3.(H) Peaks of targets regulated by CLOCK and CBX3.
CLOCK and HDAC8 exhibit antagonism of gene expression signatures
In addition to positive correlations, negative correlations were also observed between epigenetic regulators based on gene expression signatures.We identified 17 epigenetic regulators with significant negative correlation (R < −0.2; Figure 4A).Interestingly, we found that CLOCK was also one of the 17 epigenetic regulators.Moreover, we observed that CLOCK and HDAC8 exerted opposite effects on regulation of gene expression.Previous studies have reported that CLOCK possesses histone acetylation activity, whereas HDAC8 possesses NAD-dependent histone H3K9 deacetylase activity.Notably,we found that the binding peaks of CLOCK and HDAC8 in ChIP-seq results were predominantly located at the TSS,which was consistent with the known location of H3K9ac(Figure 4B, 4C).Analysis of the binding peak distribution patterns revealed striking similarities between CLOCK and HDAC8, with peaks primarily enriched in distal intergenic regions, followed by promoters (Figure 4D).Furthermore,co-localization of HDAC8 and CLOCK in the chromatin was observed in the erythroleukemia cell line, K-562, and 44 target genes were shared (Figure 4E).By analyzing of the ChIP-seq data encompassing CLOCK, HDAC8, and H3K9ac, we found that all bound to the TSS or the promoter regions of the shared target genes, including KAT5, MRPL4, OPLAH, and UBE3C(Figure 4F).

Figure 4 Continued
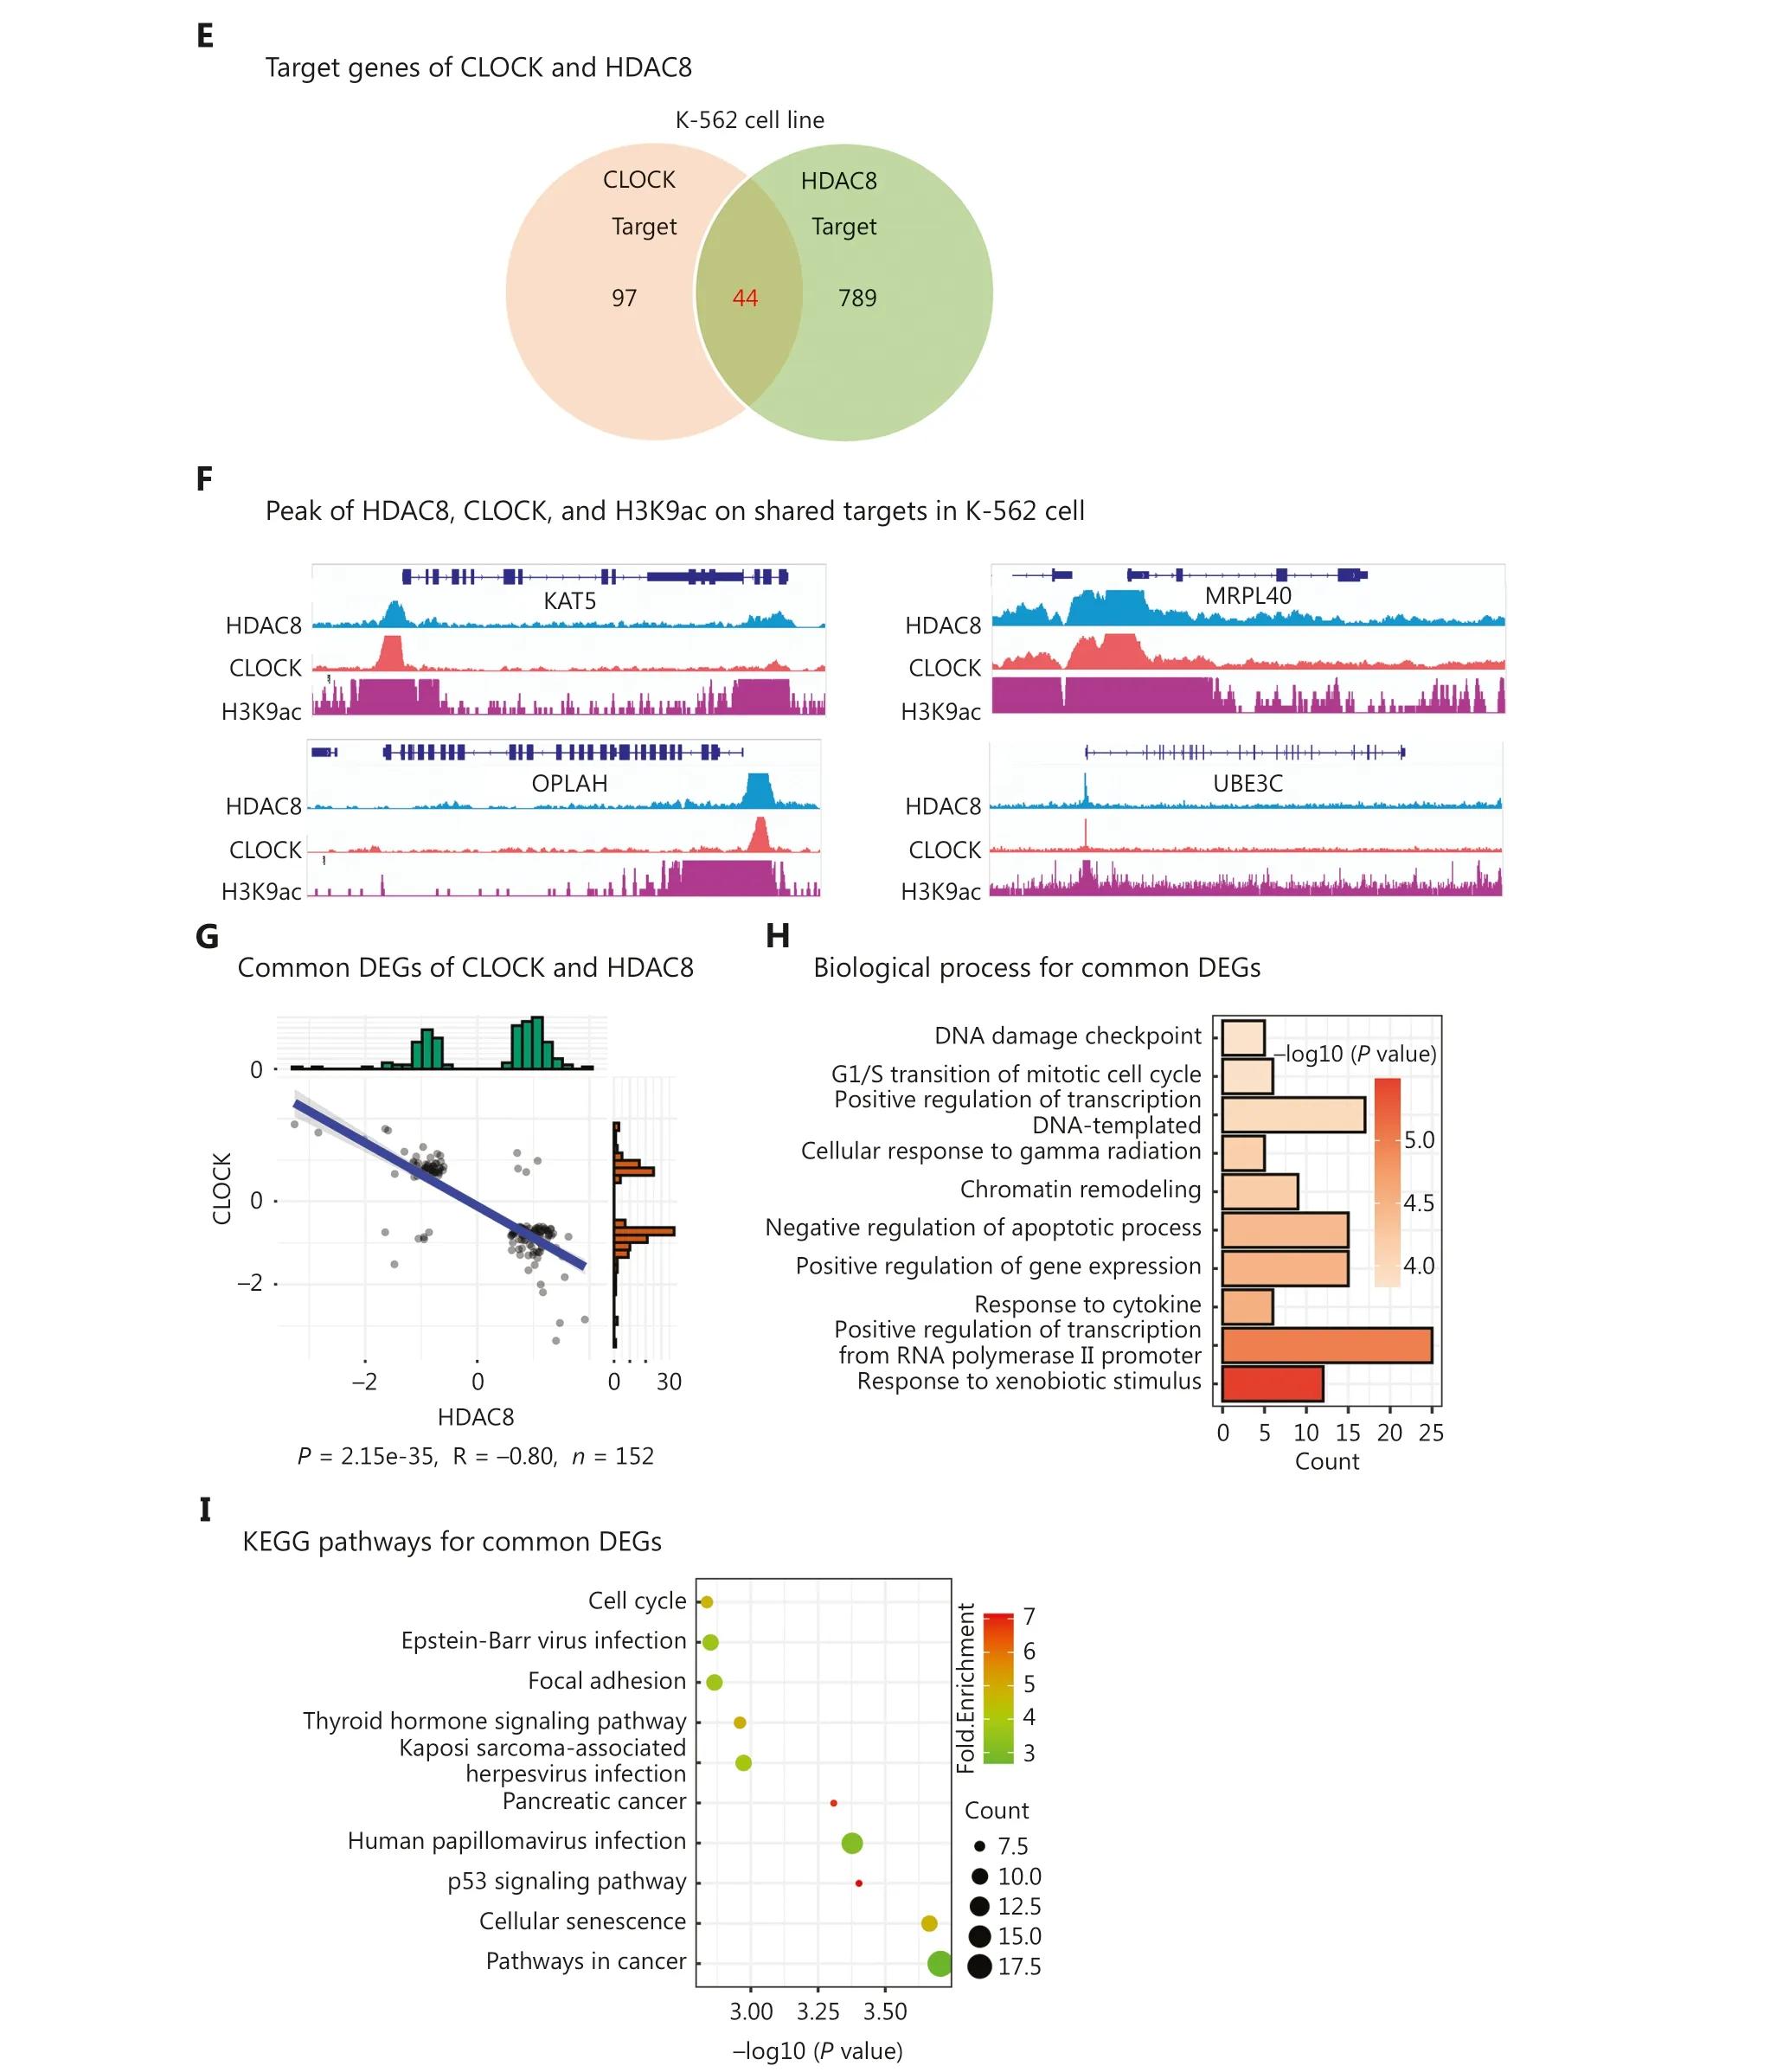
Figure 4 Functional antagonism between CLOCK and HDAC8.(A) Correlation plot showing the correlation coefficients of 17 epigenetic regulators.(B) Peak frequency analysis of CLOCK, HDAC8, and H3K9ac.(C) Heatmap depicting the peak distribution of CLOCK, HDAC8, and H3K9ac.(D) Peak distribution analysis of CLOCK, HDAC8, and H3K9ac.(E) Venn diagram displaying the shared targets of CLOCK and HDAC8.(F) Peaks of CLOCK, HDAC8, and H3K9ac on shared targets.(G) Scatter plot demonstrating the 152 common DEGs regulated by CLOCK and HDAC8.(H) Top 10 biological processes enriched by the 152 common DEGs.(I) Top 10 KEGG pathways enriched by the 152 common DEGs.
Additionally, we identified 152 DEGs that were coregulated by CLOCK and HDAC8 based on gene expression signatures.Interestingly, the regulating direction of the 152 DEGs by CLOCK was significantly opposite to that by HDAC8 (P= 2.15e-35, R = −0.80; Figure 4G).These 152 co-regulated DEGs were involved in apoptosis, cell cycle regulation, and gene expression regulation (Figure 4H).Importantly, the pathways associated with the 152 DEGs were relevant to the occurrence and development of cancers(Figure 4I).Collectively, these findings indicated a negative correlation between CLOCK and HDAC8 in gene expression regulation, and the concerted actions play a role in cancer occurrence and progression.
Finding eight distinguishing modules by constructing a regulatory network
In addition to examining the relationships between the epigenetic regulators from the perspective of gene expression regulation, we constructed a regulatory network based on the gene expression signatures (Supplementary Figure S3).This network included 299 epigenetic regulators and 6,765 edges.As shown in Supplementary Table S5, the maximum EdgeCount value was 309, corresponding to the epigenetic regulator TADA2A, which also exhibited the highest indegree value (239) among all nodes.Simultaneously, the two nodes with the maximum outdegree were KDM5B and BAZ2B (106 and 103, respectively; Supplementary Table S5).However, it is noteworthy that the two epigenetic regulators had relatively low indegree values (3 and 2, respectively).This finding suggested that these two epigenetic regulators have the capacity to regulate a large number of other epigenetic regulators, while being regulated by only a few.
More importantly, we found eight distinguishing modules (M1, M2, M3, M4, M5, M6, M7, and M8) in this regulatory network (Figure 5).Module M1 had the most nodes(52), module M5 had the least nodes (6), module M3 had
the most edges (230), and module M8 had the least edges(10).Like clusters, we performed functional annotation on the common DEGs, which were defined as genes exhibiting differential expression in at least one-half of the epigenetic regulators within each module.The results showed that the distinct functions of DEGs regulated by epigenetic regulators within each module (Supplementary Figure S4).For example, module M1 was primarily associated with hypoxia, while module M3 was related to fat cell differentiation (Supplementary Figure S4A, S4C).The function of module M6 was the regulation of cysteine-type endopeptidase activity, while module M7 was associated with the regulation of peptidyl-serine phosphorylation (Supplementary Figure S4F, S4G).Furthermore, module M8 was shown to be related to neuroinflammation (Supplementary Figure S4H).Despite the significant enrichment of apoptotic signaling pathway in modules M2, M4, and M5, module M5 exhibited involvement in other functions, including drug response, histone modification, and cell cycle regulation(Supplementary Figure S4E).These results suggested that the network we constructed facilitated the discovery of direct interaction among the epigenetic regulators.
Identification of master epigenetic regulators in breast cancer
In addition to uncovering the interactions of hundreds of epigenetic regulators, we also focused on identifying key epigenetic regulators that play an important role in breast cancers.Based on the outdegree values of the nodes in the network,we identified 10 epigenetic regulators, including KDM5B,BAZ2B, ITIH4, KAT5, YTHDF2, SMN1, TADA2A, SETMAR,ALKBH5, and HDAC8 (Figure 6A and Supplementary Table S5).These epigenetic regulators were selected as master epigenetic regulators, indicating their position at the top of the regulatory hierarchy.We also observed mutual regulation among the 10 master regulators (Figure 6B).Notably, all 10 master epigenetic regulators exhibited significant differential expression in breast cancer compared to normal breast tissue (Figure 6C).Immunohistochemical staining confirmed the upregulation of KDM5B, YTHDF2, SMN1, and ALKBH5 proteins in BRCA, consistent with mRNA expression (Figure 6D).Conversely, BAZ2B, KAT5, and ITIH4 proteins were downregulated in BRCA, which was also consistent with the mRNA levels (Figure 6D).More importantly, we found that six master epigenetic regulators were significantly associated with the overall survival in patients with breast cancer (P< 0.05; Figure 6E).
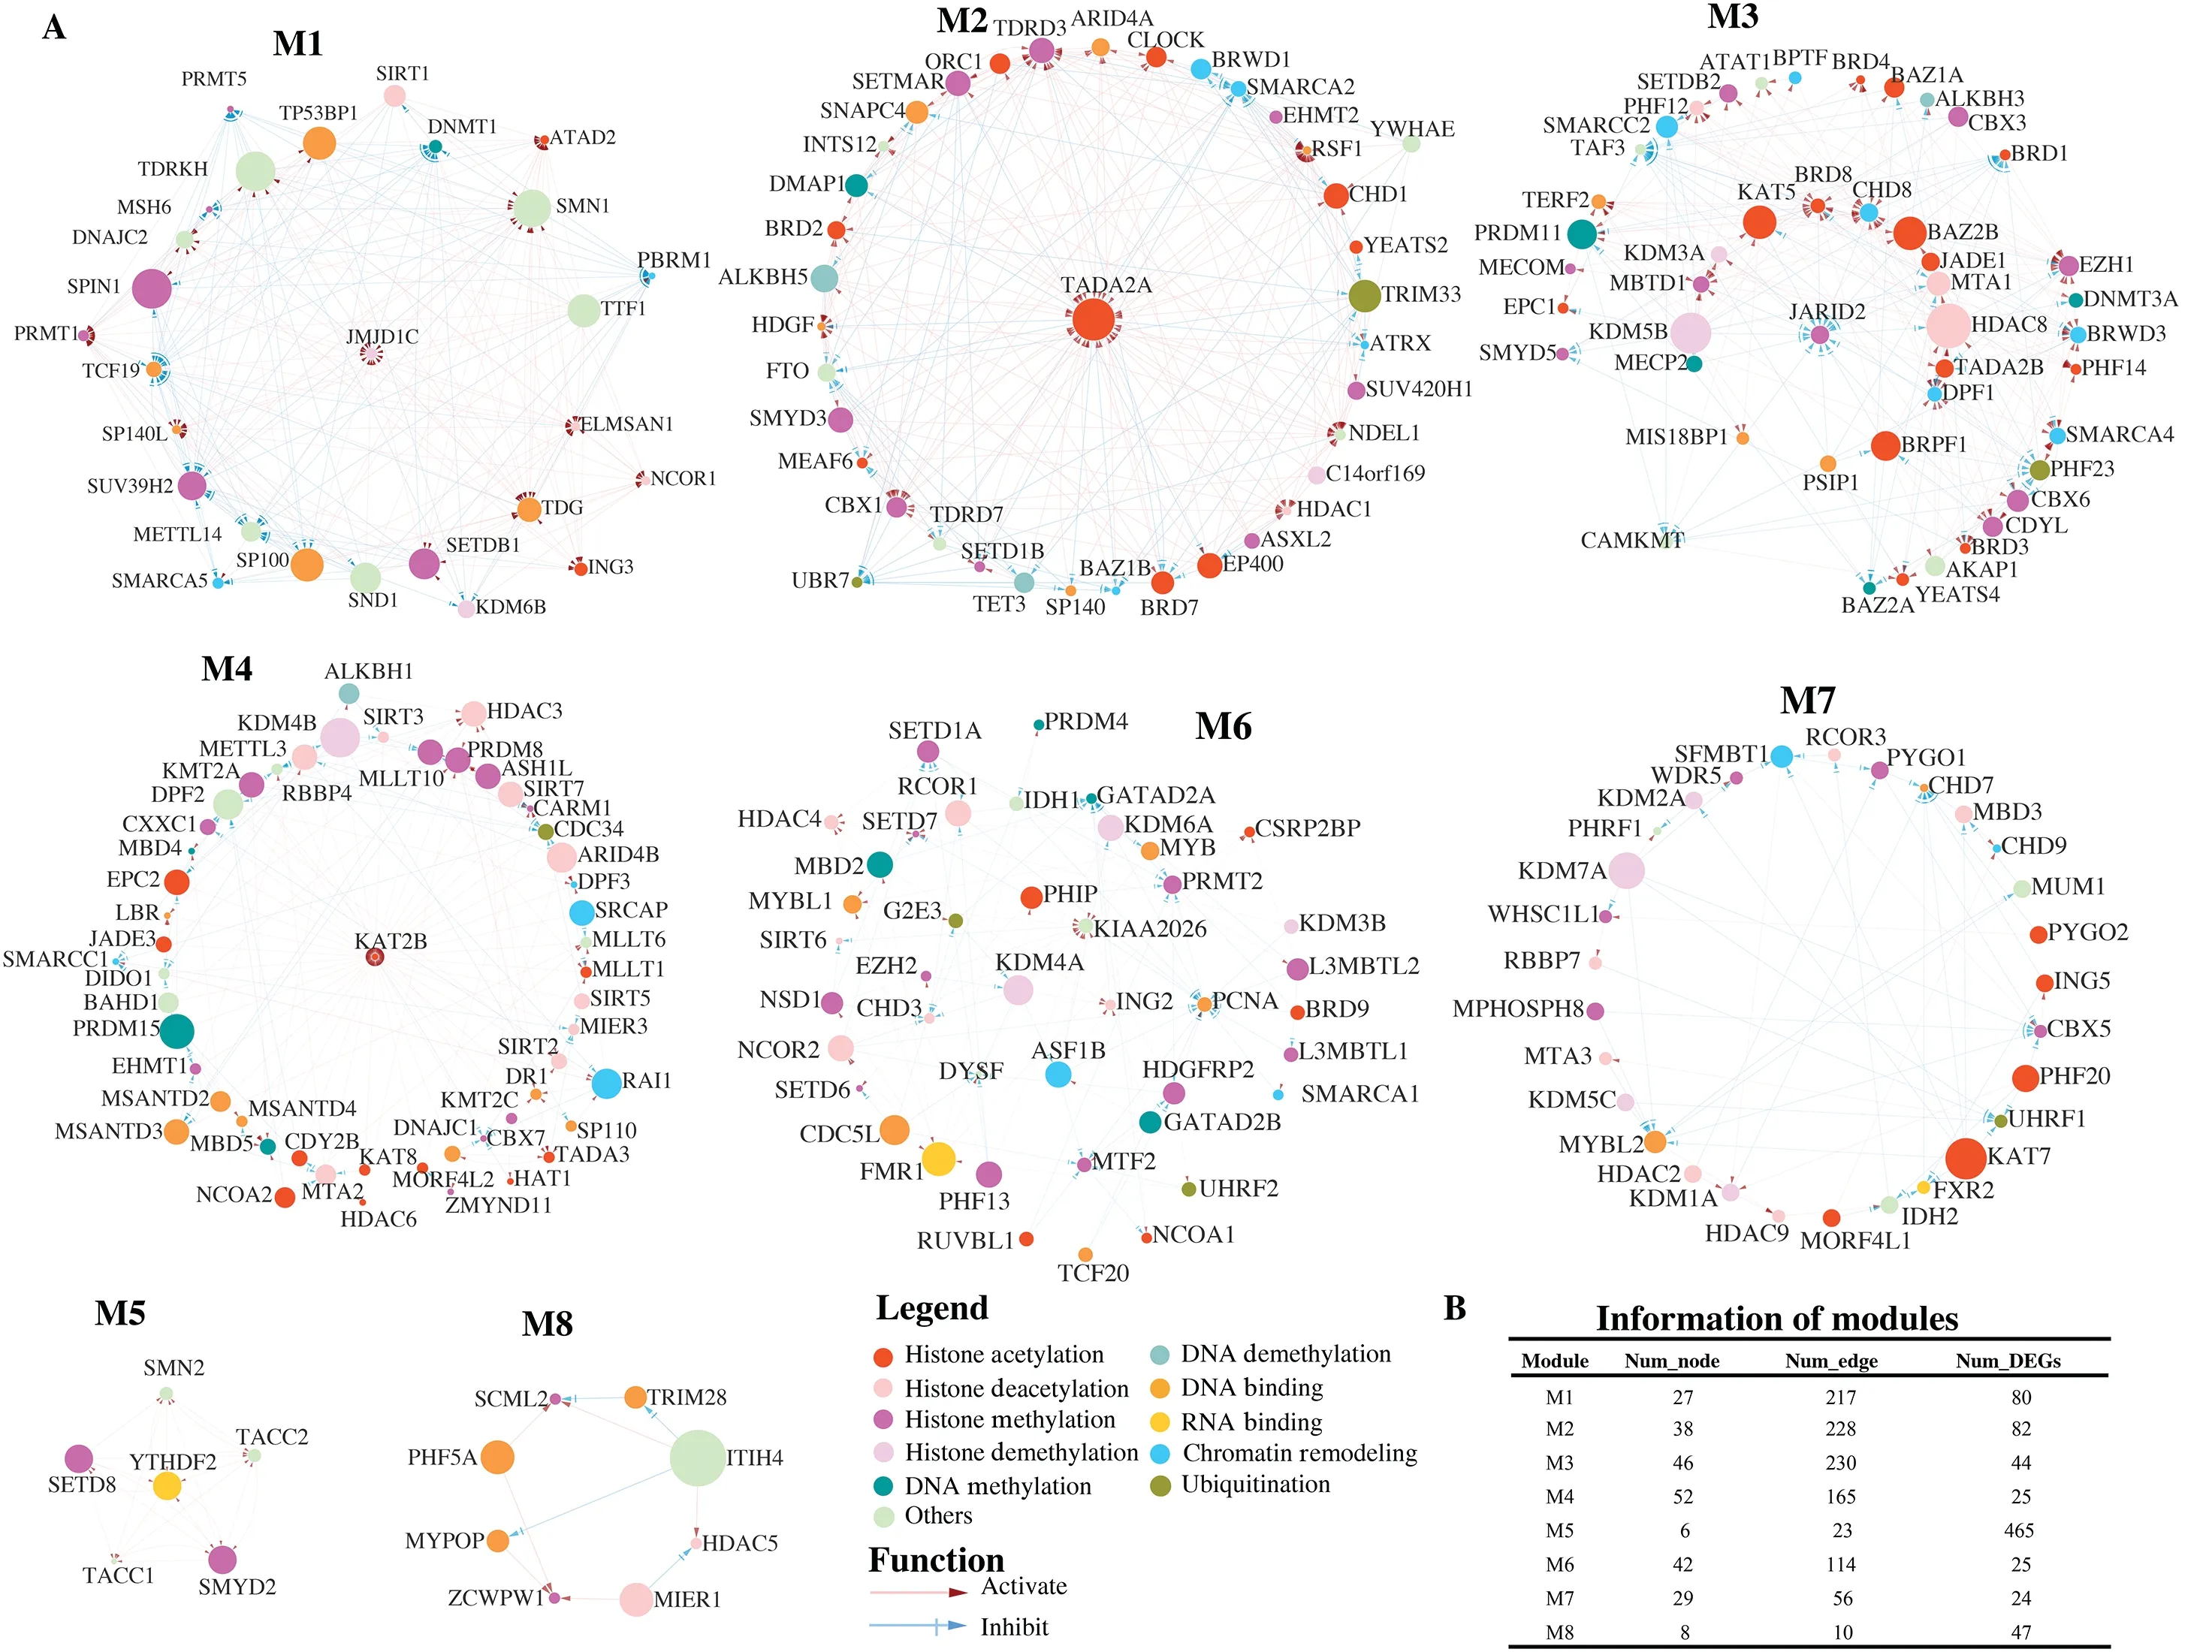
Figure 5 Eight modules and their information.(A) Regulatory network of eight modules illustrated by Cytoscape.The module refers to a high interconnected region within this network that are functionally related.Each node represents an epigenetic regulator in this network.The edge represents a regulatory interaction between two epigenetic regulators.(B) The information of eight modules.
Pan-cancer analysis of TCGA datasets encompassing 34 cancer types demonstrated significant differential expression of the master epigenetic regulators across multiple cancers (Supplementary Figure S5 and Table S6).For example,KDM5B exhibited significant upregulation in as many as 24 cancer types, while BAZ2B displayed high expression in 10 cancer types and low expression in 20 cancer types.ITIH4,KAT5, and SETMAR followed a pattern like BAZ2B and were significantly downregulated in most cancers.In contrast,SMN1, YTHDF2, HDAC8, and KDM5B were predominantly upregulated in most cancers.However, the differential expression of TADA2A and ALKBH5 in cancers lacked specificity,with one-half exhibiting high expression and the other half showing low expression.Prognostic analysis conducted across various cancer types indicated varying associations between the expression of the 10 master epigenetic regulators and patient outcomes (Supplementary Figure S6).KDM5B was a risk factor in most cancers, whereas BAZ2B exhibited a protective effect.These findings emphasized these master epigenetic regulators function in breast cancer as well as in multiple other cancer types.
Discussion
Aberrant epigenetic regulation is known to have a pivotal role in the development of various cancers, including breast cancer.However, although approximately 400 epigenetic regulators are involved in the intricate landscape of epigenetic regulation, the mutual regulatory mechanisms and master players remain poorly understood.In the present study, we used siRNA knockdown and the HTS2assay to uncover the expression signatures representing 400 epigenetic regulators.Leveraging the gene expression signatures, we classified the epigenetic regulators into five distinct clusters, each characterized by its specific functions and encompassing various epigenetic modifications.Subsequently, we revealed the functional similarity between BAZ2B and SETMAR, as well as between CLOCK and CBX3.We also found that even though CLOCK and HDAC8 demonstrated co-localization of gene binding in chromatin, CLOCK and HDAC8 exhibited an antagonistic relationship with gene expression.More importantly, we constructed a comprehensive regulatory network of the 299 epigenetic regulators, which revealed 8 distinguished modules.Notably, based on this regulatory network, we identified 10 master epigenetic regulators, which play crucial roles in breast cancer prognosis.
This is the first study to construct a regulatory network among 299 epigenetic regulators.Using this network, we successfully identified eight distinct modules, wherein the epigenetic regulators interacted and mutually regulated each other.These regulatory interactions of multiple epigenetic regulators collectively governed gene expression, leading to the manifestation of unique functional roles in each module.Notably,several of the regulatory interactions observed in our modules have been previously validated.For example, the interactions between HDAC2 and KDM1A, KDM1A and SFMBT1, and SFMBT1 and RCOR3, which were uncovered in module M7(Figure 5A), have already been reported36-38.Furthermore,previous studies have shown that SMYD2 regulates the transcriptional activation of TACC239, which was consistent with our results within module M5 (Figure 5A).Additionally, our results also support the previously reported transcriptional regulation of SMYD2 and SETD840.Interestingly, all four members of the NuRD complex (MTA3, RBBP7, MBD3, and HDAC2) were within module M736,37.Another set of four members from the NuA4/Ti60-HAT complex (BRD8, EPC1,YEAST4, and KAT5) was found within module M3.More importantly, we also found several unrelated epigenetic regulators (SMN2 and SMYD2) in the same module (M5), which showed unreported transcriptional regulations between these epigenetic regulators.Clearly, this network provides comprehensive and novel insight into the interactions among hundreds of epigenetic regulators.
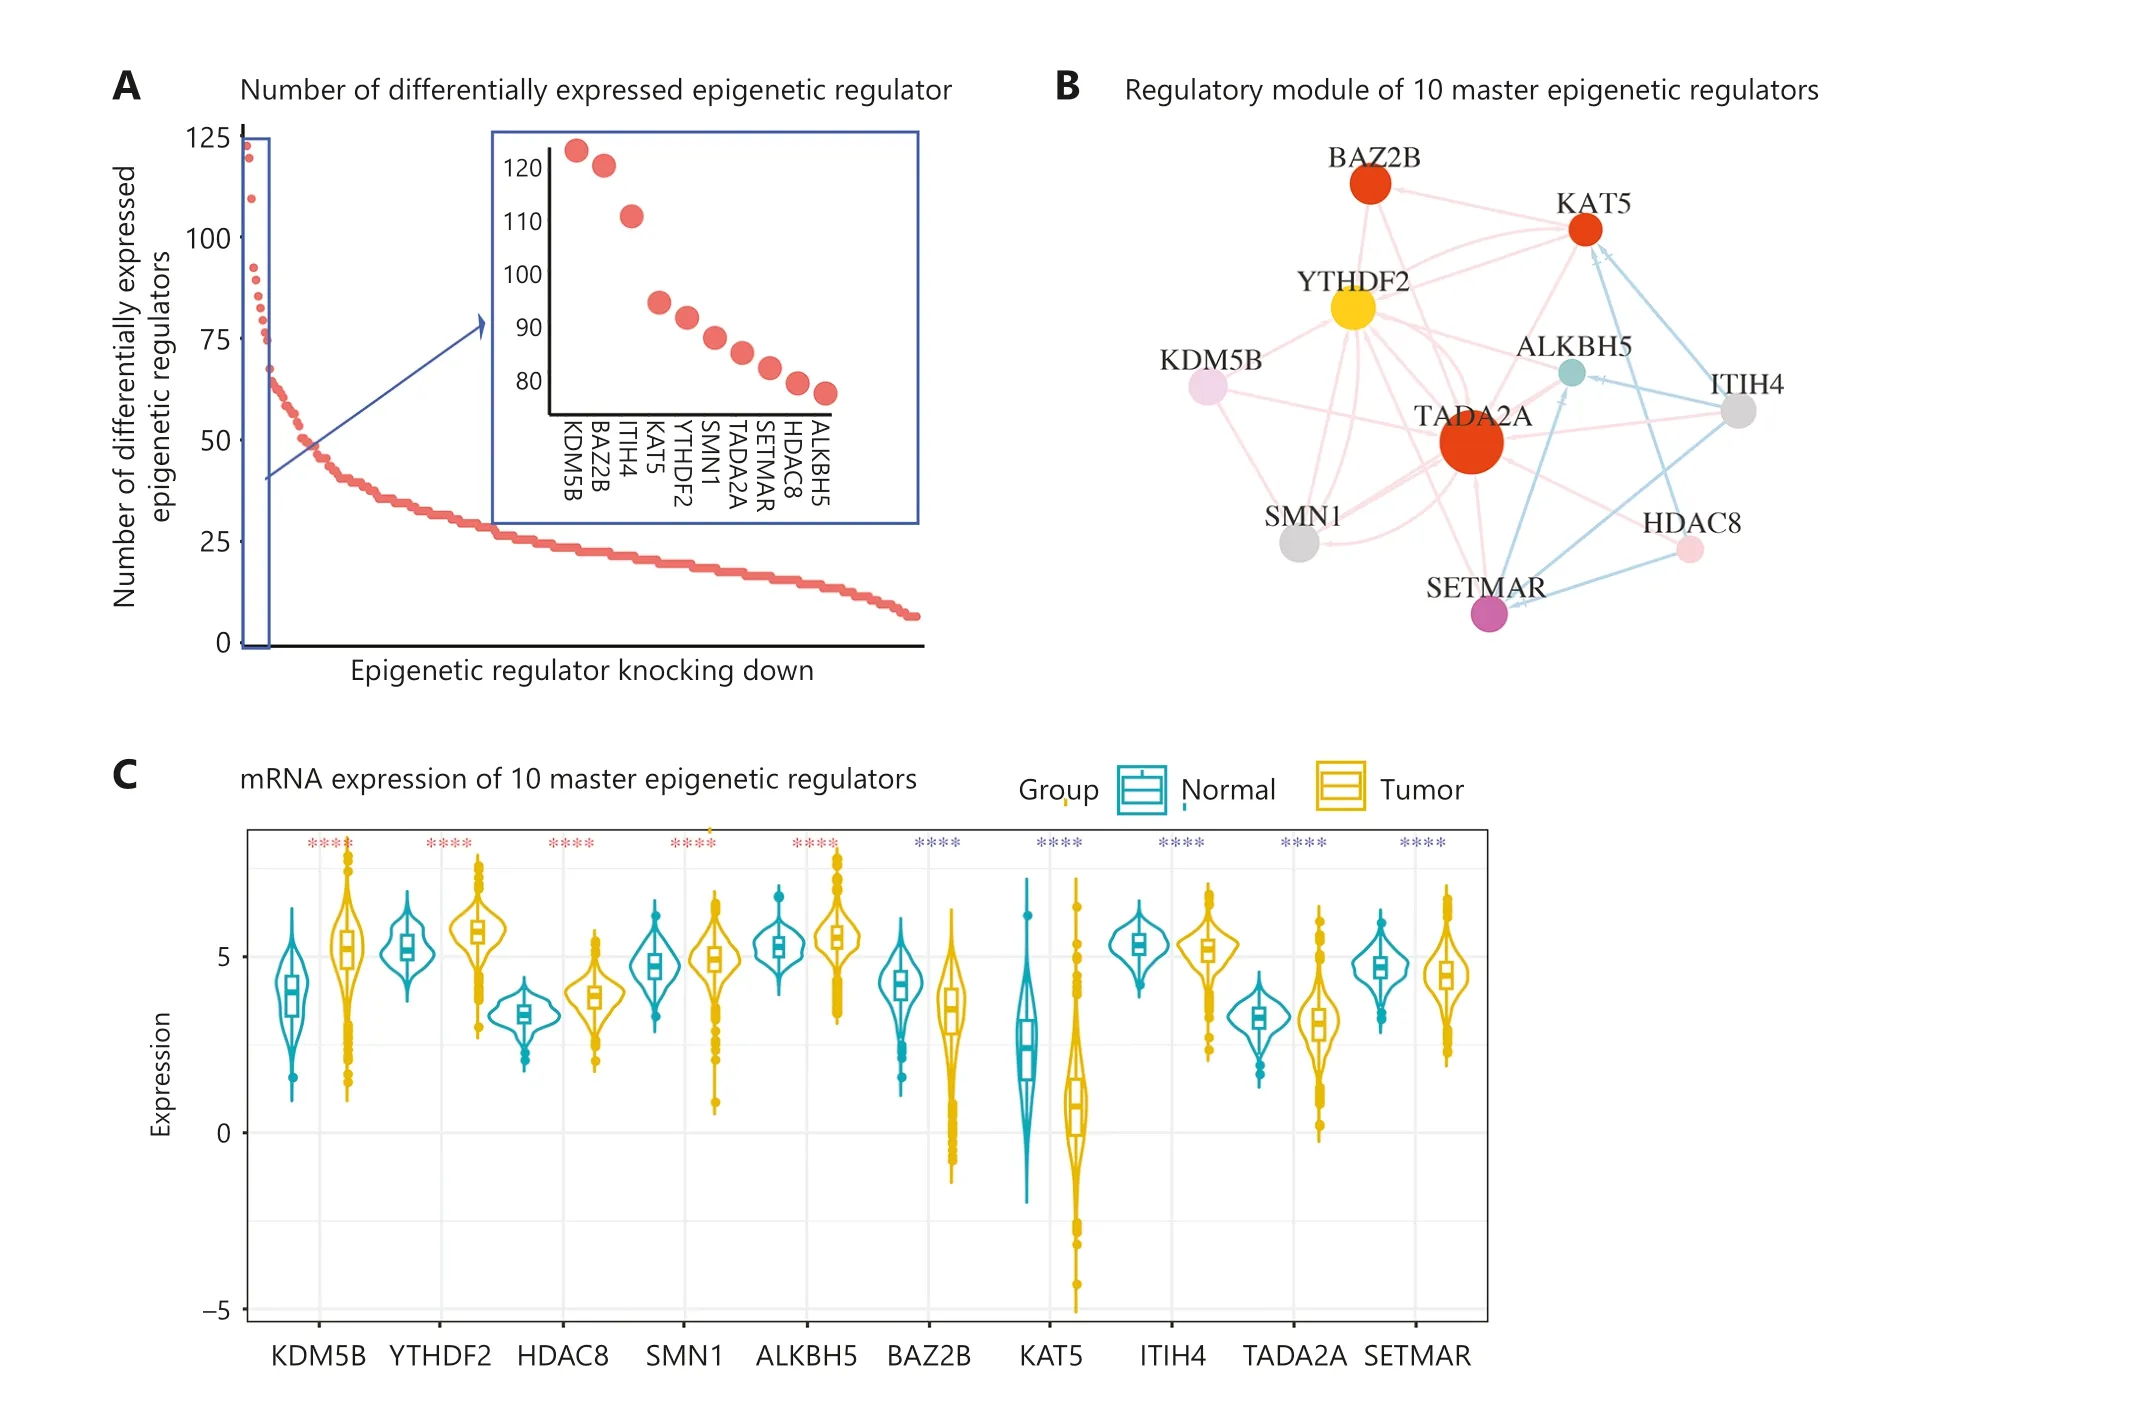
Figure 6 Continued

Figure 6 Ten master epigenetic regulators in breast cancer.(A) Number of differentially-expressed epigenetic regulators regulated by knocking down 10 master epigenetic regulators.(B) Regulatory network of epigenetic regulators.(C) RNA expression of the epigenetic regulators in BRCA and normal tissues.The dark turquoise represents the normal samples, and the goldenrod represents the tumor samples.the red star means the master epigenetic regulator was unregulated in BRCA, and the blue star means master epigenetic regulator was downregulated in BRCA.(D) Protein expression of master epigenetic regulators in BRCA and breast tissues.(E) Kaplan-Meier plot showing the relationship of expression of master epigenetic regulators with the survival of breast cancer patients.
Our results showed that ATRX, SETDB1, and TRIM28 were all classified into cluster 5 (Supplementary Table S3).Previous research has already demonstrated that SETDB1 and TRIM28 are members of the same protein complex, and TRIM28 helped in recruiting SETDB1 to genomic loci41, which was consistent with our findings.SETDB1, an H3K9 methyltransferase, physically interacts with ZNF274/TRIM28/SETDB1 in chromatin and correlates with H3K9me3 enrichment, where ATRX is involved42.Taken together, these results further indicated that the gene expression signatures of 299 epigenetic regulators and our bioinformatic analysis are reliable.More importantly, our data and analysis provided a novel approach to facilitate the discovery of unknown crosstalk between epigenetic regulators.
CLOCK, an important circadian clock gene, has been identified as a significant modifier of breast cancer43.In addition to its role in regulating circadian rhythms, the protein encoded by CLOCK is associated with histone acetyltransferase activity44.It is well known that HDAC8 serves as an epigenetic “eraser”and preferentially mediates the deacetylation of H3K9ac45,46.Our results revealed that CLOCK antagonizes HDAC8 in the regulation of downstream gene expression, which is clearly consistent with these reports.Based on these findings, we speculate that HDAC8 might specifically deacetylate the H3K9ac, which were modified by CLOCK.Experimental validation is warranted to further understand the relationship between these regulators and elucidate the underlying molecular mechanisms.
Conclusions
In summary, by utilizing the gene expression signatures generated by knocking down 400 epigenetic regulators and the HTS2assay, we identified master epigenetic regulators and unveiled intrinsic relationships among the master epigenetic regulators in the context of breast cancer.In addition to providing a comprehensive transcriptional dataset on epigenetic regulation, our findings further offer valuable insight into the landscape of epigenetic regulation and provide potential drug targets for breast cancer treatment.
Grant support
This work was supported by grants from the National Natural Science Foundation of China (Grant No.82172723),the Natural Science Foundation of Sichuan (Grant Nos.2023NSFSC1828 and 2022NSFSC1289), the “Xinglin Scholar”Scientific Research Promotion Plan of Chengdu University of Transitional Chinese Medicine (Grant No.BSH2021003), the Innovation Team and Talents Cultivation Program of National Administration of Traditional Chinese Medicine (Grant No.ZYYCXTD-D-202209), and the Research Funding of Department of Science and Technology of Qinghai Province(Grant No.2023-ZJ-729).
Conflict of interest statement
No potential conflicts of interest are disclosed.
Author contributions
Conceived and designed the analysis: Yumei Wang, Haiyang Wang, Shasha Li, and Dong Wang.
Collected the data: Haiyan Wang, Wei Shao, Yuhui Chen, Chao Hu, and Lijun Huang.
Contributed data or analysis tools: Yu Gui and Xiaohong Yi.Performed the analysis: Yumei Wang and Shasha Li.
Wrote the paper: Yumei Wang and Dong Wang.
Data availability statement
The authors confirm that the data supporting the findings of this study are available within the article.
杂志排行

Cancer Biology & Medicine的其它文章
- Genomic medicine in clinical practice: national genomic medicine program in Japan
- Current and future trends in whole genome sequencing in cancer
- Improving the value of molecular testing: current status and opportunities in colorectal cancer precision medicine
- The evolution of cancer genomic medicine in Japan and the role of the National Cancer Center Japan
- Emerging mechanisms and implications of cGAS-STING signaling in cancer immunotherapy strategies
- The role of intestinal flora on tumorigenesis, progression,and the efficacy of PD-1/PD-L1 antibodies in colorectal cancer