Speed and surface steepness affect internal tibial loading during running
2024-01-25HannahRicMarkusKurzPatrickMaiLonRobrtzKvinBillTimothyDrrickStffnWillwachr
Hannah Ric,Markus Kurz,Patrick Mai,Lon Robrtz,Kvin Bill,Timothy R.Drrick,Stffn Willwachr
a Department of Physical Performance,Norwegian School of Sport Sciences,Oslo 0806,Norway
b Sports Tech Research Centre,Mid Sweden University,Östersund SE-831 25,Sweden
c Department of Mechanical and Process Engineering,Offenburg University of Applied Sciences,Offenburg 77652,Germany
d Institute of Biomechanics and Orthopaedics,German Sport University Cologne,Cologne 50933,Germany
e Department of Kinesiology,Iowa State University,Ames,IA 50011,USA
Abstract Background:Internal tibial loading is influenced by modifiable factors with implications for the risk of stress injury.Runners encounter varied surface steepness (gradients) when running outdoors and may adapt their speed according to the gradient.This study aimed to quantify tibial bending moments and stress at the anterior and posterior peripheries when running at different speeds on surfaces of different gradients.Methods: Twenty recreational runners ran on a treadmill at 3 different speeds (2.5 m/s,3.0 m/s,and 3.5 m/s) and gradients (level: 0%;uphill:+5%,+10%,and +15%;downhill: 5%,10%,and 15%).Force and marker data were collected synchronously throughout.Bending moments were estimated at the distal third centroid of the tibia about the medialateral axis by ensuring static equilibrium at each 1% of stance.Stress was derived from bending moments at the anterior and posterior peripheries by modeling the tibia as a hollow ellipse.Two-way repeated-measures analysis of variance were conducted using both functional and discrete statistical analyses.Results: There were significant main effects for running speed and gradient on peak bending moments and peak anterior and posterior stress.Higher running speeds resulted in greater tibial loading.Running uphill at+10%and+15%resulted in greater tibial loading than level running.Running downhill at 10%and 15%resulted in reduced tibial loading compared to level running.There was no difference between +5%or5%and level running.Conclusion: Running at faster speeds and uphill on gradients +10% increased internal tibial loading,whereas slower running and downhill running on gradients 10% reduced internal loading.Adapting running speed according to the gradient could be a protective mechanism,providing runners with a strategy to minimize the risk of tibial stress injuries.
Keywords: Bending moments;Gradient;Musculoskeletal modeling;Overuse injury;Tibial stress;Training factors
1.Introduction
Running is one of the most popular and accessible forms of physical activity worldwide,but is associated with a high risk of injury,particularly to the lower limbs.1Bone stress injuries are some of the most problematic,as they require lengthy recovery periods.Stress fractures are the most severe stress injuries and comprise up to 30% of running-related injuries,2of which the tibia is the most common site.3
The high risk of stress injuries in runners is due in part to the repetitive loading,4,5which can lead to microdamage accumulation.Microdamage accumulation is a normal response to bone loading and can be beneficial if it does not exceed the structure-specific load capacity.6However,excessive accumulation can impair bone properties,7increasing susceptibility to stress fractures.8
Running technique factors can influence internal tibial loading,as observed when running with different step lengths9and widths.10Running speed can also influence tibial loading.Meardon et al.11reported greater peak compression when running at faster speeds,and according to a probabilistic model,Edwards et al.12found that running at faster speeds increased the risk of a stress fracture.
Distance running in real-world settings typically requires periods of uphill and downhill running.There is only limited understanding of the influence of gradient on lower limb loading during running.Increased external ground reaction force variables were observed during downhill running,13,14which the authors suggested may increase the risk of injury to lower extremities.However,external loading should not be considered to be representative of internal loading.15Baggaley et al.16found that internal tibial forces and moments were lower when running downhill compared with level running,suggesting the risk of injury from such activity may be reduced at the tibia.Furthermore,in vivostrain gauge data showed reduced compressive tibial strain when running downhill compared with level running.17
When considering the influence of uphill running on lower limb loading,Gottschall and Kram13found lower external forces during uphill running compared with level running but did not consider internal loading.When quantifying internal loading,Baggaley et al.16found no reduction in peak internal tibial moments when running uphill compared to level.These previous studies were conducted at a fixed running speed.However,runners likely adapt their running speed according to changes in the surface gradient.18It is unclear whether running speed and surface gradient interact to affect internal tibial loading.
This study aimed to determine the influence of running speed,surface gradient,and the interaction between them on tibial bending moments and anteriorosterior stress during running.Based on existing findings where internal tibial loading has been quantified,it was hypothesized that internal tibial loading would increase with increased running speed and decrease when running downhill compared to a level surface,but that would not change when running uphill.It was further hypothesized that the influence of running speed on tibial stress would be different when running uphill compared to downhill.
2.Materials and methods
2.1.Participants
Recreational runners were recruited through announcements (at the German Sport University Cologne,Germany).Participants ran at least 10 km per week,had not been diagnosed with a running-related overuse injury within the last year,and were older than 18 years of age.The final sample included 11 male and 9 female runners (age=244 years;height=1.760.06 m;mass=67.84.0 kg;weekly mileage=2313 km;meanSD).This sample exceeded the suggested sample size required to detect interaction effects for the peak tibial moment,using an effect size(1.56)obtained from the partialetasquared value derived from the peak internal medialateral(ML)bending moments during graded running.16G*Power 3.1.9.719was used for this calculation,with a power of 0.8.All runners were free of injury and pain at the time of the data collection and signed informed written consent before participating.The Ethics Committee of the German Sports University Cologne approved the study in compliance with the Declaration of Helsinki.
2.2.Experimental setup and protocol
Eighty-two retro-reflective markers representing a full-body marker set were attached to each participant.Lower extremity markers were attached to the following anatomical landmarks:left and right anterior superior iliac spines and posterior superior iliac spines,medial and lateral femoral condyles,as well as medial and lateral malleoli.Furthermore,tracking clusters consisting of 4 markers were attached to the distal lateral aspect of the thigh and the shank.On the running shoe upper,rearfoot markers were attached to the calcaneus’s medial,lateral,and posterior aspects.Forefoot markers were attached to the head of the first and fifth metatarsal and the head of the first distal phalanx.
Three-dimensional marker trajectories and ground reaction force data were recorded with 17 infrared cameras (200 Hz,Type 5+and 700;Qualisys,Gteborg,Sweden) and synchronized with an instrumented treadmill (2000 Hz,Gaitway 3D;HP Cosmos,Traunstein,Germany).Before data collection,participants were able to familiarize themselves with the different uphill and downhill conditions at a self-selected speed.After familiarization,the participants performed runs at 2.5 m/s,3.0 m/s,and 3.5 m/s on 3 uphill (+5%,+10%,and+15%) and 3 downhill (5%,10%,and15%) treadmill gradients as well as level running (0%).The order of the running speeds and surface gradients was randomized.For each condition,30-s recordings were started after the treadmill belt had reached the target speed,and the participants had a visually stable running form.Manual adjustment of the surface gradients ensured a sufficient rest period for the participants.Runners were asked to run in their own running shoes.
2.3.Data analysis
The stance phase was defined as the period in which the unfiltered vertical ground reaction force exceeded a 20 N threshold.Marker and force data were filtered with a recursive 4th order low pass Butterworth filter with a cut-off frequency of 20 Hz.20Ten steps of data were analyzed for each participant in each condition.Each stance phase was normalized to 101 points.A customized Matlab (R2021a;Math Works,Natick,MA,USA) program was written to estimate tibial stress at the peripheral distal third of the tibia.To account for the different treadmill gradients in the present study,the joint reaction force was rotated relative to the global coordinate system prior to translation into the shank coordinate system.Stress was derived from internal tibial forces and moments,which were quantified by ensuring static equilibrium at each 1% of the stance phase.16,21In the present study,ankle joint contact forces were applied to the distal tibia16(rather than knee joint contact forces at the proximal tibia21),which was expected to minimize the errors that result from estimating the biarticular gastrocnemius muscle force contribution to tibial loading via the proximal tibia.
This study estimated muscular forces from 11 muscles spanning the distal third of the tibia:soleus,medial and lateral gastrocnemii,tibialis anterior and posterior,extensor digitorum longus,flexor digitorum longus,flexor hallucis longus,peroneus brevis,peroneus longus,and extensor hallucis longus.These were summed with the joint reaction forces to obtain joint contact forces.The details of the lower limb musculoskeletal model are similar to those reported previously,21where muscular forces were estimated using a customized Matlab static optimization program (MathWorks) with a cost function minimizing the sum of cubed muscle stresses.Muscular forces were constrained to be equal to the sagittal plane hip,knee,and ankle moments.21Muscle definitions were obtained from the Hamner model,22whereas lower extremity joint definitions were based on the Delp model.23The angle between the muscular force and the tibia was estimated based on each muscle’s line of action.
Resultant bending moments at the distal third tibial centroid were the sum of the moments due to internal muscular forces and external reaction forces.The resultant bending moments reported here were about the centroid ML axis(contributing to anteriorosterior stress).To estimate stress,the tibial crosssection was represented as a hollow ellipse,10,21using geometry presented by Franklyn et al.24Stresses at the distal third anterior and posterior tibial peripheries were the axial stress minus (anterior) and plus (posterior) the bending stress.10,21Axial stresses were estimated by dividing the resultant axial force at the centroid by the cross-sectional area of the hollow ellipse.Bending stresses were the product of the resultant ML bending moment and the distance to the ellipse anterior/posterior periphery divided by the area moment of inertia of the hollow ellipse about its ML axis.
2.4.Statistical analysis
A two-way repeated-measures (running speed: 3 levels;surface gradient:7 levels)analysis of variance was conducted to assess the influence of the independent variables and their interaction on outcome variables.Outcome variables were peak tibial bending moments about the ML axis and peak anterior/posterior stress as well as ground contact time (GCT) and step frequency.The peak magnitudes were evaluated because the peak is the most important aspect in terms of stress fracture risk.25-27Additionally,in order to establish whether there were any differences in the pattern of loading throughout stance,Statistical Parametric Mapping (SPM) analyses were conducted.All statistics were conducted using Matlab (R2021a and R2021b;Math Works)and an open-source code28for SPM analyses,with a significance level of 0.05.Time series were compared between 10% and 90% of stance due to noise arising in the kinetic treadmill data during the first and last 10% of stance that was deemed not to be physiologically meaningful.Partialetasquared()indicated effect size for the main effects.Post hoctests with Bonferroni-correctedalphalevels (acorrected)were used to identify differences between the main effect of speed (3 comparisons,acorrected=0.0167) and the main effects of surface gradient (6 comparisons,acorrected=0.0083);all comparisons were with level running.Cohen’sdeffect sizes indicated the strength of the main effects ofpost hocanalyses.29Effect sizes were interpreted as trivial (d:0-0.19),small(d:0.20-0.49),medium(d:0.50-0.79),and large(d0.80).
Deriving stress from bending moments means that the outcome of statistical analyses was likely similar for these variables.Therefore detailedpost hoccomparisons are presented for the bending moments and posterior stress but not anterior stress,as tibial stress fractures more commonly occur at the posterior tibia.30-32Detailed statistical results for each parameter andpost-hoccomparison results for anterior stress can be found in the Supplementary Figures and Tables.Stride length and GCT were reported to aid interpretation.
3.Results
3.1.Peak ML bending moments
There was no interaction effect (F(5,142)=0.588,p=0.714) on peak ML bending moment magnitudes.There was a significant main effect (F(1,138)=75.027,p<0.001;=0.789) for running speed on the bending moment,which increased with increased running speed regardless of gradient.On average,a 0.5 m/s increase in running speed resulted in an 8 Nm greater bending moment.Gradient significantly affected(F(1,161)=4.923,p=0.032;=0.206)the bending moment.Bonferroni-correctedpost hocpairwise comparisons(acorrected=0.0083) showed no difference in peak bending moment between level running and running uphill at +5%(p=0.580;d=0.07)but was significantly higher during uphill running at +10%(p<0.001;d=0.75) and +15%(p<0.001;d=0.95)than level running.Peak bending moment was significantly lower when running downhill at10% (p=0.006;d=0.37) and at15% (p<0.001;d=0.48) than level running.No differences were observed when comparing5%downhill running with level running (p=0.016;d=0.32).Steep downhill running at the slowest speed resulted in the lowest (95.4220.76 Nm) bending moments,and steep uphill running at the highest speeds resulted in the highest(151.65-63.14 Nm)bending moments(Fig.1A;Supplementary Fig.1;Supplementary Table 1).
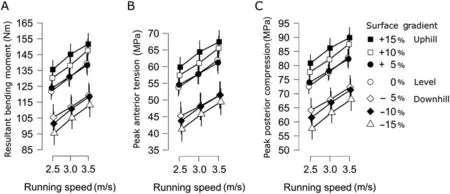
Fig.1.Magnitudes of the(A)resultant bending moment,(B)peak anterior tension,and(C)peak posterior tibial compression for the 3 different running speeds and 7 different gradients(n=20).Error bars represent the standard error within each condition.
3.2.Peak anterior and posterior stress
There was no interaction effect on peak posterior(F(5,133)=0.576,p=0.723) or anterior (F(5,130)=0.585,p=0.716) stress.There was a significant main effect for running speed on peak posterior (F(1,123)=77.923,p<0.001;=0.804)and anterior(F(1,156)=70.875,p<0.001;=0.181)stress(Fig.1B and 1C;Supplementary Figs.2 and 3;Supplementary Tables 2 and 3).Bonferroni-correctedpost hocpairwise comparisons (acorrected=0.0167) showed that peak posterior stress increased from 2.5 m/s to 3.0 m/s (p<0.001;d=1.08),from 2.5 m/s to 3.5 m/s(p<0.001;d=1.44)and from 3.0 m/s to 3.5 m/s(p<0.001;d=1.13)when pooling gradient conditions.An increase in running speed from 2.5 m/s to 3.0 m/s and 3.0 m/s to 3.5 m/s increased peak posterior stress by 7.0% and 6.0%,on average,and peak anterior stress by 7.6%and 6.7%,respectively.
There was a significant main effect for gradient on peak posterior(F(1,188)=5.716,p=0.021;=0.231)and anterior(F(1,138)=4.190,p<0.049;=0.789) stress (Fig.1B and 1C;Supplementary Figs.2 and 3;Supplementary Tables 2 and 3).Bonferroni-correctedpost hocpairwise comparisons(acorrected=0.0083) showed no difference in peak posterior stress between level running and running uphill at +5%(p=0.900;d=0.02)or downhill at5%(p=0.016;d=0.30).Peak posterior stress was significantly higher during uphill running at+10% (p<0.001;d=0.82) and+15% (p<0.001;d=1.03) than level running.Peak posterior stress was significantly lower when running downhill at10% (p=0.004;d=0.39) and at15% (p<0.001;d=0.53) than level running.When averaging across running speeds,an increase of 5%in surface incline increased posterior and anterior stress by 3.7 MPa and 3.0 MPa,respectively,compared with level running.Running downhill at5%,10%,and15%reduced peak posterior stress by 9.5 MPa,11.1 MPa,and 14.6 MPa,respectively,and reduced peak anterior stress by 9.5 MPa,10.1 MPa,and 12.3 MPa,respectively.
3.3.Time-series analysis
SPM analyses revealed a significant interaction effect on posterior (p=0.020) and anterior (p=0.019) stress between 87% and 90% of stance.This was not considered physiologically meaningful,as the magnitudes are relatively low at this stance phase and peak stress typically occurs close to midstance.16Therefore,main effects were considered.There was a statistically significant main effect for running speed on both posterior and anterior stress between 27% and 90% of stance(bothp<0.001;Fig.2).There was also a significant(p<0.001) main effect for gradient on posterior stress between 11% and 78% of stance and anterior stress between 11% and 62% of stance (bothp<0.001;Fig.3).SPM analyses outcomes for the ML bending moment are presented in Supplementary Fig.4.

Fig.2.Time series displaying anterior (solid lines) and posterior (dashed lines) stress during the stance phase of running when running at different speeds.Curves represent the mean value with SD presented as a shaded region surrounding the time series.Gray shaded regions indicate the time points during which there was a significant speed main effect for anterior (region above 0 MPa)and posterior(region below 0 MPa).Positive stress values indicate tensile stress,and negative values indicate compressive stress.

Fig.3.Time series displaying anterior(thicker lines,predominantly positive)and posterior (thinner lines,predominantly negative) stress during the stance phase of running when running at different gradients.Curves represent the mean of the runners(n=20)with 10 steps each.Gray shaded regions indicate the time points during which there was a significant gradient main effect for anterior(region above 0 MPa)and posterior (region below 0 MPa) stress.SD was not presented to maintain clarity of the figure.Positive stress values indicate tensile stress,and negative values indicate compressive stress.
3.4.GCT and step frequency
There was no interaction effect for GCT (p=0.402).GCT was significantly affected by running speed (p<0.001;=0.430) and decreased systematically with an increase in running speed (Supplementary Table 4 and Supplementary Fig.5).GCT was not affected by gradient (p=0.344).There was an interaction effect and main effects for step frequency(p<0.001) (Supplementary Table 5;Supplementary Figs.5 and 6).Step frequency increased when running faster and when running at steeper inclines.Compared to level running,step frequency was reduced when running downhill.The step frequency was consistent within all downhill running conditions.
4.Discussion
This study quantified the influence of running speed and gradient on tibial bending moments and stress.It compared peak values and time series between conditions,giving insight into the magnitude and pattern of loading experienced by the tibia.Contrary to the hypothesis,there was no meaningful interaction effect between running speed and gradient,suggesting that changes to either factor have an independent effect on internal tibial loading.The ML bending moments were predominantly negative throughout stance,indicating a tendency to bend the tibia in a concave posterior direction.This bending resulted in predominantly tensile stress in the anterior tibia and compressive stress in the posterior tibia,as reported previously.10,21,33-35Averaged across all conditions,peak bending moments due to muscular forces were 6.5 times greater than those due to the joint reaction forces,and peak bending stress was 5.9 times greater than peak axial stress.
Magnitudes of peak ML bending moment(~139 Nm:level running at 3.5 m/s) were similar to those previously reported during level running at 3.4 m/s,21but approximately half the magnitude reported by Baggaley et al.16(level running at 3.33 m/s).The present study used an approach similar to that of Baggaley et al.,16in which forces were applied to the distal rather than proximal tibia,but it used a musculoskeletal model that was more similar to that of Rice et al.21Therefore,the discrepancy between magnitudes is likely influenced by the muscular force estimation,which relies on a number of assumptions and simplifications that can introduce error.It is difficult to both estimate and validate muscular forces during human movement.Electromyography data can provide a useful qualitative comparison with modelled values but cannot be simply or directly translated into a force magnitude.In the present study,the peak muscular force from the soleus muscle was on average 4.6 times greater than the force from the combined gastrocnemii muscles.This is similar to previous values,36in which electromyography data combined with musculoskeletal modelling showed that contributions to peak vertical ground reaction force from the soleus muscle were 3.5 times greater than from the gastrocnemii muscles during level running at 3.5 m/s.
As hypothesized,bending moments and stresses were greater when running at faster speeds.The SPM analyses show that the loading was greater at faster running speeds throughout the majority of stance,which explains the higher peak value.This entire loading period may be important in terms of stress injury development when repeated over many steps.Peak posterior stress during level running was 14%higher at 3.5 m/s than 2.5 m/s.When comparing the same speeds during level running,Edwards et al.12reported tibial contact forces that were 18%higher and strains that were 27%higher at the higher speeds.The greater magnitudes of internal loading at faster speeds may increase the risk of stress fracture.Mechanistically,this could be due to an increased mechanical energy requirement when running faster,requiring greater activity of the muscles that span the tibia,and this could drive the observed increases in internal tibial loading.16Running intensity,influenced by speed and gradient,likely affects the choice of run duration and distance in a real-world setting.In general,running at a faster speed leads to a shorter running duration than when running at a slower speed.This also influences the total number of loading cycles experienced per run.However,Edwards et al.12suggested that the magnitude is more important than the number of loading cycles in terms of risk.
Internal tibial loading was reduced when running downhill on gradients greater than 5% compared with level running,which supports our hypothesis as well as data from Baggaley et al.16Peak posterior stress was 14% and 19% lower when running downhill at10% and15% gradients,respectively,compared with level running.The running technique adopted to run downhill may explain the change in tibial loading,with the extent of the decline being less influential.According to the SPM analyses,the differences as a result of gradient occur throughout the majority of stance.The magnitude of the ankle joint contact force was reduced when running downhill compared with level running (average:11% across speeds).This supports the previous observation by Baggaley et al.16where the reduction in tibial loading during downhill running was suggested to be due predominantly to the reduced contact force magnitude.16This contact force vector was also more axially oriented when running downhill(level:80.3˚vs.downhill 15%: 81.6˚,averaged across speeds),further contributing to this reduction.Step frequency was decreased when running downhill,but was not different between downhill gradients.However,the changes in step frequency have a counterintuitive influence on tibial loading in the present study,as a reduced step frequency would be expected to increase tibial loading.9The foot position relative to the shank could explain some of the changes in tibial loading observed when running downhill,as this influences the moment arms to the muscles and the angle between the muscular forces and the tibia.In summary,these findings support existing evidence showing that running downhill may result in reduced tibial loading,16,17which may reduce the risk of a stress fracture.It remains unclear whether reduced tibial loading during downhill running would be maintained over longer periods of running.
Compared with level running,internal loading increased when running uphill at 10% and 15% but not at 5% incline.In contrast,Baggaley et al.16found no difference in peak internal moments between level running and running on an 8.7% (5˚)incline or a 17.6% (10˚) incline.This may be the result of different strategies adopted by the runners across the studies.In the present study,when running uphill at 15%,the magnitude of the ankle joint contact force was 11.4%greater than during level running (averaged across running speeds),which is likely the main explanation for the increased internal loading.This may explain the differences from Baggaley et al.,16who found that the magnitude of the contact force was lower during uphill running than level running and that the vector was 0.8˚more posteriorly oriented when comparing 17.6% uphill with 0%.In the present study,the contact force vector was 0.4˚more posterior during uphill running(level:80.3˚vs.15%uphill:79.9˚,averaged across speeds),which may have further contributed to the increased internal loading observed.In the present study,step frequency increased when running uphill,whereas step frequency was not reported by Baggaley et al.,16who observed a more flexed posture when running uphill which,again,could alter the moment arms to the muscles that contribute to the bending moment.Therefore,the differences observed between the studies may be the result of differences in running strategy,differences in model parameters,or a combination of both.In general,increased tibial loading when running uphill and decreased loading when running downhill may result from a respective increase and decrease in mechanical energy requirement when running up and downhill,due to the raising and lowering of the center of mass.Overall,the evidence relating to uphill running remains more contradictory than downhill running.
Runners vary their speed according to the gradient,generally decreasing speed when running uphill and increasing speed when running downhill.18This is understood to be a performance-enhancing adaptation that allows runners to maintain more consistent oxygen consumption throughout a run on varied terrain.18Such running speed alterations,although driven by the goal of improved performance,may have unintended,beneficial implications for injury prevention.From the perspective of tibial loading,the data here suggest that runners can“afford” to run at faster speeds when running downhill without tibial loading exceeding that during slower level running.Similarly,reducing speed when running uphill could help to maintain tibial loading levels below or similar to those experienced during level running.Therefore,moderating running speed could be a mechanism to both maintain oxygen uptake and minimize the risk of stress injury.Whether runners adapt their self-selected running speed to run with a consistent magnitude of peak tibial loading according to the gradient is worthy of investigation.
Previous studies found increased external forces during downhill running and concluded that this might increase the risk of lower extremity injury,13,14even suggesting that people recovering from injury may benefit from avoiding downhill running and may consider incorporating only uphill running.13No previous studies focused exclusively on the tibia;thus,the present study highlights the value of treating sites independently when considering injury risk.Additionally,it emphasizes the importance of estimating internal loading rather than making assumptions based only on external loads,such as ground reaction force variables,when considering the human tibia.15
Estimating internal tibial loading through musculoskeletal modeling is a valuable tool for improving our understanding of injury risk,but it relies on several assumptions that may reduce the validity of the values.In particular,the combined muscular forces are the greatest contributors to peak loading of the tibia,and these estimates are subject to the limitations of static optimization and musculoskeletal modeling.Direct validation of these approaches is not currently possible.Also,the approach of representing the tibia as a hollow ellipse results in geometry that is not representative for each individual participant and so an inability to quantify strain without estimates of material properties.Therefore,such models are most appropriate for assessing within-participant changes in the loading environment,as in the present study,and the relative change is arguably more important than the absolute magnitudes of loading reported.
SPM analysis considers the entire stance phase of running in each condition but requires time-normalization of the data.Running speed influences GCT,and the influence of this is effectively removed when conducting SPM analyses.However,in the present study,the outcomes from the discrete analyses supported those from the SPM analyses,providing reassurance in the interpretation of the results.
Running on an inclined or declined surface at the highest running speeds can be challenging,and participants were likely less accustomed to these running conditions than to level running.Unfamiliarity would more likely explain increased tibial loading than the systematic decrease observed when running downhill.The findings here represent an acute change in the loading environment,and it should not be assumed that the same changes would be present after prolonged running on a fixed gradient.Finally,it is unclear whether the loading of other lower limb structures changes in a similar or opposite manner when running at different speeds or on different gradients.A reduction in the risk of one type of injury may increase the risk of others.
5.Conclusion
Running at faster speeds increases the internal tibial loading,regardless of gradient.Running downhill at10%or15% reduces internal tibial loading,whereas running uphill at 10% or 15% increases internal tibial loading,regardless of running speed.This suggests that running at faster speeds or on inclines of10% may increase the risk of a tibial stress injury,whereas downhill running may reduce this risk.Runners tend to adapt their running speed according to the gradient,and this mechanism may serve to maintain consistent levels of tibial loading during a run with varying gradients.
Authors’contributions
SW and PM conceived,planned and designed the study,analysed the data,and drafted,revised,and edited the manuscript;HR and TRD analysed the data,and drafted,revised,and edited the manuscript;MK,LR,and KB assisted with data collection and development of the program as well as drafted,revised,and edited the manuscript.All authors have read and approved the final version of the manuscript,and agree with the order of presentation of the authors.
Competing interests
The authors declare that they have no competing interests.
Supplementary materials
Supplementary materials associated with this article can be found in the online version at doi:10.1016/j.jshs.2023.03.004.
杂志排行

Journal of Sport and Health Science的其它文章
- 2024 Adult Compendium of Physical Activities:A third update of the energy costs of human activities
- Older Adult Compendium of Physical Activities:Energy costs of human activities in adults aged 60 and older
- 2024 Wheelchair Compendium of Physical Activities:An update of activity codes and energy expenditure values
- Alexa,let’s train now!—A systematic review and classification approach to digital and home-based physical training interventions aiming to support healthy cognitive aging
- The influence of resistance exercise training prescription variables on skeletal muscle mass,strength,and physical function in healthy adults:An umbrella review
- A systematic scoping review of study methodology for randomized controlled trials investigating probiotics in athletic and physically active populations