Toward Quantifying the Increasing Accessibility of the Arctic Northeast Passage in the Past Four Decades※
2023-12-26ChaoMINXiangyingZHOUHaoLUOYijunYANGYiguoWANGJinlunZHANGandQinghuaYANG
Chao MIN, Xiangying ZHOU, Hao LUO*, Yijun YANG, Yiguo WANG,Jinlun ZHANG, and Qinghua YANG
1School of Atmospheric Sciences, Sun Yat-sen University, and Southern Marine Science and Engineering Guangdong Laboratory (Zhuhai), Zhuhai 519082, China
2Department of Atmospheric and Oceanic Sciences, Fudan University, Shanghai 200438, China
3Nansen Environmental and Remote Sensing Center and Bjerknes Centre for Climate Research, 2007 Bergen, Norway
4Polar Science Center, Applied Physics Lab, University of Washington, Seattle, WA 98105, USA
ABSTRACT Sea ice, one of the most dominant barriers to Arctic shipping, has decreased dramatically over the past four decades.Arctic maritime transport is hereupon growing in recent years.To produce a long-term assessment of trans-Arctic accessibility, we systematically revisit the daily Arctic navigability with a view to the combined effects of sea ice thickness and concentration throughout the period 1979-2020.The general trends of Navigable Windows (NW) in the Northeast Passage show that the number of navigable days is steadily growing and reached 89±16 days for Open Water (OW) ships and 163±19 days for Polar Class 6 (PC6) ships in the 2010s, despite high interannual and interdecadal variability in the NWs.More consecutive NWs have emerged annually for both OW ships and PC6 ships since 2005 because of the faster sea ice retreat.Since the 1980s, the number of simulated Arctic routes has continuously increased, and optimal navigability exists in these years of record-low sea ice extent (e.g., 2012 and 2020).Summertime navigability in the East Siberian and Laptev Seas, on the other hand, varies dramatically due to changing sea ice conditions.This systematic assessment of Arctic navigability provides a reference for better projecting the future trans-Arctic shipping routes.
Key words: Arctic sea ice, Arctic shipping, climate change, human-environment
1.Introduction
The Arctic is undergoing more than twice the warming rate relative to the global temperature average (Cohen et al.,2014).As a result, the Arctic sea ice cover at the end of summer has retreated by 13.0% per decade compared with the mean state of 1981–2010 (Lindsey and Scott, 2020).Likewise, the sea ice thickness (SIT) also suffers from a considerable loss determined by both observations and simulations(Lindsay and Schweiger, 2015; Kwok, 2018; Labe et al.,2018; Schweiger et al., 2019).In addition, according to the state-of-the-art Coupled Model Intercomparison Project Phase 6 (CMIP6) projections, the Arctic sea ice will very likely continue to shrink and the first September ice-free Arctic will likely emerge before 2050 (Notz and SIMIP Community, 2020; Årthun et al., 2021; IPCC, 2021).The latest research shows that the Arctic shipping opportunities for ordinary (OW) ships and moderately ice-strengthened (PC6)ships will increase substantially even under the sustainable green energy scenario (SSP126); furthermore, PC6 ships will be able to traverse the Arctic shipping routes yearround starting in the 2070s under the highest greenhousegas emissions (SSP585) (Min et al., 2022).The persistent loss of Arctic sea ice and prospective shipping opportunities have spurred tremendous interest from shipping industries and policymakers because of the abundant economic benefits of Arctic shipping.
The Arctic shipping routes including the Northeast Passage (NEP) and Northwest Passage (NWP) emerge as shortcuts that bridge Pacific ports and Atlantic ports.For instance, the voyage distance from a Northwest-Europe port to an Asian port is reduced by about 40% through the NEP relative to the Suez Canal; meanwhile, the sailing time, fuel consumption and shipping emissions are also lessened (Liu and Kronbak, 2010; Schøyen and Bråthen, 2011; Browse et al.,2013; Farré et al., 2014).Facilitated by economic benefits,shipping operations, mainly from European companies, are rapidly increasing, as shown by the statistics of Automatic Identification System data (Eguíluz et al., 2016; Gunnarsson,2021; Gunnarsson and Moe, 2021).The majority of Arctic shipping activities are concentrated in the NEP and the annual total deadweight tonnage has increased by 623%from 2013 to 2018 (Eguíluz et al., 2016; Li et al., 2021a).Furthermore, 4.7% of global trade is projected to operate in the NEP, implying that approximately two-thirds of trade transported through the Suez Canal will re-route in this shortcut in the near future (Bekkers et al., 2018).Given that the sea ice decline is likely to continue, climate model outputs are widely applied to project the navigability of the Arctic Ocean (Khon et al., 2010; Stephenson et al., 2011; Rogers et al., 2013; Smith and Stephenson, 2013; Stephenson and Smith, 2015; Melia et al., 2016; Khon et al., 2017; Wei et al., 2020; Chen et al., 2021; Li et al., 2021c; Mudryk et al.,2021).For instance, the navigability of NEP is practically projected in the future with sea ice simulations from model outputs (Khon et al., 2010; Smith and Stephenson, 2013;Stephenson et al., 2014; Khon et al., 2017; Chen et al.,2020).
Nevertheless, only a few studies have analyzed the historic navigability in the NEP by using sea ice data (e.g., Lei et al., 2015; Ji et al., 2021; Yu et al., 2021; Cao et al., 2022).The seaworthiness of the whole Arctic Ocean has been assessed in a recent study with the usage of a Combined Model and Satellite Thickness (CMST) data set, but it is limited from 2011 to 2016 and the long-term tendency is thus still lacking (Zhou et al., 2021).Because the assessment of historical navigability in the NEP at a climatological time scale is relatively limited, the pre-existing navigability assessments are still incapable of elaborating the changeable accessibility in the NEP.In order to address this, we analyze the navigability in the NEP from the perspective of SIT and sea ice concentration (SIC) provided by the Pan-Arctic Ice-Ocean Modeling and Assimilation System (PIOMAS; Zhang and Rothrock, 2003), given that satellite-retrieved SIT data are primarily restrained from October to April as the retrievals of summer SIT from radar altimeters (e.g., CryoSat-2) or passive microwave radiometers (e.g., SMOS) are limited by the wet and warm snow or ice (Tian-Kunze et al., 2014; Ricker et al., 2017; Dawson et al., 2022).The long-term trend and detailed quantification of Optimal trans-Arctic Shipping Routes (OASR), Sailing Time (ST), Navigable Day (ND),and Navigable Window (NW) are quantified for diverse ship classifications.This study can serve as a reference for shipping companies, stakeholders and Arctic communities for the preplanned arrangements of community resupply, maritime trade and tourism (Mudryk et al., 2021; Lynch et al.,2022).
2.Data and methods
2.1.PIOMAS sea ice data
PIOMAS sea ice output (1979-2020) was used to derive OASR (i.e., the most time-saving shipping routes).PIOMAS is a coupled Parallel Ocean and sea Ice Model(POIM) assimilating near-real-time SIC data from National Snow and Ice Data Center (NSIDC) and sea surface temperature (in the ice-free areas) data from the NCEP/NCAR reanalysis.Atmospheric data that drive this model are also from the NCEP/NCAR reanalysis (Zhang and Rothrock, 2003).PIOMAS SIT has been validated extensively (e.g.,Schweiger et al., 2011; Wang et al., 2016) and used widely by the polar research community (e.g., Labe et al., 2018).Both daily SIT and SIC used in this study are from PIOMAS, which makes sea ice parameters physically consistent.
2.2.Methods for estimating navigation routes
We first interpolated both SIT and SIC onto a 25 km ×25 km Equal-Area Scalable Earth Grid (Brodzik et al.,2012).Then, the OASR was eventually derived with the Arctic Transportation Accessibility Model (ATAM) following previous studies (Stephenson et al., 2011; Smith and Stephenson, 2013; Zhou et al., 2021).The flowchart for estimating navigation routes is shown in Fig.1.More specially, the Ice Multipliers (IM) which represent the level of navigation hazard induced by sea ice thickness (units: cm) could be evaluated for different ship types as follows (Step 1, Fig.1):
Then the navigable abilities for OW ships (no hull ice strengthening) and PC6 ships (moderately ice-strengthened)were determined by the Ice Numerals (IN) following the Canadian Arctic Ice Regime Shipping System (AIRSS)(Step 2, Fig.1):

Fig.1.Flowchart for estimating navigation routes.SIT and SIC are the inputting sea ice thickness andconcentration, respectively.INType is the icenumeral for OpenWater shipsorPolarClass6ships.ST j isthesailing time between twoadjacent grid cells.IN-SSis therelationship betweenIce Numeral(IN)andrelated SafeSpeed (SS).OASR is the optimal trans-Arctic shippingroutebased on the Arctic Transportation Accessibility Model (ATAM).

where the SS(Type,j)and SS(Type,j+1)are the safe speed in grids j and j+1 for related types of ships, the djand dj+1are the distances between the adjacent grid centers, j is the sequence number grid cell.Subsequently, the Dijkstra algorithm (Dijkstra, 1959) was applied to find the OASR with a daily weighted graph of S T(Type,j)(Step 5, Fig.1).The ST for OW/PC6 ships defined in this study was integrated by all ST(Type,j)along an OASR.Navigation routes between the Rotterdam port (51°55′N, 4°30′E) and Bering Strait(65°38′36′′N, 169°11′42′′W) were defined as the NEP.The ND was thus determined as the day that an OASR exists,but for local seas, the regionally averaged accessible day is the day with a positive spatially averaged IN.The NW began on the first of three consecutively navigable days and ended on the first of three consecutively unnavigable days.As in prior studies (Liu et al., 2017; Zhou et al., 2021), the length of NW was then estimated by the time between the start and end dates of NW.It should be noted that the annual navigable timeframe may have multiple navigable windows due to occasionally heavy sea-ice obstacles.Because PIOMAS sea ice data have relatively large uncertainties in underestimating the SIT in the Canadian Arctic Archipelago(Schweiger et al., 2011; Wang et al., 2016), we only discuss the navigability in the NEP.All of the acronyms used in this Arctic navigability assessment are defined in Table 2.
3.Result
To begin, we use ATAM to estimate OASRs day by day from 1979 to 2020.The OASRs from decadal-averaged daily sea ice thickness and concentration (the 1980s, 1990s,2000s, and 2010s) are shown in Fig.2 to illustrate the longterm variation in navigability in the NEP.We find that the quantities of OASRs for both OW ships and PC6 ships generally increase in contrast with the sea ice decline since the 1980s.The growth trend is much more obvious for PC6 vessels which can resist 120 cm thick sea ice.However, for both types of ships, considerable interannual and interdecadal variabilities are exhibited in the amounts of OASRs andtheir spatial distributions resulting from the variable sea ice conditions.The most passable conditions in ice-covered waters are those covered by seasonal ice.The Laptev Sea and East Siberian Sea, for example, have a wide spread of OASRs, but the shipping corridors in the Barents Sea and Norwegian Sea are much steadier.For OW ships (Figs.2a, 2c,2e, and 2g), the quantities of OASRs in the 2000s and 2010s are more than that estimated in the 1980s and 1990s.The navigation conditions for OW ships in 2012 and 2020 (years of record-low sea ice extent) are much more favorable than those in the years 2007 and 2016 (years of record-low sea ice extent) because their navigation abilities are influenced by the sea ice cover and the summertime sea ice extent in 2012 and 2020 is less than that of 2007 and 2016 [details of NW are shown in Table S1 in the electronic supplementary material (ESM)].For PC6 ships (Figs.2b, 2d, 2f, and 2h),although the quantities of OASRs have increased dramatically in the 2000s and 2010s, the wide spreads of OASRs are still found in the Laptev Sea and East Siberian Sea.Furthermore,when compared to OW ships in the 2010s, the geographical diversity of OASR is more apparent.
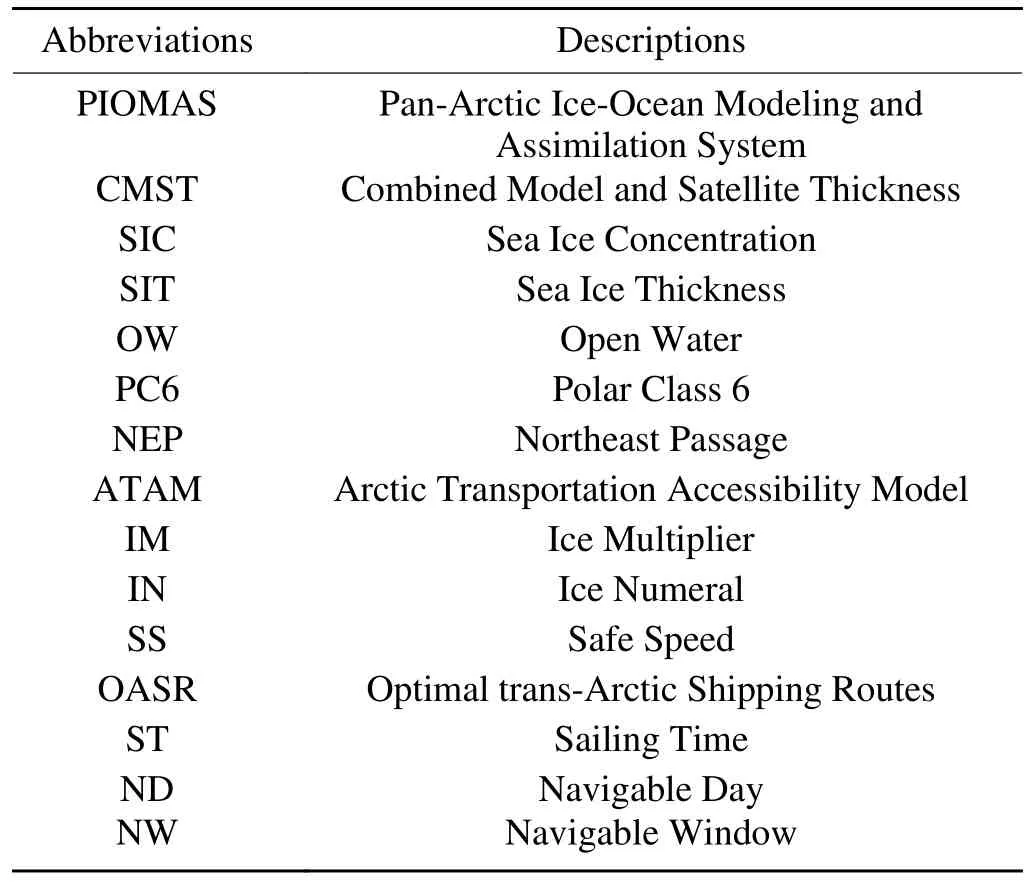
Table 2.Descriptions of the abbreviations used in this Arctic navigability assessment.
With the analysis of the OASR day by day, we then quantified the annual NWs and STs for both OW ships and PC6 ships that sail along the NEP for a long-term duration.The annual NW and its length and ST are presented in Fig.3;more specific start and end dates and lengths of NWs for both types of ships can be found in the supplementary material(Tables S1 and S2 in the ESM).With the rapid Arctic warming and sea ice shrinking, the NWs for both OW ships and PC6 ships were extended back to the 1980s.The extensions of NWs create “pyramid-like distributions” whose navigable durations are short at the top (the 1980s) and prolonged at the bottom (2010s) (Figs.3a and 3b).The continuous navigable days in the NEP have significantly increased in recent years in synchronization with an earlier sea ice melt onset,delaying freeze-up timing and shortening ice seasons (Parkinson, 2014; Bliss and Anderson, 2018; Liang and Su, 2021).Although the durations of NWs are lengthened, the time-consuming navigation with large ST (yellow-green parts in Figs.3a and 3b) still exists at the beginning and the end of NW, especially for PC6 ships.We find that the opening period of trans-Arctic shipping was intermittent before 2005 but this navigation condition has greatly improved since then.Specifically, the average NW for OW ships increased to 89±16 days during the 2010s.The earliest open date and the latest close date of NW shifted to 29 June and 6 November in 2020 (Table S1 in the ESM), respectively.For PC6 ships,the average NW lengthened to 163±19 days during the 2010s.The best navigation condition occurs in 2020 with the longest NW (200 days), earliest open date (9 June) and latest close date (26 December, Table S2).

Fig.2.Optimal trans-Arctic shipping routes in the 1980s, 1990s, 2000s and 2010s.The optimal shipping routes for Open Water (OW) ships are presented in (a), (c), (e), and (g), whereas these routes for Polar Class 6 (PC6) vessels are displayed in (b), (d), (f), and (h).The overlapped amounts of estimated shipping routes are represented by lines of various colors and related numbers.The Rotterdam port (51°55′N, 4°30′E) and the Bering Strait (65°38′36′′N, 169°11′42′′W) are represented by the green triangle and sky-blue square, respectively.The orange star indicates the North Pole.
We then investigated the long-term tendencies of STs for these two types of vessels (Figs.3c and 3d).The preferable seaworthiness emerges in 2005 which is accompanied by the uninterrupted statistics of STs.By contrast, the discontinuous statistics of STs found before 2005 imply that severe sea ice obstacles caused poor navigability earlier.In addition, there is nearly no operational NW for OW ships before 1990.We notice that the mean ST is about 17.1±0.2 days for OW ships and 17.3±0.3 days for PC6 ships during the 2010s.The reason why moderately ice-strengthened (PC6)ships unexpectedly spend more mean navigation time than OW ships can be attributed to the time-consuming navigation at the end of NW (Fig.3b), which results from the onset of sea ice freezing seasons.Additionally, the ST for PC6 ships usually has a larger variation range compared with OW ships.However, the minimum ST for PC6 ships is always less than OW ships because of their greater ice resistance capacity.

Fig.3.The trans-Arctic navigable windows for (a) Open Water (OW) and (b) Polar Class 6 (PC6)ships in the NEP.Annual statistics of sailing time (ST) for OW ships and PC6 ships are represented by (c) blue violins and (d) peach violins, respectively.Note that the fill colors in (a) and (b) indicate the ST cost of the optimal trans-Arctic shipping route on a given day.The day filled by color means it is navigable and the length of the colored horizontal stripe implies the length of the navigation window.The widths of violin plots in (c) and (d) are the distribution density of ST.The maximum,mean and minimum ST are shown with short transverse lines from top to bottom of each violin plot.
To elaborate on the variations of accessible days in local seas (i.e., the Barents, Kara, Laptev, East Siberian and Chukchi Seas), we computed their seasonal changes in different seas along the NEP (Fig.4).Also, the standard deviation of accessible days in each grid cell of the local sea was determined to further clarify the spatial variability of navigability.For both ships, the accessible days of the summer season(July-October) during the 2010s and the 2000s were more than that during the 1990s and the 1980s.The navigability is most optimum in the Barents Sea for its maximum navigable days and minimum standard deviation in all months.The Barents Sea was open for both OW ships and PC6 ships for almost all months during the 2010s.However, optimal navigability in the other seas was only achievable during the summer season.For instance, during the 2010s, the regionally averaged accessible days and related standard deviation in the Laptev Sea are about 23±4 days (July), 28±2 days(August), 29±2 days (September) and 23±4 days (October)for OW ships, and are about 28±2 days (July), 31±0 days(August), 30±0 days (September) and 31±0 days (October)for PC6 ships.In the East Siberian Sea, the accessible days for OW ships are about 14±4 days (July), 27±3 days(August), 28±3 days (September) and 20±5 days (October),for PC6 ships are about 23±4 days (July), 31±0 days(August), 30±0 days (September) and 31±0 days (October).Considerable interannual and interdecadal spreads of accessible days exist in the Kara Sea, Chukchi Sea, Laptev Sea and East Siberian Sea in the summer seasons.In addition, it is also notable that the sizeable interannual and interdecadal spread occurs in the Kara Sea from January to June considering PC6 ships in recent years because of the earlier local sea ice melting.Overall, with the calculations of locally accessible days, the optimum shipping seasons are determined to be from July to October, which can be proved by Arctic shipping assessments based on Automatic Identification System data and CMST (Gunnarsson, 2021; Gunnarsson and Moe,2021; Zhou et al., 2021).

Fig.4.Regionally averaged accessible days for different seas located along the NEP.The left and right panels are for Open Water (OW) and Polar Class 6 (PC6) ships, respectively.With distinct colored lines, the monthly mean accessible days for OW and PC6 vessels in the Barents Sea, Kara Sea, Laptev Sea, East Siberian Sea, and Chukchi Sea over the last four decades are depicted.The shading areas are the standard deviations calculated from each grid cell’s accessible days in the local sea.

Fig.5.The annual difference between locally accessible days and the annual navigable window (NW) for Open Water ships along the Northeast Passage.The difference in a given mesh grid is represented by fill color (units: d).The black lines denote the sea borders and the seas from left to right are the Barents Sea (BAS), Kara Sea (KS), Laptev Sea (LS), East Siberian Sea(ESS) and Chukchi Sea (CS), respectively.The white lines represent the zero contour.Note that only the years that NWs can be determined are calculated here.
Apart from the accessible days in local seas, the annual differences between accessible days and annual trans-Arctic NWs were also calculated to find the pivotal seas with changeable navigation conditions (Figs.5 and 6).It is similar to the“barrel effect” that the rangeabilities of trans-Arctic navigability and duration of the shipping window do not depend on these seas with favorable sea ice conditions but are limited by these seas with obstructive sea ice conditions.Therefore,we are primarily concerned with these seas with the negative difference between locally accessible days and annual NW or small positive difference.Overall, for the OW ships, the sea ice conditions in the Laptev Sea and East Siberian Sea need skillful monitoring and modeling because sea ice in these seas has prominent effects on the opening of NEP and navigation safety.The same pivotal seas are determined for PC6 ships.All the seas with small positive differences also have fewer regional averaged accessible days and large interannual spreads of accessible days (Fig.4).The key seas that influence the opening of NEP identified in this study are similar to those determined for the future Arctic shipping (Min et al., 2022), indicating that more attention is required when navigating in these seas as well as that the resolution of sea ice modeling and forecasting should be improved in these areas now and in the future.Besides, the underway shipping activities should also pay close attention to the sea ice evolutions near the New Siberian Islands and Severnaya Zemlya,especially in Sannikov, Dmitry Laptev, and Vilkitsky straits for possible severe sea ice obstacles.
4.Conclusion and discussion
The historical trans-Arctic navigability has been investigated using ATAM on a climatological time scale, day by day.Considering the combined effects of SIT and SIC, we find the seaworthiness in the Arctic Ocean has become much more optimal in recent years because of the ongoing sea ice decline.More OASRs are estimated in the years of low sea ice cover and they can extend more northward, especially in the Laptev Sea and East Siberian Sea.Moreover,the extensions of NWs are robust for both OW ships and PC6 ships.However, because of their lack of ice resistance,the navigability of the NEP for OW ships is more susceptible to changes in sea ice extent than PC6 ships.In the NEP,with the earlier start date and deferred end date of NW, the NW for OW ships averaged over the 2010s is 89±16 days while the NW for PC6 ships averaged over the 2010s is 163±19 days.The mean STs for OW ships and PC6 ships are roughly 17.1±0.2 days and 17.3±0.3 days, respectively.The statistics of regionally averaged accessible days show improved navigability emerges since the 2000s although considerable interannual and interdecadal spreads still exist in the Kara Sea, Laptev Sea, East Siberian Sea and Chukchi Sea.
With the analysis of locally accessible days (Fig.4) and the difference between locally accessible days and NW(Figs.5 and 6), we find the sea ice evolutions in the Laptev Sea and East Siberian Sea, as well as Severnaya Zemlya, Sannikov Strait and Vilkitsky Strait, have a great impact on the opening of NW and navigation safety.Therefore, future navigation services and sea ice prediction systems should improve the spatial-temporal resolution and accuracy of sea ice monitoring and forecasting in these pivotal areas.Also,it is suggested that shipmasters, navigators and security officials focus specifically on the changeable sea ice evolutions in these areas.
Although the key seas and STs identified in this study agree well with those estimated by Zhou et al.(2021), discrepancies still occur in the spatial distribution of OASRs and the length of NWs when using different sea ice reanalyses.For example, PIOMAS-based navigability assessment may slightly underestimate the NW for PC6 ships compared with these results derived from CMST (2011-2016) (Zhou et al.,2021).The OASRs derived from CMST and PIOMAS also show different spatiotemporal distributions in marginal seas.The mean NW (163±19) for PC6 ships in the 2010s is shorter than the NW (193±13) reported by Cao et al.(2022),which could be attributable to the fact that PIOMAS appears to overestimate thin ice thickness plausibly induced by smooth, low-resolution forcing fields (Zhang and Rothrock, 2003; Schweiger et al., 2011; Wang et al., 2016).Additionally, PIOMAS exaggerates the ice extent in the Barents and Greenland Seas.This overestimation may be due to the slightly lower surface air temperature forcing over these places, or the modeled Norwegian and the West Spitzbergen Currents are insufficient to push the ice edge further north in the Barents and Greenland Seas (Zhang and Rothrock,2003).Our results, however, match those of Zhou et al.(2021) and Cao et al.(2022) when estimating the NW for OW ships, implying that SIT may be more relevant for Arctic navigability than SIC, particularly for PC6.We also noticed that the geographical distributions of the trans-Arctic shipping routes estimated by Cao et al.(2022) are significantly more northern than those found in this and previous studies(Stephenson and Smith, 2015; Melia et al., 2016; Zhou et al.,2021).One possible reason for the diversity could be that Cao et al.(2022) estimated the “shortest successful trans-Arctic routes”, whereas other research estimated the “optimal trans-Arctic shipping routes (i.e., the most time-saving shipping routes)”.As a result, disparities between these two types of shipping routes are inevitable because the shortest shipping routes do not necessarily imply the most time-saving routes, as the former potentially cost more shipping time due to the possibility of sea ice obstruction.Because accurate SIT modeling and forecasting are still a challenge for models(Uotila et al., 2019; Watts et al., 2021; Xiu et al., 2021,2022), these differences also plausibly emerge from the diverse sea ice simulations, particularly from SIT.Therefore,although a widely used Arctic sea ice reanalysis (PIOMAS)has been developed, it is still an urgent demand to further improve the simulating and forecasting abilities of the Arctic sea ice.
Furthermore, the oceanic conditions (e.g., ocean wave and ocean depth), weather elements (e.g., wind and fog), as well as geopolitics also need to be considered in shipping operations.As indicated by previous studies (Liu and Kronbak, 2010; Lasserre and Pelletier, 2011; Cao et al., 2022;Min et al., 2022), the expenses of icebreaking services, infrastructure provision, and insurance premiums will all have an impact on operational shipping activities.As a result, all of the estimates in this study (e.g., OASR, ST, ND, and NW)should be treated as theoretical estimates that do not account for environmental or other costs.
Although the opening of the Arctic shipping corridors could result in significant economic gains, there are two sides to every coin, and Arctic marine transportation is no exception.Routine vessel traffic will induce some environmental concerns.For instance, Arctic marine mammals, especially narwhals, are vulnerable to trans-Arctic vessel traffic(Hauser et al., 2018).Second, biological invasions in coastal ecosystems could be triggered by increased Arctic shipping (Miller and Ruiz, 2014).Third, ever-growing Arctic shipping will emit more greenhouse and non-greenhouse gases and place an excessive burden on the fragile Arctic environment (Lindstad and Eskeland, 2016; Yumashev et al.,2017); additionally, these emissions could plausibly affect the regional climate feedback mechanisms (Stephenson et al., 2018; Li et al., 2021b).Therefore, environmental protection is also an important issue.
Data availability statement.PIOMAS sea ice data used in this study can be found at http://psc.apl.uw.edu/research/projects/arctic-sea-ice-volume-anomaly/data/model_grid.
Acknowledgements.This is a contribution to the Year of Polar Prediction (YOPP), a flagship activity of the Polar Prediction Project (PPP), initiated by the World Weather Research Programme(WWRP) of the World Meteorological Organization (WMO).Thanks are given to the University of Washington for providing the PIOMAS sea ice data.We thank the insightful suggestions from two anonymous reviewers and the editor.We also acknowledge the computing resources on the supercomputer Ollie provided by Alfred Wegener Institute (AWI) Helmholtz Centre for Polar and Marine Research and computing resources provided by National Supercomputer Center in Guangzhou.This study was funded by the National Natural Science Foundation of China (No.41922044,41941009), the Guangdong Basic and Applied Basic Research Foundation (No.2020B1515020025), and the fundamental research funds for the Norges Forskningsråd (No.328886).C Min acknowledges support from the China Scholarship Council (No.202006380131).
Author contributions.Q.H.YANG and H.LUO conceived this study.C MIN conducted this study, performed analysis and wrote the manuscript.X.Y.ZHOU and Y.J.YANG helped process and visualize the essential data.H.LUO, Y.J.WANG, J.L.ZHANG and Q.H.YANG, contributed to the interpretation of the results and reviewed this paper.All authors contributed to the critical discussion of the content.
Conflict of interests.The authors declare that they have no conflict of interest.
Electronic supplementary material:Supplementary material is available in the online version of this article at https://doi.org/10.1007/s00376-022-2040-3.
杂志排行

Advances in Atmospheric Sciences的其它文章
- Simulations and Projections of Winter Sea Ice in the Barents Sea by CMIP6 Climate Models※
- The Influence of Meridional Variation in North Pacific Sea Surface Temperature Anomalies on the Arctic Stratospheric Polar Vortex※
- A Parameterization Scheme for Wind Wave Modules that Includes the Sea Ice Thickness in the Marginal Ice Zone※
- Influence of Surface Types on the Seasonality and Inter-Model Spread of Arctic Amplification in CMIP6※
- Evaluation of the Arctic Sea-Ice Simulation on SODA3 Datasets※
- Separation of Atmospheric Circulation Patterns Governing Regional Variability of Arctic Sea Ice in Summer※