Modulation of the Wind Field Structure of Initial Vortex on the Relationship between Tropical Cyclone Size and Intensity
2023-09-07KexinCHENGuanghuaCHENandDongleiSHI
Kexin CHEN, Guanghua CHEN, and Donglei SHI
1Key Laboratory of Cloud-Precipitation Physics and Severe Storms, Institute of Atmospheric Physics,Chinese Academy of Sciences, Beijing 100029, China
2Shanghai Typhoon Institute, China Meteorological Administration, Shanghai 200030, China
3University of Chinese Academy of Sciences, Beijing 100049, China
4Department of Atmospheric Science, School of Environmental Studies,China University of Geosciences, Wuhan 430074, China
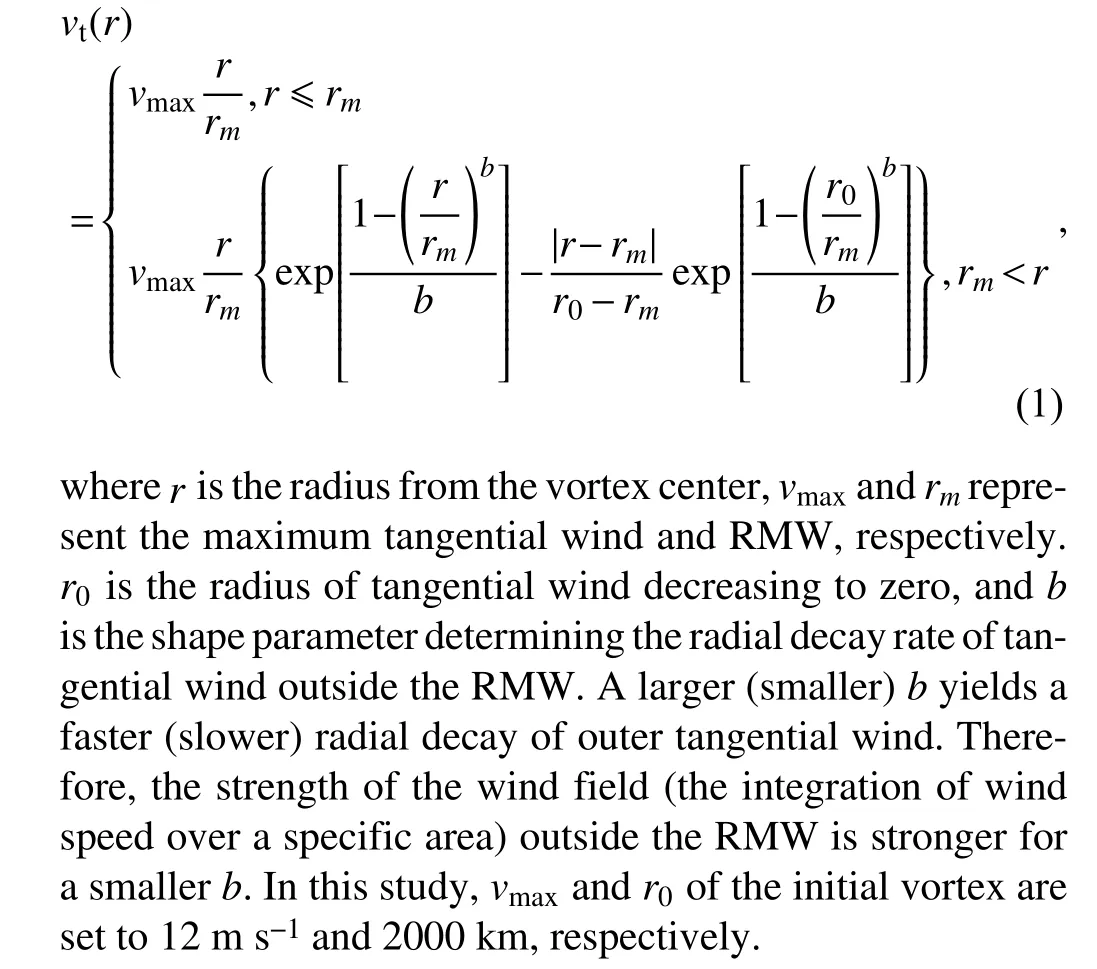
ABSTRACT This study investigates the modulation of initial wind field structure on the relationship between the size and intensity of a simulated vortex.A series of idealized experiments are conducted by varying the radius of maximum wind (RMW) and shape parameter b of the initial vortices.The size—intensity relationship is quantified by the linear regression coefficient of the azimuthally-averaged gale-force wind radius against the maximum wind during the development stage, reflecting the degree of size expansion at the same intensity increment.The regression coefficient increases with increased RMW and decreased b, with the RMW being the primary constraint.The effect of lowering b on the elevation of the regression coefficient gradually stands out when the initial RMW is large.Enlarging the RMW leads to a secondary circulation with a horizontally elongated structure, which retards the intensification while promoting size expansion, thus substantially enhancing size expansion as the vortex intensifies.Broadening the wind field outside the RMW by reducing b results in abounding convection in the outer region, which promotes size expansion.Based on the axisymmetric tangential wind tendency and Sawyer—Eliassen equations, when the RMW is large, the active convection in the outer region can weaken the radial inflow induced by the eyewall heating in the inner region, thus retarding the intensification by reducing the radial imports of vorticity near the RMW.
Key words: tropical cyclone, size and intensity, initial wind field structure, tangential wind tendency equation Sawyer-Eliassen equation
1.Introduction
Observational studies of tropical cyclones (TCs), from the large-sample perspective that mixes up all TCs’records,have shown a generally weak correlation between intensity and size (Merrill, 1984; Weatherford and Gray, 1988;Chavas and Emanuel, 2010; Chan and Chan, 2012; Musgrave et al., 2012; Knaff et al., 2014; Wu et al., 2015; Chavas et al., 2016; Guo and Tan, 2017; Song et al., 2020; Sun et al.,2022).However, the large-sample framework has inherent limitations, which are neglected in previous literature.On one hand, the overall weak correlation obscures the intrinsic size—intensity correlation of a single TC.For example, size is observed in reality as well as in numerical simulation to correlate well with intensity during the early development stage in terms of individual TCs (Xu and Wang, 2010; Chan and Chan, 2014; Chavas et al., 2016; Schenkel et al., 2018;Chen et al., 2019; Martinez et al., 2020; Song et al., 2020).On the other hand, the large-sample framework fails to identify individual differences among TCs, thus neglecting the fundamental cause of the overall weak correlation.Recently,we pointed out that although size is correlated well with intensity during the early development stage of individual TCs,the size change at the same intensity increment is largely discrepant among TCs, therefore leading to a weak correlation if mixing up all records (Chen et al., 2022).
To provide a comprehensive picture of TC size—intensity relevance, besides the overall correlation, the variation of size—intensity relationship from storm to storm, i.e., the degree of size expansion relative to the same intensity increment, should be investigated.A variety of factors in the environment and internal processes can affect the evolution of TC intensity and size.The environmental factors include latitude (Chan and Chan, 2014; Smith et al., 2015), deep-layer vertical wind shear (Frank and Ritchie, 2001; Wang and Toumi, 2019), underlying ocean temperature (Xu and Wang,2018a; Chen et al., 2021), and synoptic systems at higher or lower levels (Hanley et al., 2001; Liu and Chan, 2002).The internal dynamics consist of the potential vorticity mixing between eye and eyewall (Tsujino and Kuo, 2020; Shi and Chen, 2021), eyewall replacement cycle (Zhou and Wang,2011; Huang et al., 2012), spiral rainband activity (Wang,2009), and frictionally induced convergence and dissipation within the boundary layer (Li and Wang, 2021a).By conducting idealized numerical experiments, Wang and Lin (2020)found that a dry TC tends to be of a larger size than a moist one and further pointed out that the hydrometeors’falling within a TC circulation could limit the size and structure of TCs in nature.Additionally, based on the balanced vortex dynamics (e.g., Shapiro and Willoughby, 1982), the wind field structure is an important internal factor, since it determines how a TC responds to a given environmental or internal forcing.
Numerous analyses have shown that the evolution of intensity and size depends on TC wind field structure.The radius of maximum wind (RMW) and the radial decay rate of tangential wind outside the RMW are crucial structural metrics.The RMW reflects the inner-core extent of a TC, and the radial decay of tangential wind determines the outer size of the wind field.The subsequent intensification rate of a TC possessing a smaller RMW or outer size (measured by the gale-force wind radius, R34) is usually higher, such that a TC is more likely to experience rapid intensification(Chen et al., 2011; Carrasco et al., 2014; Xu and Wang,2015, 2018a).In addition, TC intensity significantly correlates with the structure fullness measured by the ratio of the width of the outer annular wind ring (R34-RMW) to the R34 (Guo and Tan, 2017; Chen and Li, 2021).Guo and Tan(2022) further uncovered the existence of a preferable fullness for a specific intensity that raises the great intensification rate in nature.In terms of the impacts of the initial wind field on the size evolution, the initially large TC generally maintains its size superiority over the smaller counterpart throughout its lifetime (Lee et al., 2010), as it possesses higher absolute angular momentum import in the outer region (Chan and Chan, 2014).The higher momentum import arises mainly from a larger amount and larger-scale convection in the broader wind field (Martinez et al., 2020).
The fundamental pathway leading to the spin-up of tangential wind in the inner and outer regions is driven by the convectively induced inflow at lower levels to advect angular momentum inwards (Schubert and Hack, 1982; Shapiro and Willoughby, 1982).Smith et al.(2009) pointed out that TC intensification is associated with the contraction of the absolute angular momentum surface within the boundary layer near the RMW, while the size expansion is related to the momentum convergence above the boundary layer in the outer region.Observations and numerical experiments show that the kinematic feature of TC boundary radial inflow varies with the wind field structure.Specifically, the TC with a narrow outer size or a small RMW is more likely to possess a deeper inflow layer with stronger updrafts close to the RMW (Kilroy and Smith, 2017; Zhang et al., 2023).
The above review demonstrates that more attention has been paid to the influence of wind field structure on intensity and size.However, a quantitative analysis on the impact of vortex initial structure on the size—intensity relationship, i.e.,the degree of size expansion relative to the same intensity increment, is still lacking.Specifically, the modulation of the two structural parameters (RMW and decay rate of tangential wind outside the RMW) and their relative importance on the size—intensity relationship remains unknown, especially during early development.Following our previous work (Chen et al., 2022), the size—intensity relationship is quantified by the linear regression coefficient of size against intensity given that the size generally correlates well with the intensity during early development.This study aims to investigate how the initial wind field structure modulates the size—intensity relationship during early development and further evaluate the relative importance of initial RMW and radial decay rate of tangential wind outside the RMW.
The remainder of this paper is organized as follows.Section 2 describes the numerical model settings and experimental design.Section 3 explains how the initial wind field structure modulates the size—intensity relationship.The thermodynamical process underlying the modulation of the RMW and radial decay of wind outside the RMW on the size—intensity relationship is investigated in section 4.Conclusions and discussions are given in section 5.
2.Model configurations and experimental design
2.1.Model configurations
Idealized simulations are carried out with the Advanced Research Weather Research and Forecasting Model Version 3.6.1.The model domain is triple nested with grid dimensions of 301×301, 211×211, and 301×301, spacing by 27 km,9 km, and 3 km, respectively.Except for the outermost domain, two inner meshes are set to automatically follow the vortex.There are 35 levels in the vertical direction with the model top at 50 hPa.Experiments are initialized on anfplane at 20°N with a uniform SST of 28°C.
For all experiments, the physics parameterizations used are as follows.The Thompson scheme (Thompson et al.,2008) and Yonsei University (YSU) scheme (Hong et al.,2004) are chosen for model microphysics and boundary layer physics, respectively.The Kain—Fritsch cumulus parameterization scheme (Fritsch and Kain, 1993) is used only for the outermost domain.The Rapid Radiative Transfer Model(RRTM) longwave radiation scheme (Mlawer et al., 1997)and shortwave radiation scheme (Dudhia, 1989) are used.Note that the radiation is fixed at noon in all experiments to remove the influence of diurnal solar forcing.
The tangential wind (vt) profile of the axisymmetric initial vortex following Xu and Wang (2018b) is given by:
2.2.Experimental design
A series of experiments are conducted by varying the RMW and the shape parameterbto investigate how the initial wind field structure affects the size—intensity relationship of a vortex, that is, the degree of size expansion relative to the same intensity increment.Three settings of RMW of 80 km,120 km, and 160 km, andbof 0.75, 0.50, and 0.35, yield nine experimental combinations.Specifically, the initial vortex in experiment R80b75 possesses the smallest RMW of 80 km and the fastest decay of tangential wind outside the RMW with abof 0.75, while experiment R160b35 has the largest RMW of 160 km and the slowest wind decay outside the RMW with abof 0.35.To further validate the conclusions, experiments with the RMW reduced to 40 km are also carried out.The modulation of the initial wind field on the size—intensity relationship is qualitatively consistent with other experiments, and the experimental results with the RMW of 40 km are not shown for brevity.Figure 1 shows the radial wind profiles and corresponding inertial stability of the initial vortex in the experiment groups R80 and R160.All experiments were integrated over five days, long enough for a simulated vortex to complete early development.
3.Experiment results
3.1.Evolution of the vortex
Figure 2 presents the evolutions of intensity and size, as well as the RMW of the simulated vortex in all experiments.Here, the intensity is defined as the maximum azimuthally averaged tangential wind speed (Vmax), and the size is measured by the azimuthally averaged R34; both are obtained at 10-m height.The hourly intensity change over a 6-hour period is converted to an equivalent value over 24 hours to determine the development stage.The development stage begins at the time when the intensification rate first exceeds 15 m s—1d—1and terminates at the first time when the intensification rate is less than 5 m s—1d—1for six consecutive hours,which is similar to Xu and Wang (2018b) and Martinez et al.(2020).The beginning and end times of the development stage in each simulation are marked by the red and black dots, respectively, shown in Fig.2.
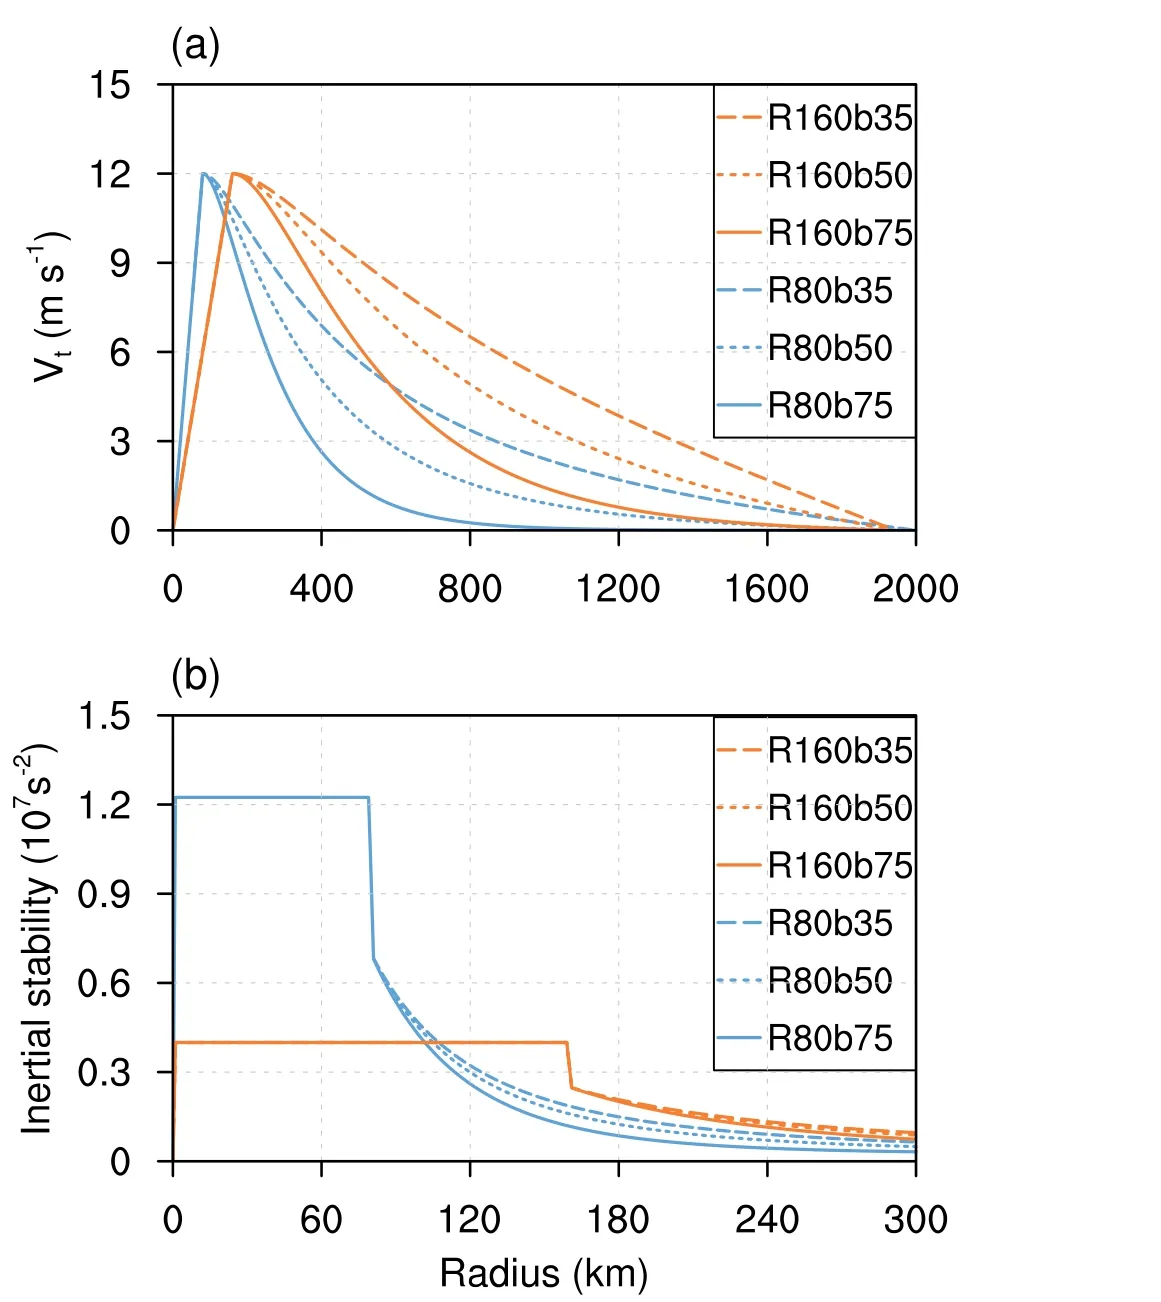
Fig.1.Radial profiles of (a) tangential wind and (b) inertial stability of the incipient vortex.For clarity, those only in the experiment groups R80 and R160 are displayed.
Smaller RMW vortices have a shorter spin-up period followed by a faster intensification (Fig.2a), which is consistent with previous research (Kilroy and Smith, 2017; Xu and Wang, 2018b; Li and Wang, 2021a).Note that the smaller RMW contracts to smaller radii faster than the large RMW(Fig.2c); compared to the larger RMW vortices, the structure of the smaller RMW vortex changes into the preferable configuration for subsequent intensification faster.Explicitly,the fullness ratio of the vortex [measured by the ratio of TC fullness (T CF=1-RMW/R34) to the critical fullness(TCF0=1-17.0/Vmax)] reaches 1.4 (not shown, Guo and Tan, 2022).The RMW also serves as the primary constraint on size expansion.Although R34 appears later as RMW increases due to slow intensification, the size expansion rate increased with RMW, which is consistent with previous research (Kilroy and Smith, 2017).
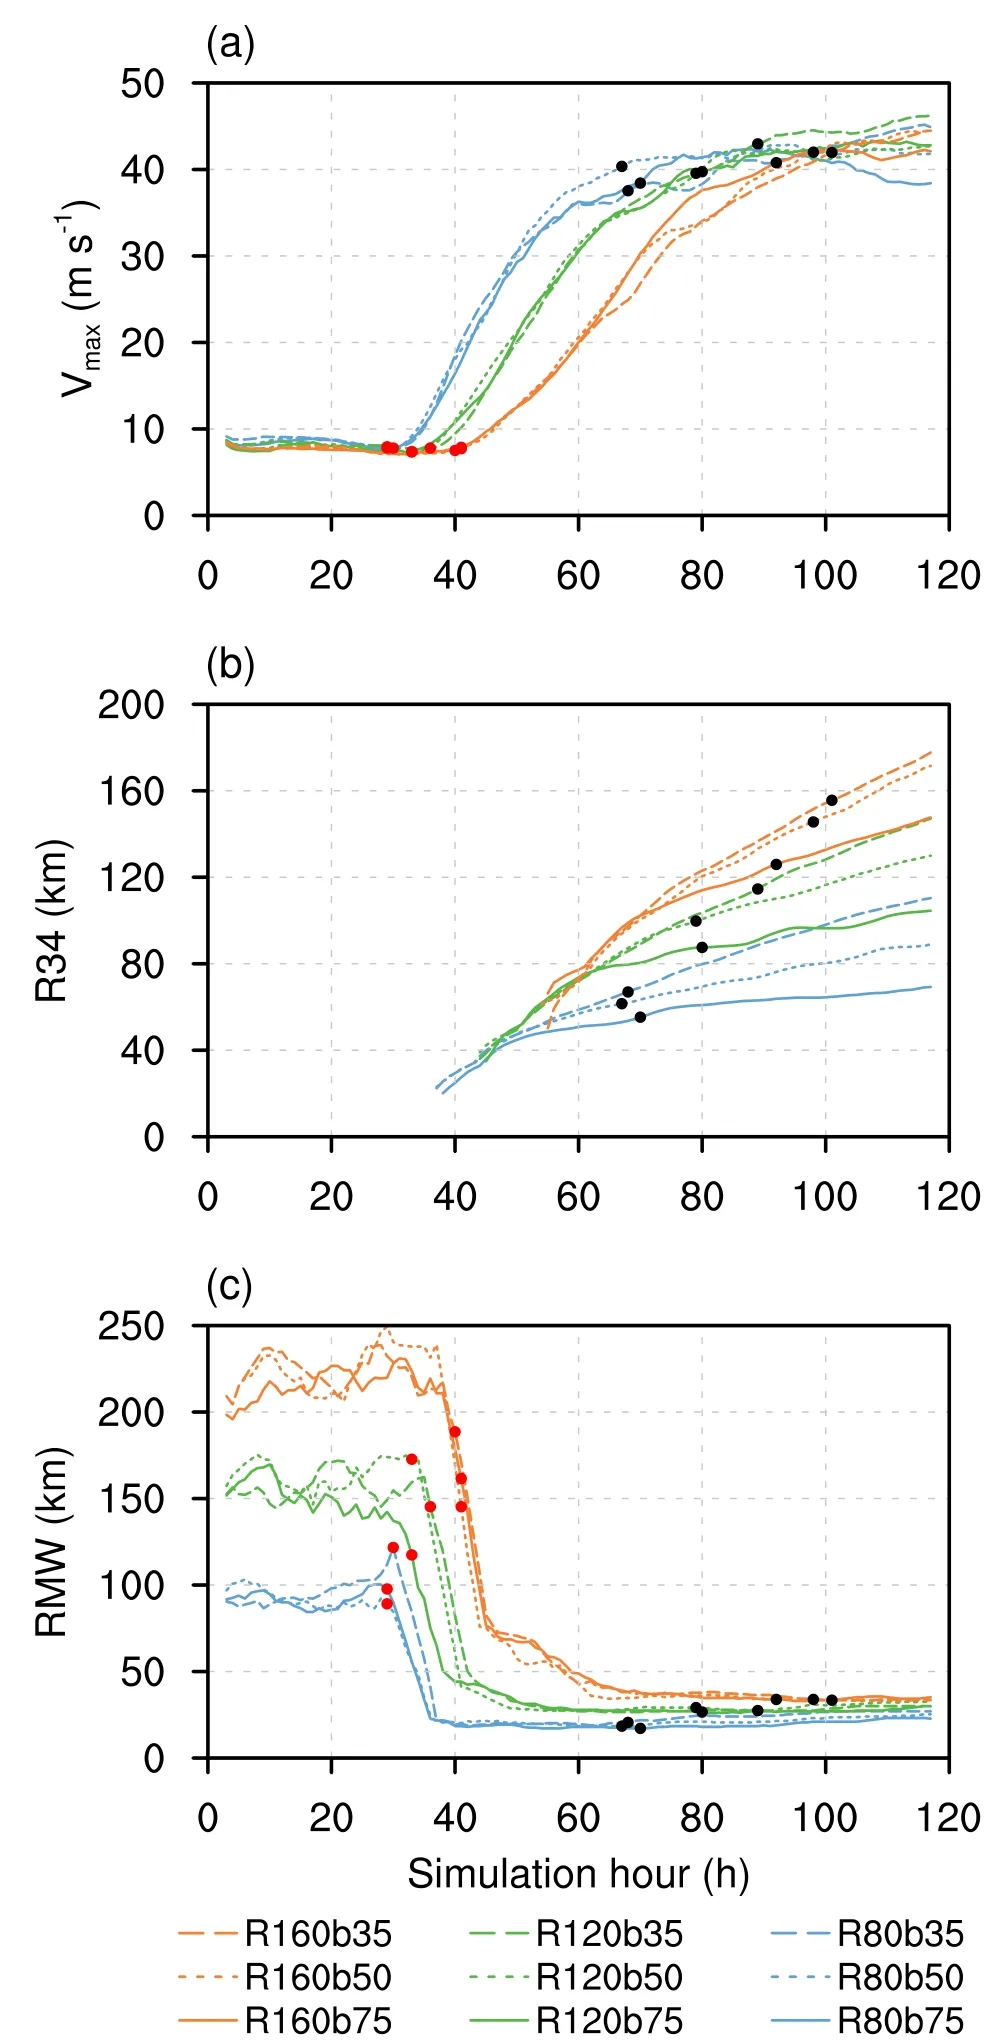
Fig.2.Temporal evolutions of (a) the maximum azimuthally averagedtangentialwindspeed(Vmax,ms—1),(b)the azimuthallyaveragedgale-forcewindradius (R34,km),and(c) the radius of maximum wind (RMW, km) for all experiments.The red and black dots denote the beginning and end times of the development stage of each experiment.
The modulation of the shape parameterbon intensification is less pronounced as compared to the RMW and is furthermore dependent on it.Specifically, when the initial RMW is small (i.e., 80 km and 120 km), modifying thebbarely influences the intensification.However, when the initial RMW is large (i.e., 160 km), broadening the wind field in the outer region by decreasing thebslows down the intensification, especially during the second half of the development stage.The bifurcation point of intensity evolution in the R160 group in Fig.2a is approximately the time the discrepancy in size expansion occurs in Fig.2b.It is conceivable that when the inner inertial stability weakens with increasing RMW, the radial vorticity may be blocked from moving inward by the outer convection thus slowing intensification,which will be quantitively examined in section 4.Consistent with previous studies (Chan and Chan, 2014; Martinez et al.,2020), given the same RMW, the size expansion increases with the broadening outer wind field specified by decreasingb.
3.2.Relationship between intensity and size
In idealized simulations without external forcing, there is a positive linear correlation between size and intensity during the development stage with a correlation coefficient close to 1 for each vortex, as shown in Table 1.The linear regression coefficient of R34 againstVmax, which shows the degree of size expansion relative to the same intensity increment, can be another key metric to quantify the size—intensity relationship.The higher the regression coefficient is, the more pronounced the size expansion relative to the same intensity increment.Figure 3 displays the regression results for all experiments with the regression coefficients shown in Table 1.The varying size—intensity relationship among the vortices results in a wide range of size for a given inten-sity, which can account for the weakening of the overall size—intensity correlation if mixing up all experiment records.In particular, the correlation coefficient for all the experiment data in Fig.3 drops to 0.57 (Table 1), indicating that the large-sample framework can obscure the intrinsic size—intensity correlation in individual vortices.
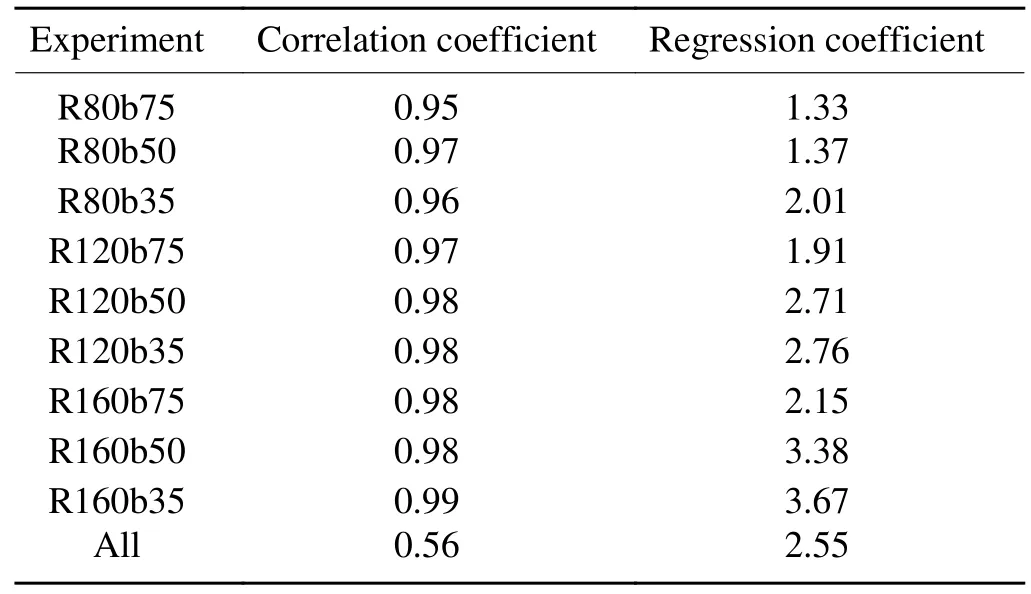
Table 1.Linear correlation and regression coefficients between size and intensity in each experiment and all experiment data during the development stage.
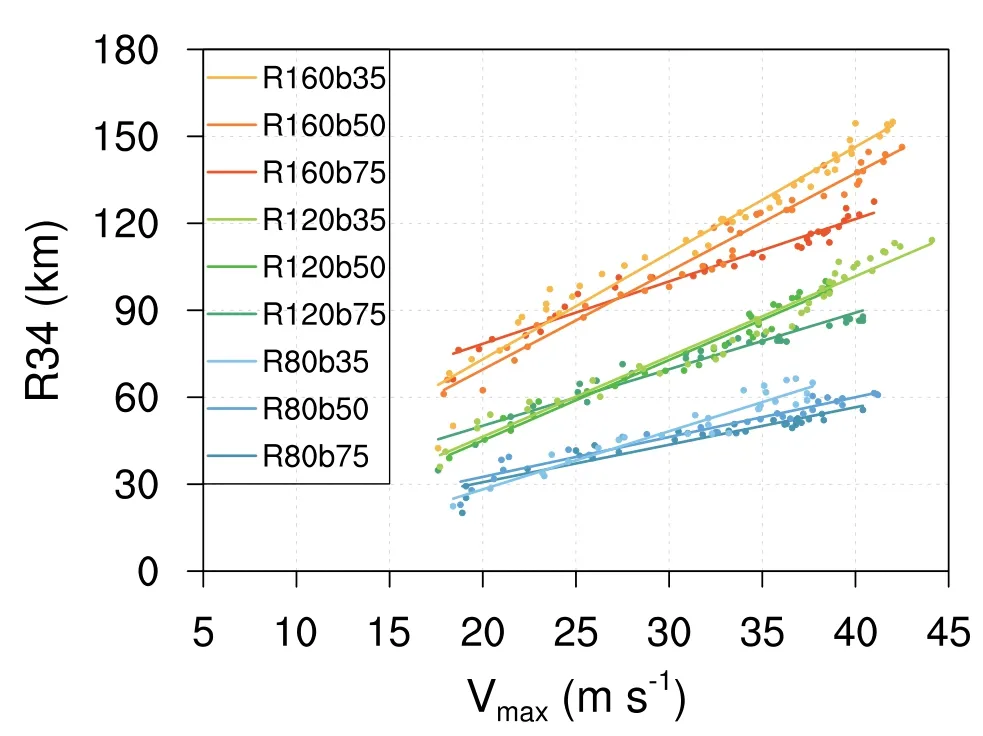
Fig.3.Linear regressions of size (R34) against intensity (V max)during the development stage of all experiments.Specific linear correlation and regression coefficients between size and intensity for each experiment are given in Table 1.
Different slopes of the regression lines demonstrate that the initial wind field structure can modulate the size—intensity relationship.Overall, either increasing the RMW or decreasing the shape parameterbelevates the regression coefficient(Table 1).In comparison, increasing the initial RMW elevates the regression coefficient more evidently than reducingb.The more pronounced effect of enlarging the RMW is due to its slowing intensification while accelerating expansion(Fig.2).The elevation by reducingbis of small magnitude and depends on the RMW.The larger the RMW is, the steeper the regression lines can become with decreasingb,which is associated with the more noticeable inhibition to intensification as RMW increases.In short, the initial RMW plays the leading role in modulating the evolution of intensity and size, and it is thus the primary factor regulating the size—intensity relationship.Therefore, compared to the wind structure in the outer region, the early RMW may warrant more attention when forecasting R34 changes.
4.Quantitative evaluation of the sizeintensity relationship
4.1.Tangential wind budget analysis
Based on the above discussions, two questions are naturally raised: How does the initial RMW and shape parameterbaffect the evolution of intensity and size, and thus the size—intensity relationship? What is the quantitative contribution of RMW andbto the modulation of the size—intensity relationship? The evolution of intensity and size can be investigated by the tangential wind tendency equation.From an axisymmetric perspective, the tangential wind tendency equation can be written as
wherevtandvrare the azimuthal-mean tangential and radial wind, respectively, η=ζ+f0is the azimuthal-mean absolute vertical vorticity,ζis the azimuthal-mean relative vertical vorticity,f0is the Coriolis parameter at the vortex center, andFis the surface friction from the model output.The three terms on the right-hand side of Eq.(2) are the radial advection of the azimuthal-mean absolute vertical vorticity, vertical advection of the azimuthal-mean tangential wind, and the surface friction, respectively.Note that contributions by eddy terms are quite small and negligible and thus were not included in Eq.(1).The modulation of the initial wind field structure on the size—intensity relationship can be understood and evaluated by comparing the three terms among different experiments.The typical experiments R80b75, R80b35, R160b75, and R160b35 are selected for further comparison.Moreover, the investigation focuses on the primary development stage of the vortex intensifying from 15 m s—1to 35 m s—1for a fair comparison.
Figure 4 shows the radial profile ofvtaveraged vertically from 0 km to 1 km for every 5-m s—1increment in intensity to present how the size—intensity relationship results in wind profile changes.In the R80 group,vtamplifies mainly near the RMW, while outside the RMW amplification is not evident; thus, the slope ofvtoutside the RMW is steep with time (Figs.4a, b).The averaged tangential wind at lower levels of 17.5 m s—1(34 kt) expands from 40 km to 80 km as the vortices gradually intensify.In comparison, the expansion of the wind profile outside the RMW is more pronounced in the R160 group.Moreover, decreasing thebfrom R160b75 to R160b35 is more conducive to size expansion compared to going from R80b75 to R80b35 (Figs.4c, d).In the R160 group, the radius range of 120 km to 180 km is the main extension rage of the lower wind of 17.5 m s—1.For brevity,the radial ranges from 40 km to 80 km and 120 km to 180 km will henceforth be referred to as the outer region.
The temporally averagedvtbudgets vertically from 0 km to 3 km based on the model outputs with 10-min time intervals are shown in Fig.5.Consistent with previous studies(i.e., Xu and Wang, 2018b), the radial advection of absolute vertical vorticity imposes the primary positive contribution below 1 km in height (second column in Fig.5) while the friction is the opposite (fourth column in Fig.5), both with the maximum residing near the RMW in all experiments.The vertical advection of the azimuthal-mean tangential wind mainly spins down thevtaround the RMW below 1 km in height (third column in Fig.5).
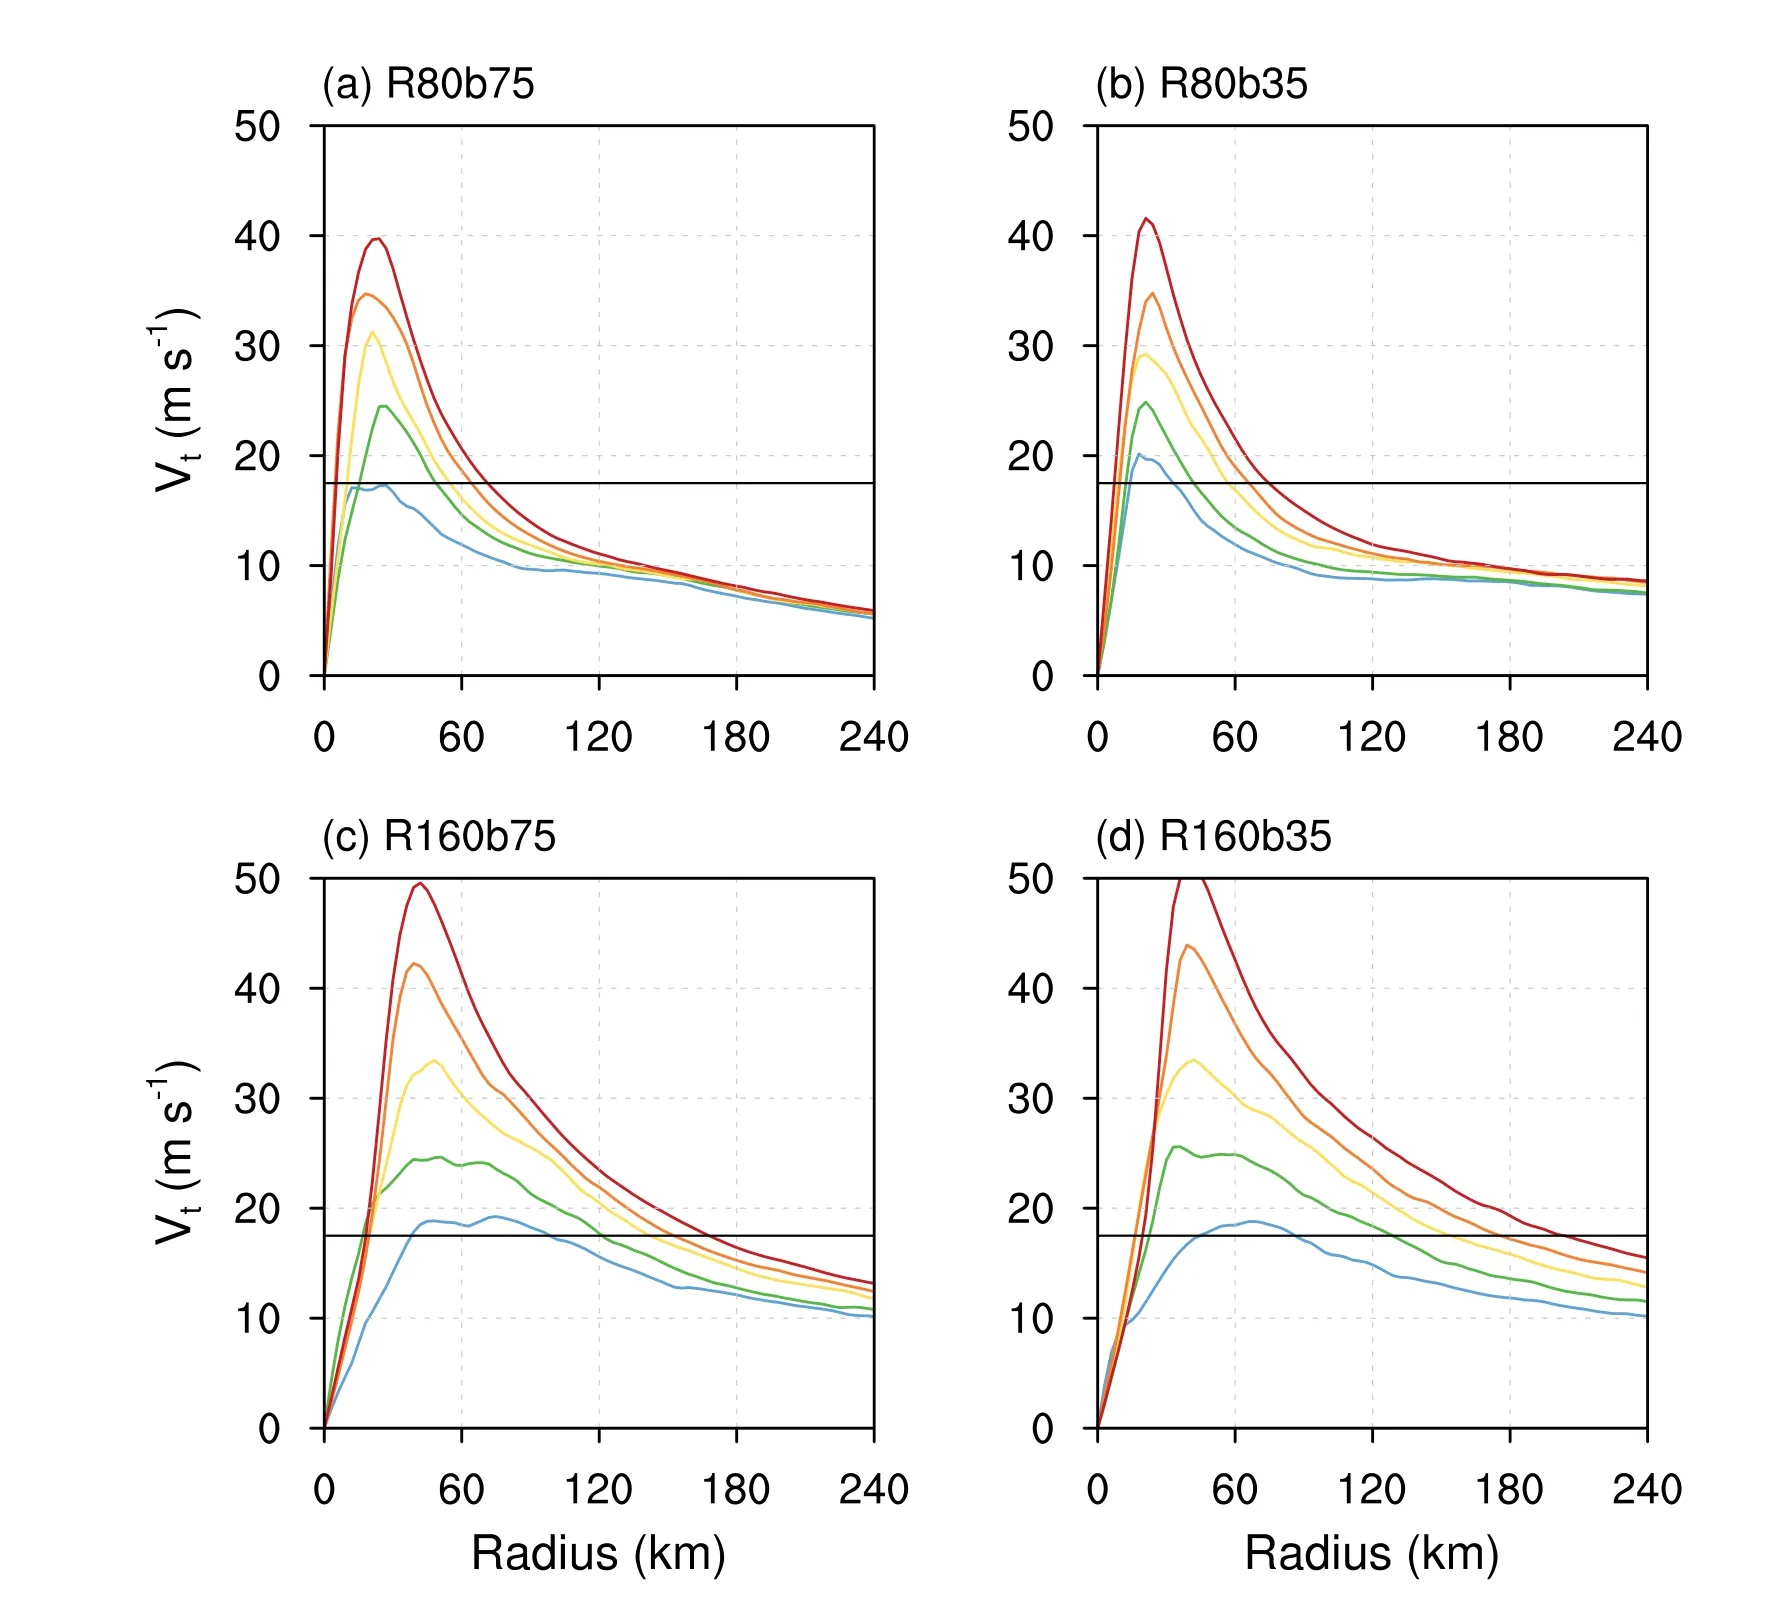
Fig.4.The radial profile of azimuthal-mean tangential wind averaged vertically from 0 km to 1 km for every 5-m s—1 increment in intensity when the simulated vortex intensifies from 15 m s—1 to 35 m s—1 in (a) R80b75, (b) R80b35, (c) R160b75, and (d) R160b35.The blue, green, yellow, orange, and red lines denote the intensity of the vortex of 15 m s—1, 20 m s—1, 25 m s—1, 30 m s—1, and 35 m s—1,respectively.The horizontal black line in each panel indicates the 17.5-m s—1 (34-kt) wind speed.
Compared to the R160 group, the radial vorticity advection near the RMW is higher in the R80 group (Figs.5b and 5f), which results in a greater positivevttendency in the inner region (Figs.5a and 5e) and a corresponding higher intensification rate.When the RMW is small, reducing thebincreases the positivevttendency slightly in the radial range of 40 km to 80 km going from R80b75 to R80b35, justifying the relatively higher expansion rate of the latter.In contrast,the positivevttendency of R160b35 radially within 60 km and vertically below 1 km noticeably weakened compared to R160b75 (Figs.6i and 6m), matching its slower intensification during the second half of the development stage.Note that the maximum of the positivevttendency and radial vorticity advection of R160b35 are relatively higher than those of R160b75, which is associated with the evaporation-cooling effects of convection outside the eyewall and will be illustrated in more detail later.Akin to the R80 group, contributed by the higher radial advection of vorticity in the outer region (Figs.6j and 6n), reducing thebfrom R160b75 to R160b35 increases the positivevttendency outside 120 km.
The radial advection of absolute vertical vorticity dominates thevtchanges at lower levels.To examine the key process leading to the varying size—intensity relationship between different experiments, Fig.6 plots the time evolution of the radial vorticity advection, as well as the radial inflow averaged vertically from 0 km to 1 km during the period when the vortex intensifies from 15 m s—1to 35 m s—1in each experiment.As expected, the radial advection of vorticity evolves as a function of the radial inflow.The largest radial vorticity advection resides along the RMW, where the radial gradient of the inflow is the strongest.The radial gradient of the inflow is greater near the RMW with a much narrower extension in the R80 group than in the R160 group,which demonstrates the horizontally restricted secondary circulation driven by the eyewall heating with higher inertial stability of the former (Fig.1b) (Schubert and Hack, 1982;Tsuji et al., 2016).After the 47th and 67th hour, the radial inflow of R80b35 and R160b35 weakens in the inner region and extends to larger radii compared to R80b75 and R160b75, respectively.Moreover, the weakening is more noticeable in R160b35.
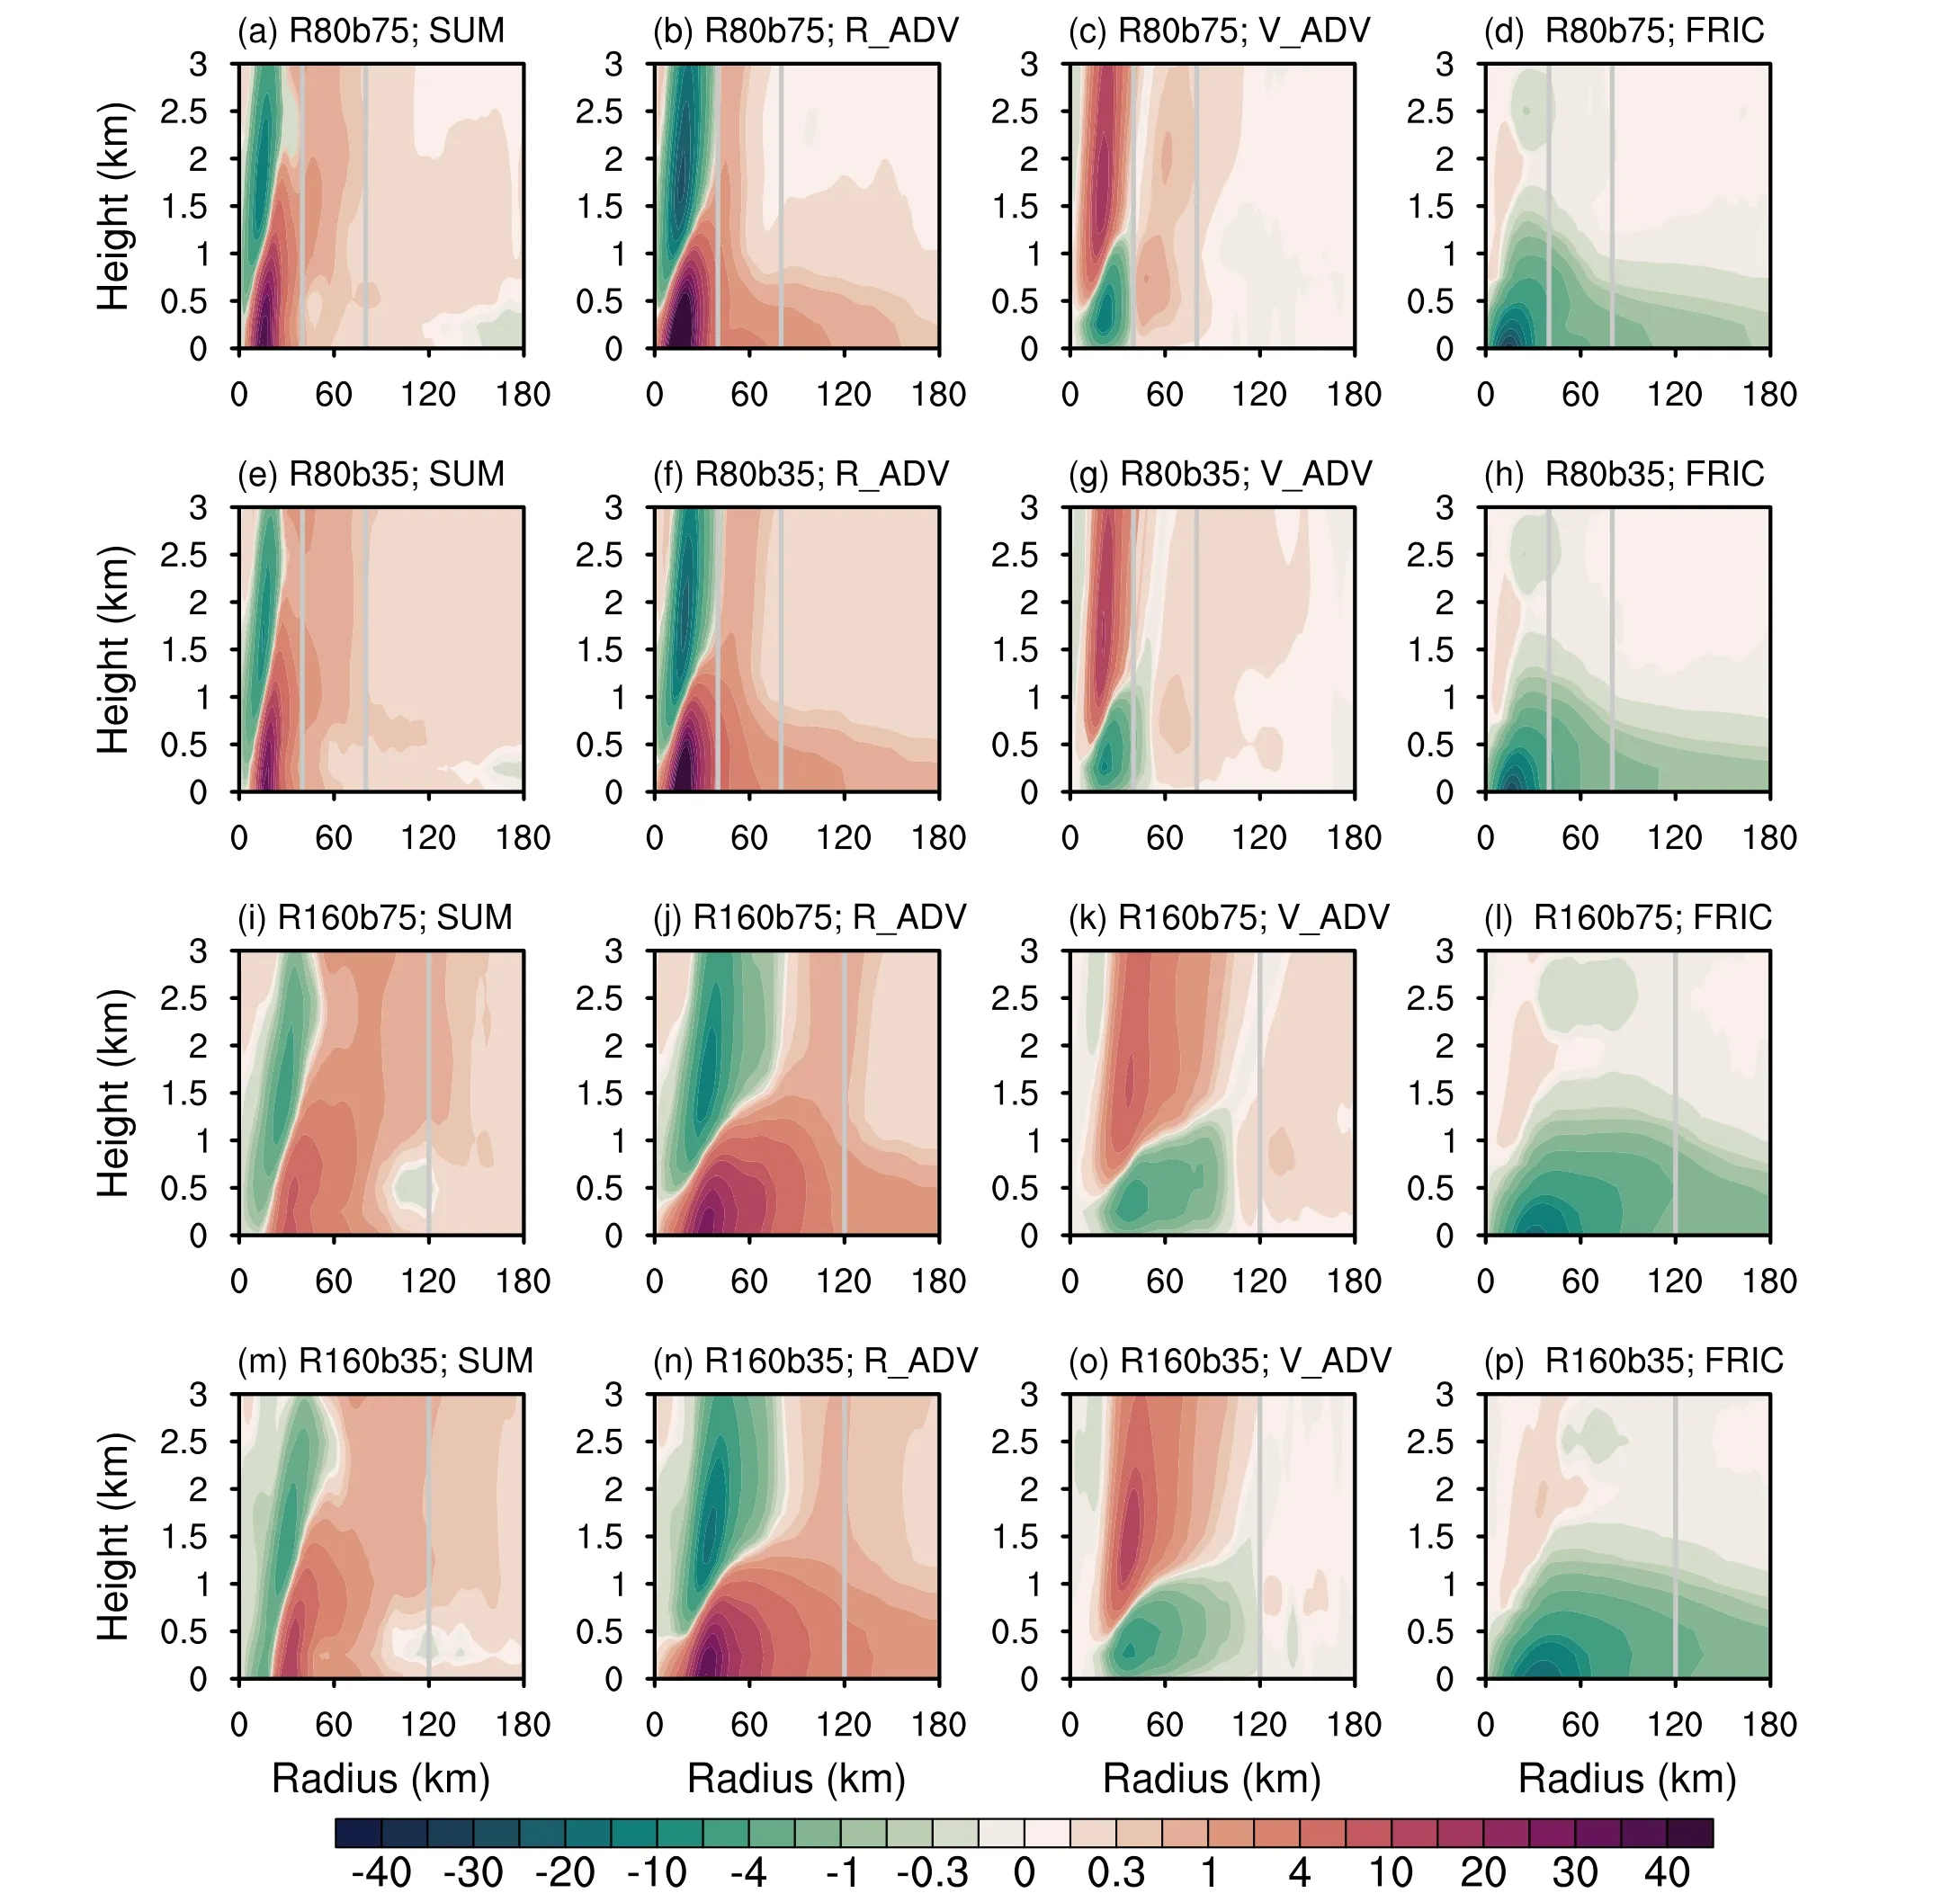
Fig.5.Radius—height cross sections of the tangential wind tendency budget.The sum of all terms contributing to the tangential wind tendency (first column), radial advection of azimuthal-mean absolute vertical vorticity (second column),vertical advection of azimuthal-mean tangential wind (third column), and the friction term (fourth column) are averaged during the period when the vortex intensifies from 15 m s—1 to 35 m s—1 in R80b75 (first row), R80b35 (second row),R160b75 (third row), and R160b35 (fourth row).The grey line denotes the radius of 40/80 km in the R80 group and 120 km in the R160 group, respectively.
Changes in radial inflow are closely associated with convection.Figure 7 compares the snapshots of convection represented by the simulated radar reflectivity after the 47th and 67th hour of the R80 and R160 groups.Similar to previous studies (Kilroy and Smith, 2017; Martinez et al.,2020), the convection gradually propagates towards the vortex center with a narrow wind field outside the RMW in R80b75 and R160b75, while the outer convection is more active outside the radius of 40 km and 120 km in R80b35 and R160b35, respectively.Previous studies (Kilroy and Smith, 2017; Zhang et al., 2023) have claimed that the broad wind field outside the RMW tends to generate upflow above the boundary layer to burst deep convection in the outer region.Additionally, the corresponding relatively higher inertial stability in the outer region can resist the radial inflow induced by eyewall heating such that the outer convection less easily gathers in the eyewall.The positive feedback between deep convection and radial inflow in the outer region favors the size expansion, while this process could restrict intensification by blocking mass and moisture supply toward the inner region (Powell, 1990; Wang, 2009).This justifies the weakening of radial inflow in the inner region when the radial extension broadens in R80b35 and R160b35.
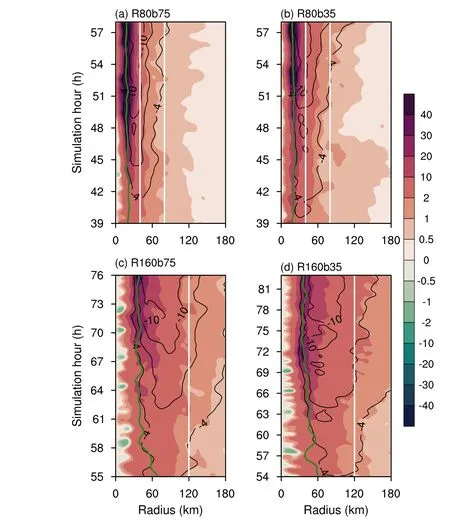
Fig.6.Temporal evolutions of the radial advection of the absolute vertical vorticity (m s—2,shading) and radial inflow (m s—1, contoured in black line every 3 m s—1) averaged vertically from 0 km to 1 km during the period when the vortex intensifies from 15 m s—1 to 35 m s—1 in(a) R80b75, (b) R80b35, (c) R160b75, and (d) R160b35.The radius of maximum wind is plotted as the green line.The white line denotes the radius of 40/80 km in (a, b) and 120 km in (c, d), respectively.
In summary, the initial wind field specified by the RMW andbcan regulate the distribution of inertial stability and convection in the eyewall and outer region, thus modulating the extension and strength of the convectively induced radial inflow at lower levels.Therefore, the radial advection of absolute vertical vorticity and the changes in tangential wind differ with different wind field structures, leading to a varying size—intensity relationship.By solving the SE equation, we calculate in the following subsection the balanced response of radial inflow to heating released in the eyewall and outer convection to quantitatively evaluate the relative modulation of the RMW andbon the size—intensity relationship.
4.2.Diagnostics of the SE equation
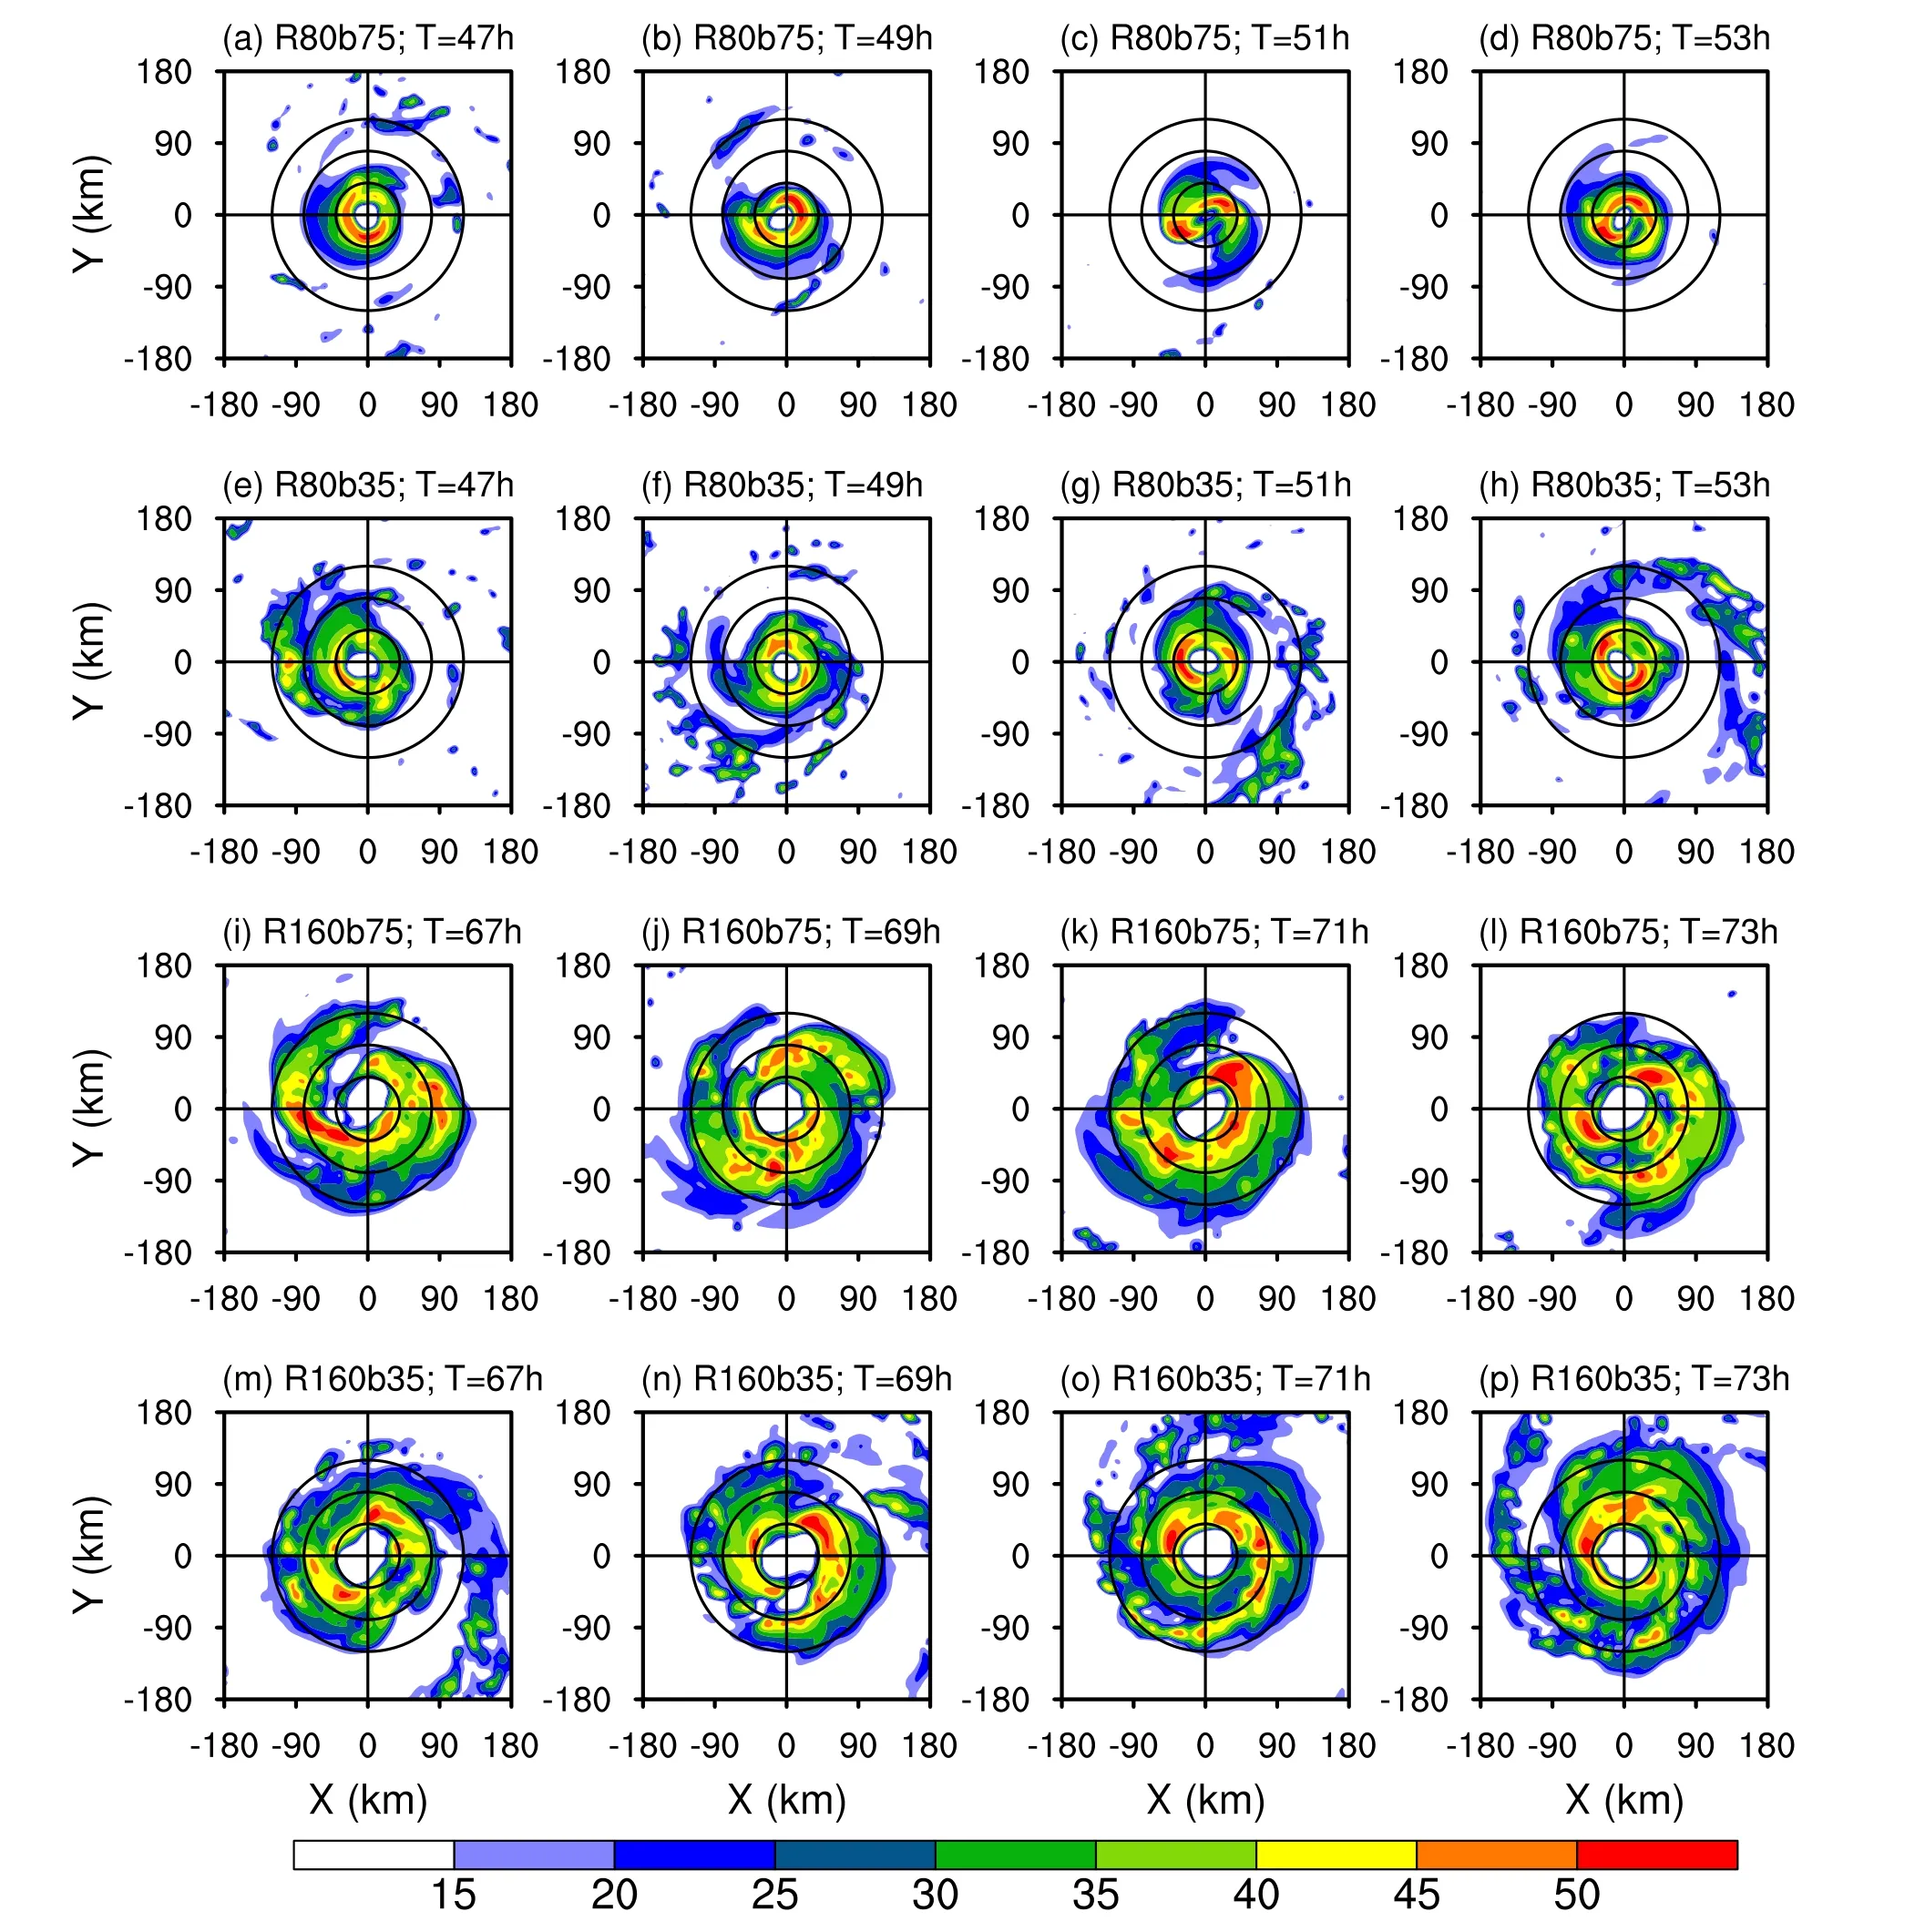
Fig.7.Snapshots of simulated radar reflectivity (dBZ, shading) at 1-km height at different times for (a—d) R80b75, (e-h)R80b35, (i-l) R160b75, and (m-p) R160b35.The circles are placed at every 40-km radius from the vortex center.
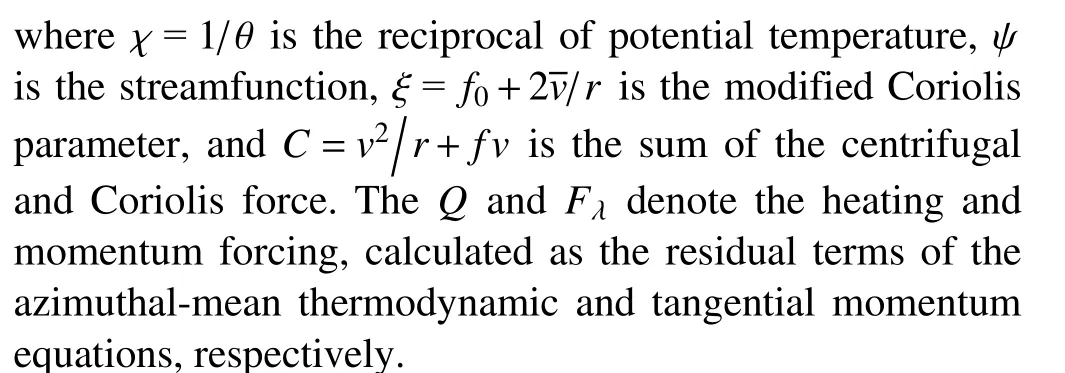
To quantitatively assess the contribution of the heating released in the eyewall and outer convection to thevttendency at lower levels, the SE equation following Bui et al.(2009) is adopted as follows:
Since the SE equation is formulated based on the assumption of gradient wind balance (Bui et al., 2009), it is necessary to examine to what degree this assumption is satisfied.The agradient winds are calculated asvtminusvg, wherevgis the wind satisfying the gradient wind relation in the azimuthal average.Therefore, positive and negative agradient winds indicate the supergradient and subgradient winds,respectively.In general, a large portion of tangential winds at lower levels are in gradient wind balance, except for the subgradient wind in the boundary layer and the supergradient wind near the maximum of tangential winds under the eyewall(not shown), which is consistent with previous studies(Fudeyasu and Wang, 2011; Ge et al., 2016).Although the SE equation cannot fully explain the imbalance process in the boundary layer due to the assumption of gradient wind balance, it has been proven in previous studies to be a valuable tool to evaluate the individual balanced contribution of different forcings (Fudeyasu and Wang, 2011; Chen, 2018).Li and Wang (2021b) reported that the momentum forcing within the boundary layer is sensitive to the initial wind field structure and thus could influence the evolution of intensity and size.This study will focus on the contribution of heating forcing.
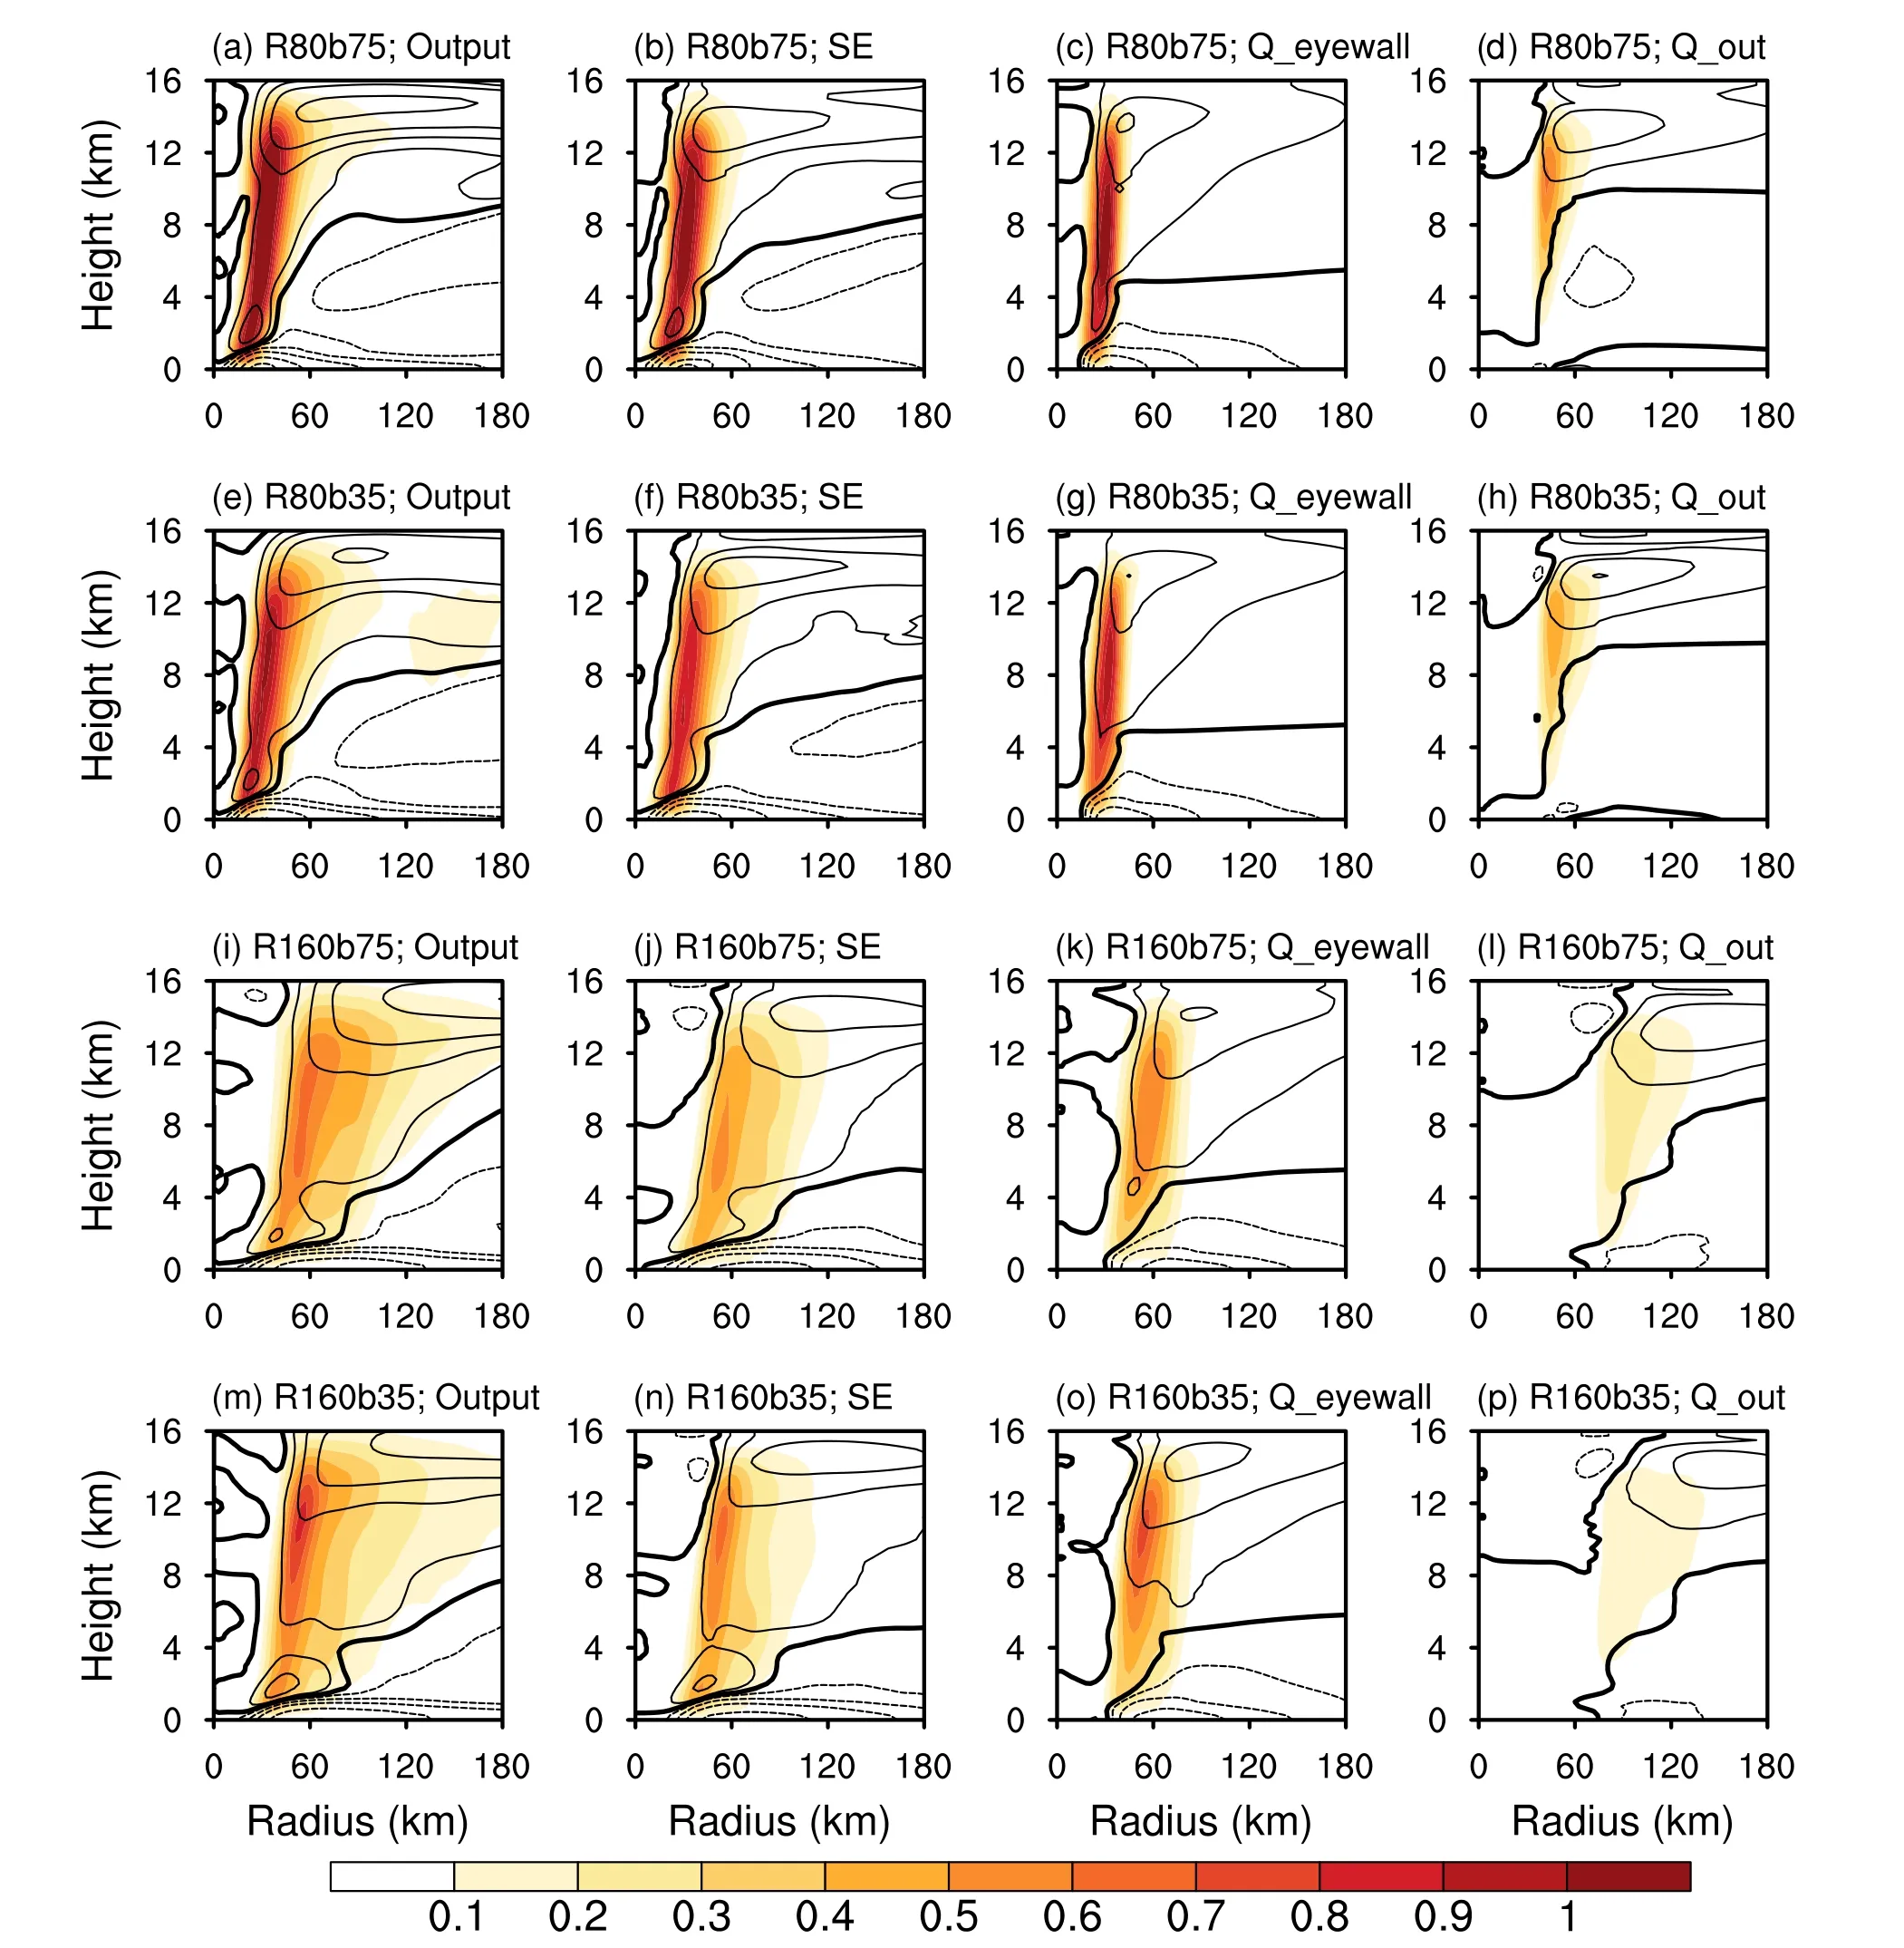
Fig.8.Radius—height cross sections of the azimuthally averaged radial (m s—1, contour) and vertical velocities (m s—1,shading) based on the model output (first column), Sawyer—Eliassen equation (second column), and the balanced component induced by eyewall heating (third column) and outer convective heating (fourth column).All the results are averaged during the period when the vortex intensifies from 15 m s—1 to 35 m s—1 in (a—d) R80b75, (e—h) R80b35, (i—l) R160b75, and (m—p)R160b35.
Figure 8 presents the azimuthal-mean vertical and radial velocities averaged during the 15—35-m s—1period from model output and diagnosed by the SE equation.In general, the SE equation can capture a large proportion of the circulation, except that it underestimates the inflow in the boundary layer and outflow in the upper level.Additionally, the vertical extension of the diagnosed vertical velocity is lower,and the strength is weaker than the model output.These differences are due to the unbalanced process and upper-level eddy effect (Bui et al., 2009; Fudeyasu and Wang, 2011).It is worth noting that the structure of vertical velocity greater than 0.5 m s—1is thinner in R160b35 than in R160b75,which might be due to the evaporation cooling effect of outer convection on the eyewall.As shown in Fig.7, the active convection in the outer region of R160b35 tends to restrict the inner rainbands compared to that in R160b35,reflected by the thinner reflectively high value in the eyewall convection.As purported by Li et al.(2015), the enhanced evaporation cooling from convection outside the eyewall can reduce the inner-core extension, such that thinner vertical velocity in the eyewall convection can be expected.
We further divide heating into two regions by taking the azimuthal-mean diabatic heating rate within two times the RMW as the eyewall convection, and that which covers the area from two to four times the RMW is taken as the outer convection.Such a partition is determined by investigating the diabatic heating rate at each moment.Note that the RMW is calculated at each level since the eyewall convection tilts outward with height.The balanced response of the wind field to the eyewall heating and outer convective heating is also represented in Fig.8.The responses of the wind field to eyewall heating are the primary vertical motion within the eyewall and the radial inflow maximizing outside the eyewall at lower levels (third column in Fig.6).The heating released in outer convection drives a weak overturning circulation in the outer region (fourth column in Fig.6).Compared to the R80 group, the secondary and the overturning circulations in the R160 group have a weaker vertical motion at larger radii with a horizontally broad extension of the radial inflow at lower levels.The weak vertical velocity of the overturning circulation in the R160 group is mainly due to the loss of heating to gravity wave radiation with lower inertial stability at large radii.Additionally, the lower inertial stability implies weaker resistance to the radial movement, which facilitates the radial inflow of the overturning circulation to extend outside R120 in the R160 group (Figs.6l and p).
Figure 9 compares the contribution of radial inflow induced by heating in the eyewall and outer convection to thevttendency.The temporal evolution of the primary contribution term, the radial advection of vorticity, is shown in Fig.10.The eyewall heating is the primary source for the positivevttendency at lower levels, except within the small radii from the vortex center (first column in Fig.9).Contributions of outer convective heating, albeit small in magnitude,acceleratevtoutside the heating forcing while deceleratingvtradially inward from the heating position (second column in Fig.9), which supports the claim that the outer convection favors size expansion while retarding intensification.Comparison within the R80 group implies that decreasing thebh ardly affects thevttendency supported by eyewall heating in the inner region (Figs.9a and 9c), which is also reflected in the quite similar evolution of radial inflow near the RMW (Figs.10a and 10b).However, there is a noticeable decrease in thevttendency and radial inflow induced by eyewall heating from R160b75 to R160b35 (Figs.9e and 9g,10c and 10d).When the RMW is large, decreasing thebpromotes the convection in the outer region, leading to the extension of the radial vorticity import to larger radii (Figs.10g and 10h).In this case, the radial inflow induced by the eyewall heating with lower inertial stability seems to be more vulnerable to the influences from active outer convection in a broader wind field.
In summary, the secondary circulation induced by eyewall heating is the primary source for spinning up thevtat lower levels, which is modulated by the RMW since it influences the eyewall—convection organization and energy conversion efficiency.The influences of outer convective heating,although small in magnitude, spin up the tangential wind in the outer region to facilitate size expansion while spinning down the wind inside the heating position.When the RMW is large, the eyewall-induced radial inflow, thus the positivevttendency, in the inner region can be weakened by the outer convection.The stand-out negative influences of the outer convection to intensification as RMW increases explain why the modulation of varyingbstands out in the vortices with an initially large RMW.
5.Conclusion and discussion
This study investigates the modulation of initial wind field structure on the relationship between the size and intensity of a vortex during the development stage with a series of idealized simulations.The intensity and size are defined as the azimuthally averaged maximum wind (Vmax) and galeforce wind radius (R34), respectively.The initial structure is modified by the radius of maximum wind (RMW; 80 km,120 km, and 160 km) and the shape parameterbdetermining the radial decay of tangential wind outside the RMW (0.35,0.50, and 0.75).
The vortex size is found to be highly correlated with the intensity during the development stage in the individual experiments without external forcing.The size—intensity relationship is quantified by the linear regression coefficient of R34 againstVmax, measuring the degree of size expansion at the same intensity increment.The RMW is the primary factor modulating the size—intensity relationship.The degree of size expansion relative to the same intensity increment increases profoundly with RMW.Comparatively, the effect by reducingbis of smaller magnitude and gradually stands out as the RMW becomes large.Various size—intensity relationships among the vortices with different initial structures divert the size distribution relative to the same intensity,reducing the overall size—intensity correlation if mixing up all experiments’data.
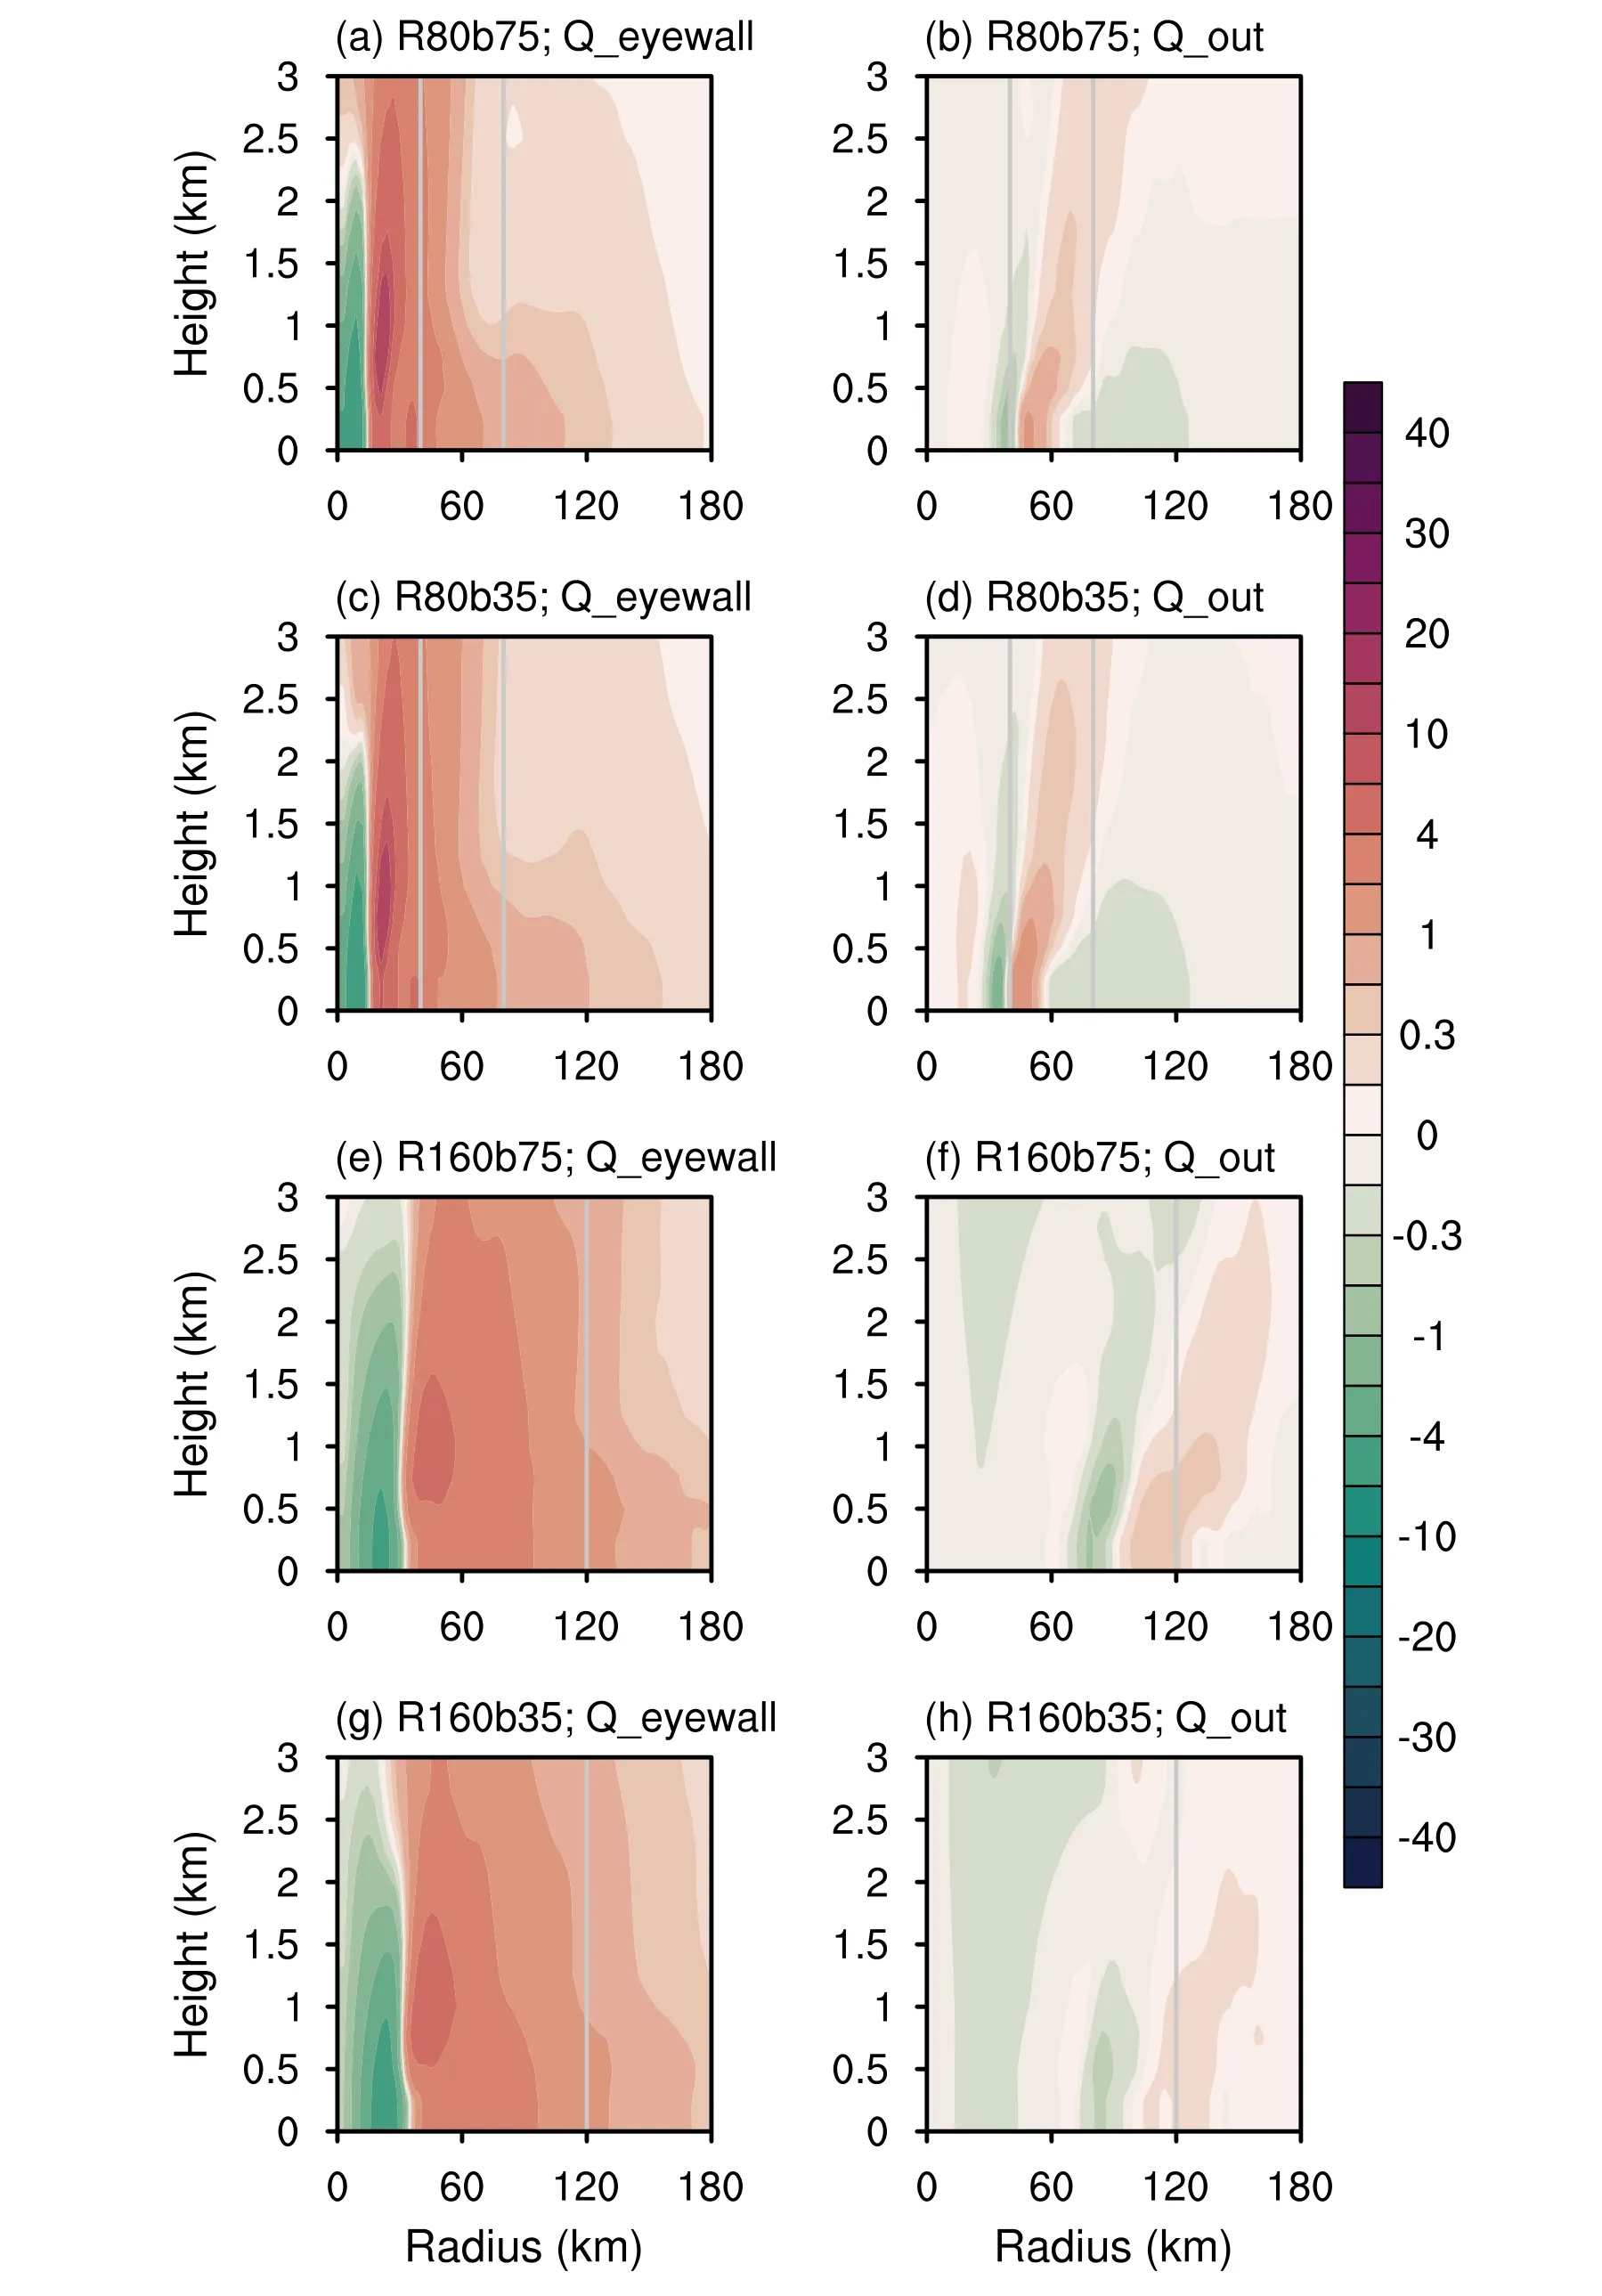
Fig.9.Radius—height cross sections of the tangential wind tendency contributed by the eyewall heating (first line), outer convective heating (second line), and the momentum forcing (third line) based on the Sawyer—Eliassen equation.Results are averaged during the period when the vortex intensifies from 15 m s—1 to 35 m s—1 in R80b75 (first line), R80b35 (second line),R160b75 (third line), and R160b35 (fourth line).The grey line denotes the radius of 40 km and 80 km in the R80 group and 120 km in the R160 group, respectively.
The size—intensity relationship is determined by changes in the tangential wind near the RMW and R34,which mainly arise from the advection of absolute vertical vorticity by the radial inflow at lower levels.The radial inflow induced by convection in the eyewall and outer region is modulated by the RMW andb, respectively.Based on the axisymmetric tangential wind tendency and Sawyer—Eliassen equations, the modulation of RMW andbon the size—intensity relationship can be quantitatively evaluated by calculating the balanced response of the wind field to heating released in the eyewall and outer convection.
Results show that heating released in the eyewall is the primary source of radial inflow.Enlarging the RMW reduces the inertial stability within the RMW substantially,which retards the eyewall-convection enhancement and leads to a secondary circulation with a horizontally elongated structure, thus hindering the intensification while promoting size expansion.Broadening the wind field outside the RMW by lowering thebfacilitates the convection in the outer region.The influence arising frombdecrease, although minor relative to RMW, spins up the tangential wind in the outer region to facilitate size expansion while spinning down the tangential wind radially inwards of the heating location.When the RMW is large, the broad convection in the outer region weakens the radial inflow induced by the eyewall heating, thus playing an inhibiting role in TC intensification.This explains why the modulation of varyingbstands out in the vortices with an initially large RMW.
As an extension of previous studies that solely focus on the impact of wind field structure on the intensity or size,we discuss the modulation of wind field structure on the size—intensity relationship, which might provide, to a certain degree, a more comprehensive picture of the evolution of storm structure.Results in this study suggest that considering the wind radius warning, caution should be paid to the incipient vortex with a large RMW since the wind field can considerably expand to large areas as the vortex intensifies.This study is a preliminary attempt to understand the physical mechanisms behind the varying size—intensity relationship,and more in-depth work is ongoing to incorporate more complicated internal and external forcings.For example, the unbalanced process at the convective scale and the interactions between the vortex and external forcings (i.e., the vertical wind shear) deserve more attention.To what degree and how the unbalanced process and external forcings can influence the size—intensity relationship during the development should be addressed in a future study.
Acknowledgements.This study is supported by the National Natural Science Foundation of China (Grant Nos.42175073 and 41975071).
杂志排行

Advances in Atmospheric Sciences的其它文章
- Mongolia Contributed More than 42% of the Dust Concentrations in Northern China in March and April 2023
- Super Typhoon Hinnamnor (2022) with a Record-Breaking Lifespan over the Western North Pacific
- Rainfall Monitoring Using a Microwave Links Network:A Long-Term Experiment in East China
- Recent Enhancement in Co-Variability of the Western North Pacific Summer Monsoon and the Equatorial Zonal Wind
- Interdecadal Variations of the March Atmospheric Heat Source over the Southeast Asian Low-Latitude Highlands
- Linkage of the Decadal Variability of Extreme Summer Heat in North China with the IPOD since 1981