A Lagrangian Trajectory Analysis of Azimuthally Asymmetric Equivalent Potential Temperature in the Outer Core of Sheared Tropical Cyclones
2023-09-07YufanDAIQingqingLIXinhangLIUandLijuanWANG
Yufan DAI, Qingqing LI*,3, Xinhang LIU, and Lijuan WANG
1Collaborative Innovation Center on Forecast and Evaluation of Meteorological Disasters (CIC-FEMD),Nanjing University of Information Science and Technology, Nanjing 210044, China
2School of Atmospheric Sciences, Nanjing University of Information Science and Technology, Nanjing 210044, China
3Pacific Typhoon Research Center and Key Laboratory of Meteorological Disaster of the Ministry of Education,Nanjing University of Information Science and Technology, Nanjing 210044, China
ABSTRACT In this study, the characteristics of azimuthally asymmetric equivalent potential temperature ( θe) distributions in the outer core of tropical cyclones (TCs) encountering weak and strong vertical wind shear are examined using a Lagrangian trajectory method.Evaporatively forced downdrafts in the outer rainbands can transport low-entropy air downward,resulting in the lowest θe in the downshear-left boundary layer.Quantitative estimations of θe recovery indicate that air parcels, especially those originating from the downshear-left outer core, can gradually revive from a low entropy state through surface enthalpy fluxes as the parcels move cyclonically.As a result, the maximum θe is observed in the downshearright quadrant of a highly sheared TC.The trajectory analyses also indicate that parcels that move upward in the outer rainbands and those that travel through the inner core due to shear make a dominant contribution to the midlevel enhancement of θe in the downshear-left outer core.In particular, the former plays a leading role in such θe enhancements,while the latter plays a secondary role.As a result, moist potential stability occurs in the middle-to-lower troposphere in the downshear-left outer core.
Key words: tropical cyclone, vertical wind shear, outer core, asymmetric equivalent potential temperature, trajectory analysis
1.Introduction
Previous observational and modeling studies have revealed that the distribution of moist static instabilities is commonly azimuthally asymmetric in the outer core of sheared tropical cyclones (TCs; Molinari and Vollaro, 2008,2010; Molinari et al., 2012; Li and Dai, 2020), likely associated with asymmetric convective activity in the outer core(Corbosiero and Molinari, 2002, 2003; DeHart et al., 2014;Stevenson et al., 2016, 2018; Wadler et al., 2018b; Lin and Chou, 2020).Larger convective available potential energy(CAPE), which quantifies conditional instability, is favored toward the downshear quadrant of the outer core (Molinari and Vollaro, 2008, 2010; Molinari et al., 2012).Li and Dai(2020, hereafter LD20) further indicated that, based on highresolution simulations, the degree of such an asymmetry increases with the magnitude of ambient vertical wind shear(VWS), with larger CAPE in the downshear-right quadrant and smaller CAPE in the downshear-left quadrant.LD20 found that the asymmetric CAPE distribution is associated with the asymmetric outer rainband nature forced by VWS.
In addition to mid-level temperature and humidity in the free troposphere (Molinari et al., 2012), LD20 documented that azimuthally asymmetric CAPE is closely related to the distribution of boundary-layer entropy.In a sheared environment, quasi-stationary outer rainbands are maintained mainly in the downshear semicircle (Li et al.,2017), with nascent cellular convection in the upwind sector,well-developed cells in the middle sector, and extensive stratiform clouds in the downwind sector (Hence and Houze,2008; Houze, 2010; Li and Wang, 2012a; Didlake and Houze, 2013).Observations and numerical simulations indicated that convective-scale downdrafts associated with cells that have matured in the middle portion of outer rainbands,which are induced by evaporative cooling of rainwater to the left of shear, can transport low-entropy air into the boundary layer (Molinari et al., 2013; Alland et al., 2021).Moreover, the low-entropy air can re-gain moisture and heat through the near-surface enthalpy fluxes from the ocean as it moves cyclonically (Molinari et al., 2013; Wadler et al.,2018a; Nguyen et al., 2019; Zhang and Rogers, 2019; Chen et al., 2021; Alland and Davis, 2022).Eventually, a maximum in equivalent potential temperature ( θe) exists in the downshear-right outer core of TCs.Such a process is often referred to as boundary layer recovery (Li and Wang,2012b).The boundary layer recovery by surface enthalpy fluxes is argued to play a vital role in modulating low-level ventilation and impacting subsequent changes in TC intensity(Riemer et al., 2010, 2013; Tang and Emanuel, 2012;Alland and Davis, 2022).In addition to the boundary layer recovery process, the downshear-right quadrant in the outer core is dominated by nascent cells in the upwind portion of the outer rainbands; therefore, a lack of convective-scale downdrafts favors the maintenance of large θe, contributing to larger CAPE in that region.
In sheared TCs, asymmetric distributions of potential instability also were present, particularly with potential stability in the middle-to-lower troposphere in the downshear-left outer core.As mentioned above, lower θeis found in the downshear-left boundary layer; however, maximum θevalues can be found at middle levels.LD20 demonstrated that the radially outward advection of large values of θefrom the inner core due to the asymmetric midlevel outflow results in the enhancement of θein the downshear-left quadrant.Such asymmetric outflow is forced by environmental VWS(Barnes, 2008; DeHart et al., 2014; Moon and Nolan, 2015;Wadler et al., 2021).A similar increase in θewas also observed to be associated with midlevel outflow in the outer core of Hurricane Michael (2018) based on dropsonde observations (Wadler et al., 2021).This thermodynamically favorable air was believed to shield the inner core from typical,lower- θe, mid-level air.In addition, LD20 also indicated that potential instability is observed below the downshearright midtroposphere, which results from high θeair within the boundary layer and low θewithin a dry intrusion from the middle to upper layers.
The azimuthally asymmetric distribution of moist instability in the outer core is expected to give rise to asymmetric convective activity outside the inner core.For instance, Li et al.(2017) documented that the early development of outer rainbands in a sheared environment commences from convective invigoration in the downshear-right quadrant immediately outside the inner core, where the CAPE tends to be larger.Therefore, the characteristics of moist instability in TC’s outer core likely play non-negligible roles in TC structural changes, particularly in a sheared environment.
In the present study, high-resolution modeling results are employed to further investigate the azimuthally asymmetric distribution of moist instability in the outer core of sheared TCs, mainly focusing on the entropy properties of the flow within the TC circulation.In particular, trajectory analyses are performed to explore the trajectory characteristics associated with entropy variations.The addressed questions are: What are the forward and backward trajectories in a sheared environment, and what are the thermodynamic effects of parcels along the trajectories on the asymmetric distribution of moist static instability in the outer core?
The remainder of the paper is organized as follows: Section 2 describes the numerical simulation data and trajectory calculation used in the study.Section 3 outlines the θecharacteristics in the experiments and the Lagrangian trajectory seeding strategy.In section 4, the processes affecting the boundary-layer θeare analyzed.Section 5 discusses the mechanisms for mid-tropospheric warming, and the conclusions are presented in section 6.
2.Data and Methods
2.1.Simulation description
Results of two idealized simulations in LD20 are used for the trajectory analysis, and the numerical simulations are conducted with the tropical cyclone model version 4(TCM4; Wang, 2007).Quadruply nested domains are utilized in the modeling, with horizontal grid increments of 54, 18, 6,and 2 km, respectively.Other modeling configurations can be found in LD20; we only briefly refer to the experimental setting here.After a 60-h spin-up of the initial weak vortex,easterly VWS is introduced into the simulation.In the following discussion, this time is reassigned to t = 0 h.In the first experiment, the magnitude of VWS is 5 m s—1, and this experiment is designated SH05.A VWS of 15 m s—1is introduced in the other experiment, which is named SH15.According to the shear magnitude classification by Rios-Berrios and Torn (2017), a VWS of 5 m s—1is consistent with weak shear, while a VWS of 15 m s—1is categorized as strong shear.Therefore, SH05 and SH15 mimic circumstances in which a TC of moderate-intensity encounters weak and strong VWS, respectively.Figure 1a shows that the storm simulated in SH05 continues to intensify, and the TC in SH15 tends to oscillate with time.
2.2.Trajectory Method
Lagrangian trajectories have merit for examining the air’s kinematic and entropic traits related to the azimuthally asymmetric distribution of moist static instability in the outer core.The current study calculates trajectories from the TCM4 6-min output using the advection correction algorithm proposed by Miller and Zhang (2019).Compared to conventional linear interpolation algorithms, the advection correction algorithm introduces the mean airflow of the surrounding grid points and can reduce position errors during the movement of air parcels, especially in unstable environments.The modeling results of the innermost domain used to calculate trajectories are re-interpolated to 88 vertical layers at vertical intervals of 50 m below z = 1 km and 250 m above.The advection correction algorithm is detailed in Miller and Zhang (2019).
3.Azimuthally asymmetric distribution ofθe in the outer core
The region outside three times the radius of maximum wind (RMW) is regularly viewed as the outer region of a TC (Wang, 2008, 2009).The RMW stays at approximately 32 km near the surface during the integration in SH05 and SH15 (not shown).Therefore, to examine the azimuthal distributions of outer-core θe, the time-azimuth distributions of θe,radially averaged between 100- and 300-km radii, are shown in Fig.1.
During the first six hours of the two experiments, the cyclones adjust to the inclusion of shear, and θevalues are distributed relatively symmetrically in the outer-core boundary layer.Afterward, larger values of boundary-layer θeare in the downshear quadrants, and smaller values occur in the upshear quadrants in SH05 (Fig.1b).When the VWS increases to 15 m s—1, larger boundary-layer θetends to appear in the downshear-right quadrant, and lower values are located in the downshear-left quadrant (Fig.1c).
As indicated in previous studies (Molinari et al., 2013;Alland et al., 2021; Alland and Davis, 2022), low entropy air in the left semicircle of shear is mainly related to downdrafts forced by the cooling due to rainwater evaporation.Subsequently, the air can be warmed and moistened by surface enthalpy flux while moving cyclonically around the storm center, and associated entropy can significantly increase when the air approaches the downshear-right quadrant.Therefore, to elucidate the features of convective-scale downdrafts and near-surface enthalpy fluxes, parcels are seeded within the downshear-right boundary layer (Figs.2a and 2b), and they are tracked backward for 15 hours starting from 27 hours.
In the midtroposphere, the outer-core θeis relatively symmetric in SH05 (Fig.1d), while larger θevalues are found in the downshear-left quadrant in SH15 (Fig.1e).Hence, a positive vertical gradient of θe(thus potential stability) is present in the downshear-left quadrant in SH15.Specifically, the asymmetric feature of mid-troposphericθebecomes even more obvious after about six hours in SH15(Fig.1e).LD20 revealed that the shear-induced, mid-level asymmetric outflow and convective-scale updrafts of outer rainbands result in larger θein the downshear-left midtroposphere.Figure 1a shows that the rain rate radially averaged between 100 and 300 km oscillates with time in SH15, suggesting outer rainband activity oscillations in that experiment.As a consequence, the quasi-periodic outer rainband behavior likely leads to the intensity pulses in SH15 (Fig.1a).Moreover, it is expected that the contribution of outer rainbands to the presence of enhanced θein the vicinity of downshear-left midlevels varies as well.For the sake of examining the possible effects of the evolving activity of outer rainbands and intensity changes on the midlevel θe, two periods in SH15 are selected to conduct backward trajectory analyses.One is between 9 and 15 h when the modeled TC intensifies,and the other is from 18 to 24 h when the TC weakens.Trajectories are seeded between z = 4.25 and 5 km in the downshear-left outer core and tracked backward for 6 h starting from 15 h (Fig.2c) and 24 h (Fig.2e).
In summary, parcels are initially placed at different altitudes between 100- and 300-km radii in the selected quadrants in SH15 (Figs.2a, c, and e).There were 4600 parcels in each vertical layer, distributed at a radial spacing of 2 km and azimuthal intervals of 2°.In the downshear-right quadrant, the initial parcels are placed from z = 0.05 to 1 km,whereas parcels are initially placed between z = 4.25 and 5 km in the downshear-left quadrant.To further identify possible differences in the asymmetric θe, characteristics under weak and strong shear, the same parcels are seeded in SH05(Figs.2b, d, and f).Note that parcels that move outside the innermost domain of simulation are excluded, and the trajectory results at z = 0.1 km and z = 5 km are called into focus in the following analyses to represent the trajectory traits near the surface and around the midtroposphere, respectively.
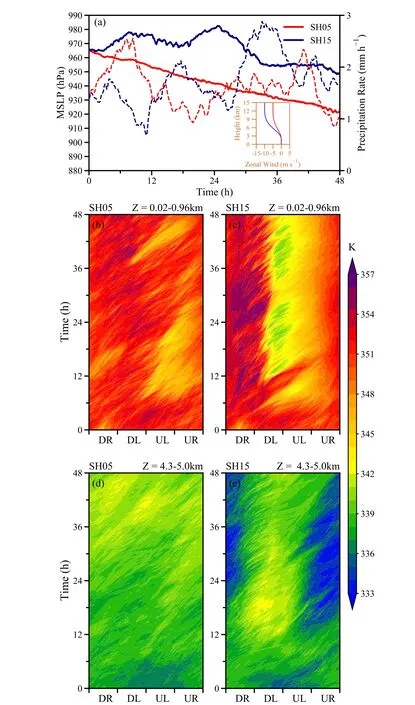
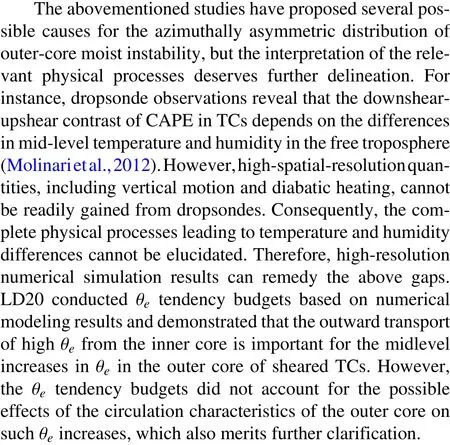
Fig.1.(a) Time series of minimum sea-level pressure (solid lines; units:hPa) and radially-averaged rainfall rates between 100 and 300 km(dashed lines; units: mm h—1) of the storms simulated in SH05 (red lines)and SH15 (blue lines).The initial environmental wind profiles used in the simulations are depicted in the inset.Time-azimuth distributions of θe(shading units: K) vertically averaged between z = 0.02 and 0.96 km and radially averaged between 100 and 300 km are shown in (b) SH05 and (c) SH15.Panels (d) and (e) are the same as in (b) and (c), respectively, but for values vertically averaged between z = 4.3 and 5.0 km.
4.Trajectory analysis of azimuthally asymmetric θe near the surface
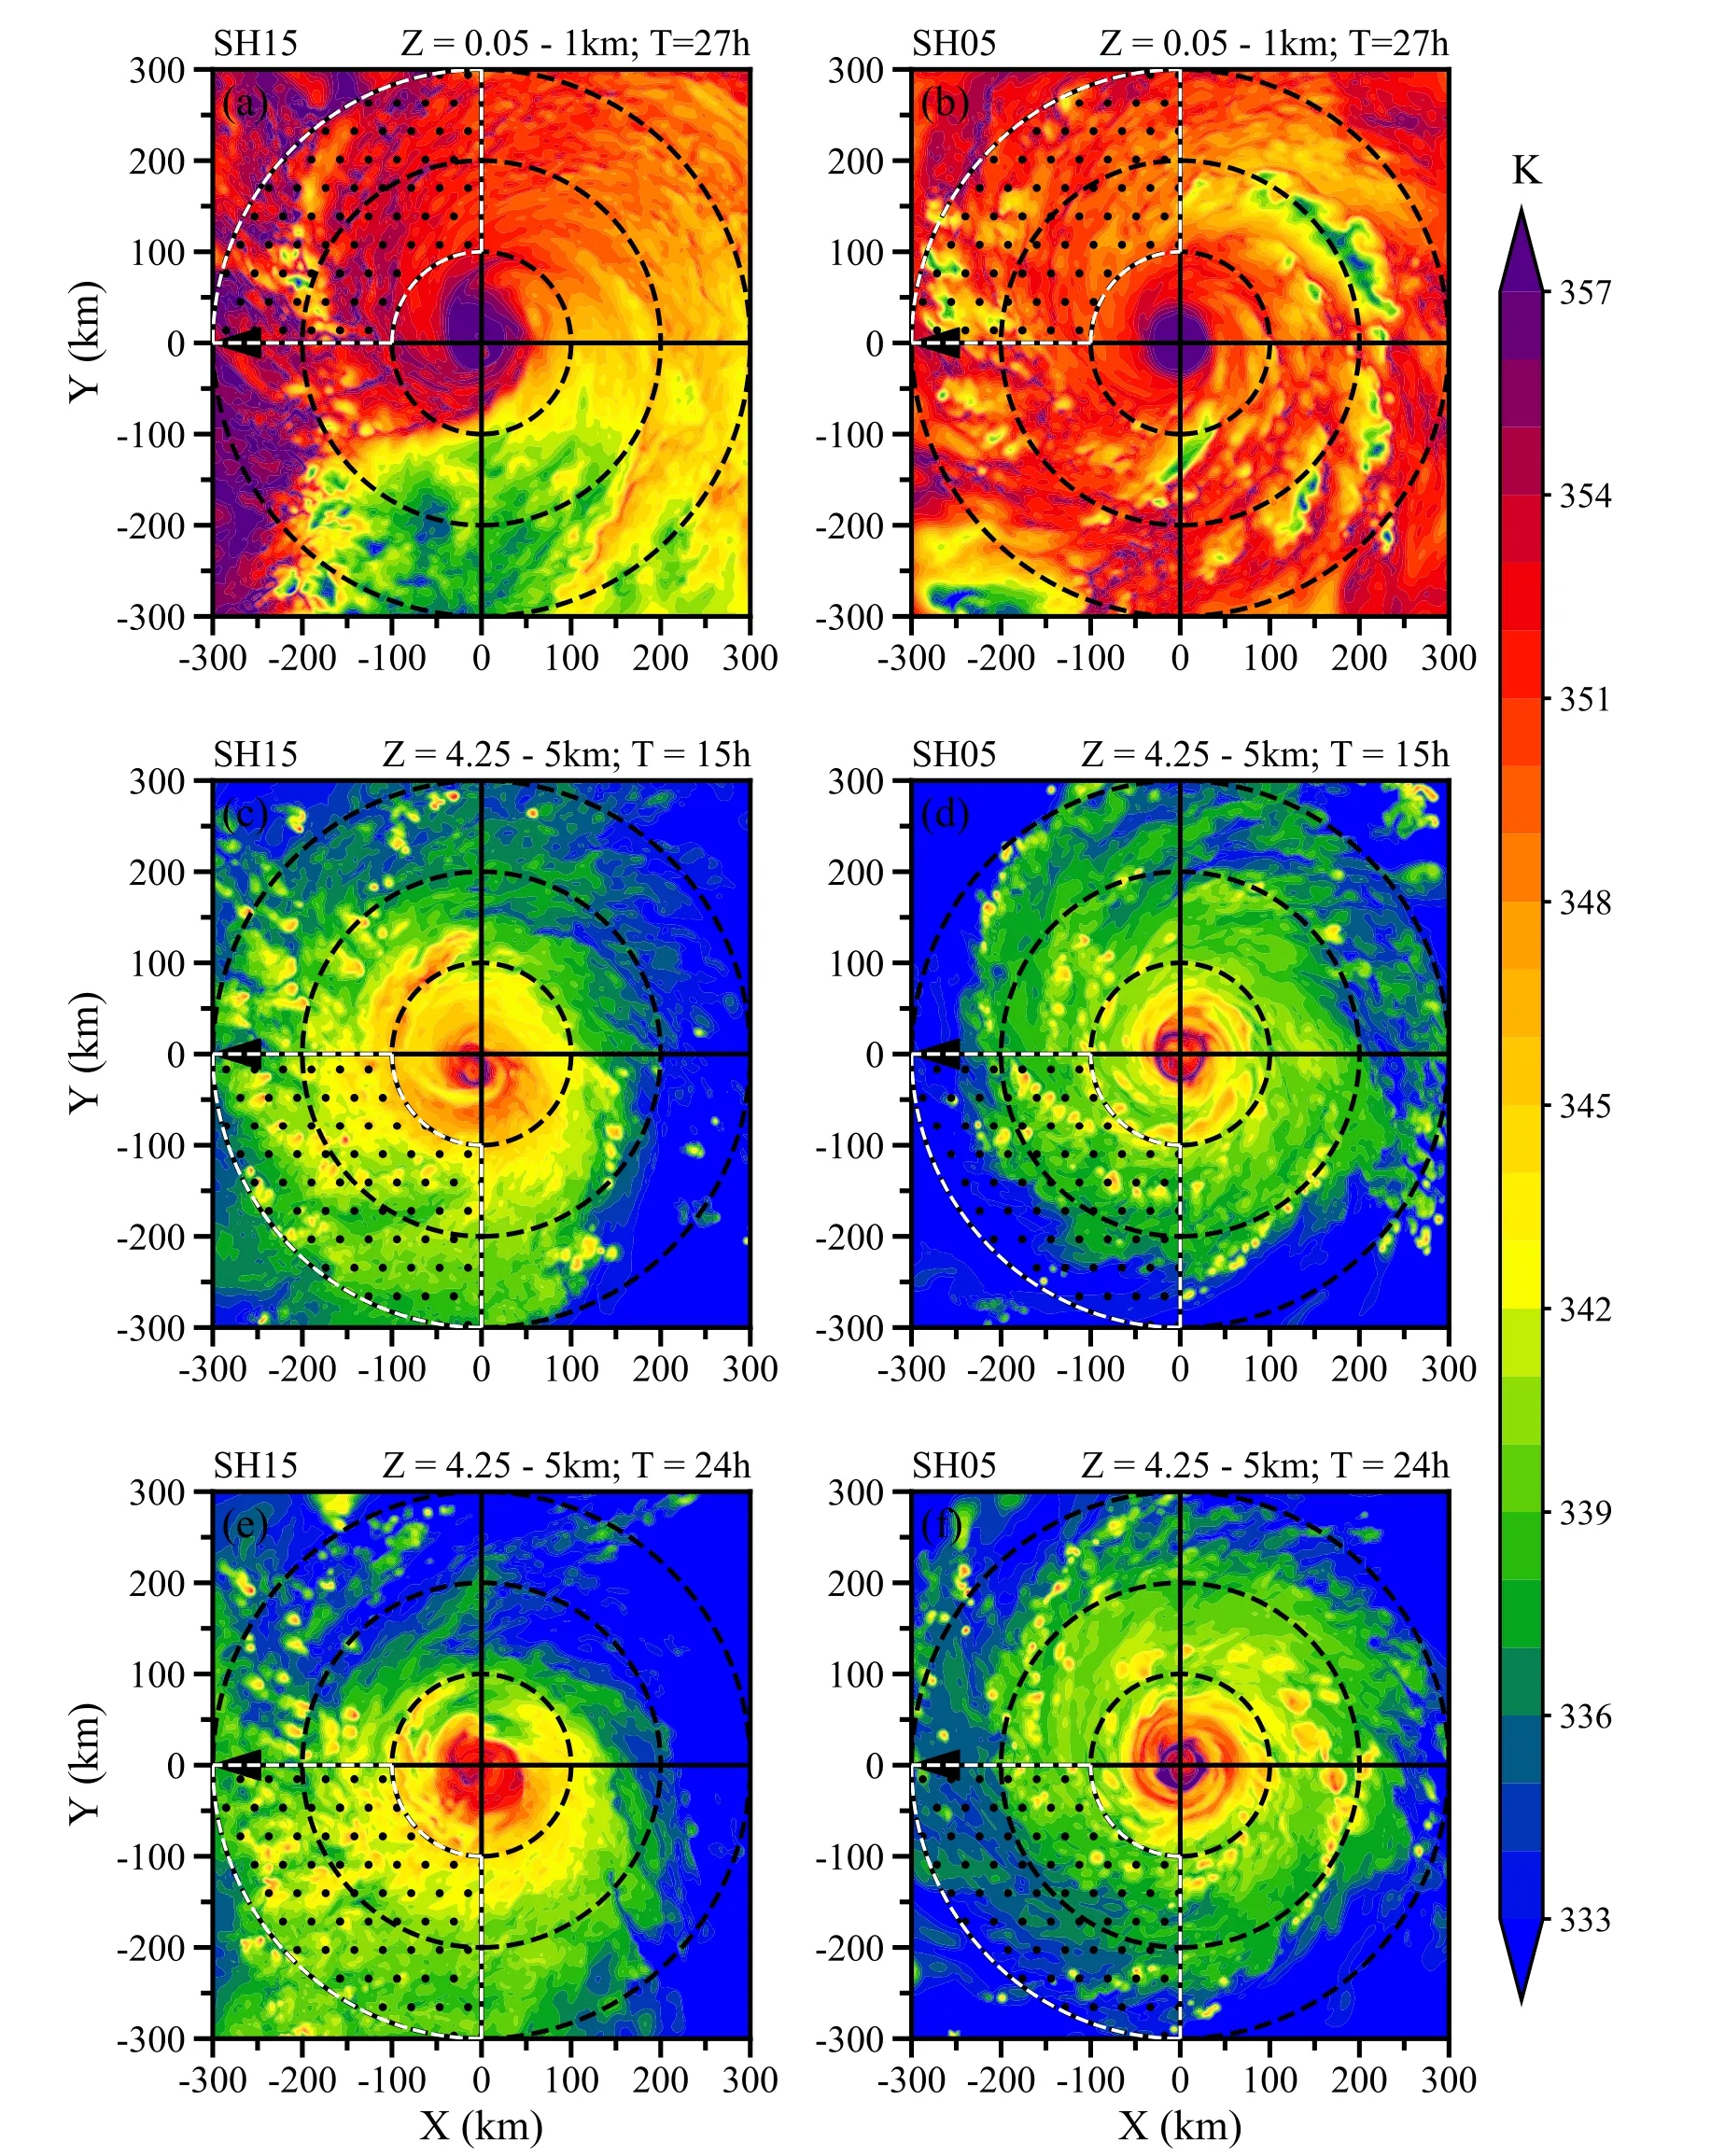
Fig.2.Values ofθe (shading; units:K)verticallyaveraged(a, b)betweenz=0.05and1.0kmat27 h,(c,d)betweenz = 4.25and 5.0 km at15 h, and (e,f)at24 h.The leftand rightcolumnsshow valuesinSH15and SH05, respectively.Black dashed concentric circles are plotted every 100 km from the TC center, and the black arrow indicates the shear direction.The sector with black dots bounded by white dashed lines represents the parcel seeding region.
As noted in section 3, significantly azimuthally asymmetric θeoccurs within the outer-core boundary layer, with larger values in the downshear-right quadrant, particularly in SH15 (Fig.2a).In this subsection, we examine the changes in θebased on near-surface trajectories.
The trajectories associated with parcels initially placed in the downshear-right outer core can be roughly classified into two groupings.One is exclusively within z = 1 km,referred to as type-1 trajectories, and the other is trajectories that can travel above z = 1 km, referred to as type-2 trajectories.The former roughly denotes parcels moving within the boundary layer during the trajectory-tracking period, and the latter represents parcels traveling above the boundary layer at certain times.Figure 3 shows the backward trajectories for 15 hours in SH15 and SH05.The tracks of these two types of trajectories are generally similar but with several differences.During the 15-h period, some of the trajectories initially are located close to the storm center, starting to move from the downshear-left quadrant, cyclonically rotating around the TC center, before finally reaching the downshearright quadrant.Another part of the trajectories, initially located further away from the center, travels at a slower speed, mainly starting from the upshear-right quadrant.Further comparison shows that the parcels originating from the downshear-left quadrant in SH15 move closer to the inner core than in SH05 when the parcels approach the upshearleft quadrant (Fig.3).Stronger VWS tends to force stronger asymmetric low-level inflow in the downshear-left quadrant(Molinari and Vollaro, 2010; Zhang et al., 2013; Ming et al.,2022).As a result, the parcels initiated from the downshearleft quadrant move more radially inward in the downshearleft quadrant in SH15 than in SH05.
Furthermore, stronger VWS is believed to produce better-organized stratiform clouds in the downwind sector of outer rainbands (Liu et al., 2022).A convective-stratiform partitioning algorithm proposed in Rogers (2010) is employed to examine the precipitation characteristics in the outer core.In addition, a 30° sector with at least half of the area occupied by stratiform cloud grids is identified as a stratiform sector between the 100- and 200-km radii (Gao et al.,2020).Figure 4b indicates that well-organized stratiform clouds in the outer rainbands persistently exist on the left side of shear in SH15 (dotted areas in Fig.4b).In contrast,contiguous stratiform clouds are not found in the outer core,particularly after 21 h in SH05 (Fig.4a).As a result,stronger low-level descending inflow occurs immediately downwind of the stratiform sector, more so in SH15 than in SH05 (Figs.4a, b), consistent with previous studies (May and Holland, 1999; Hence and Houze, 2008; Didlake and Houze, 2013; Gao et al., 2020; Liu et al., 2022).Therefore,the parcels originating in the downshear quadrant in SH15 gravitate more inward as they reach the upshear-left quadrant(Figs.3a, c).
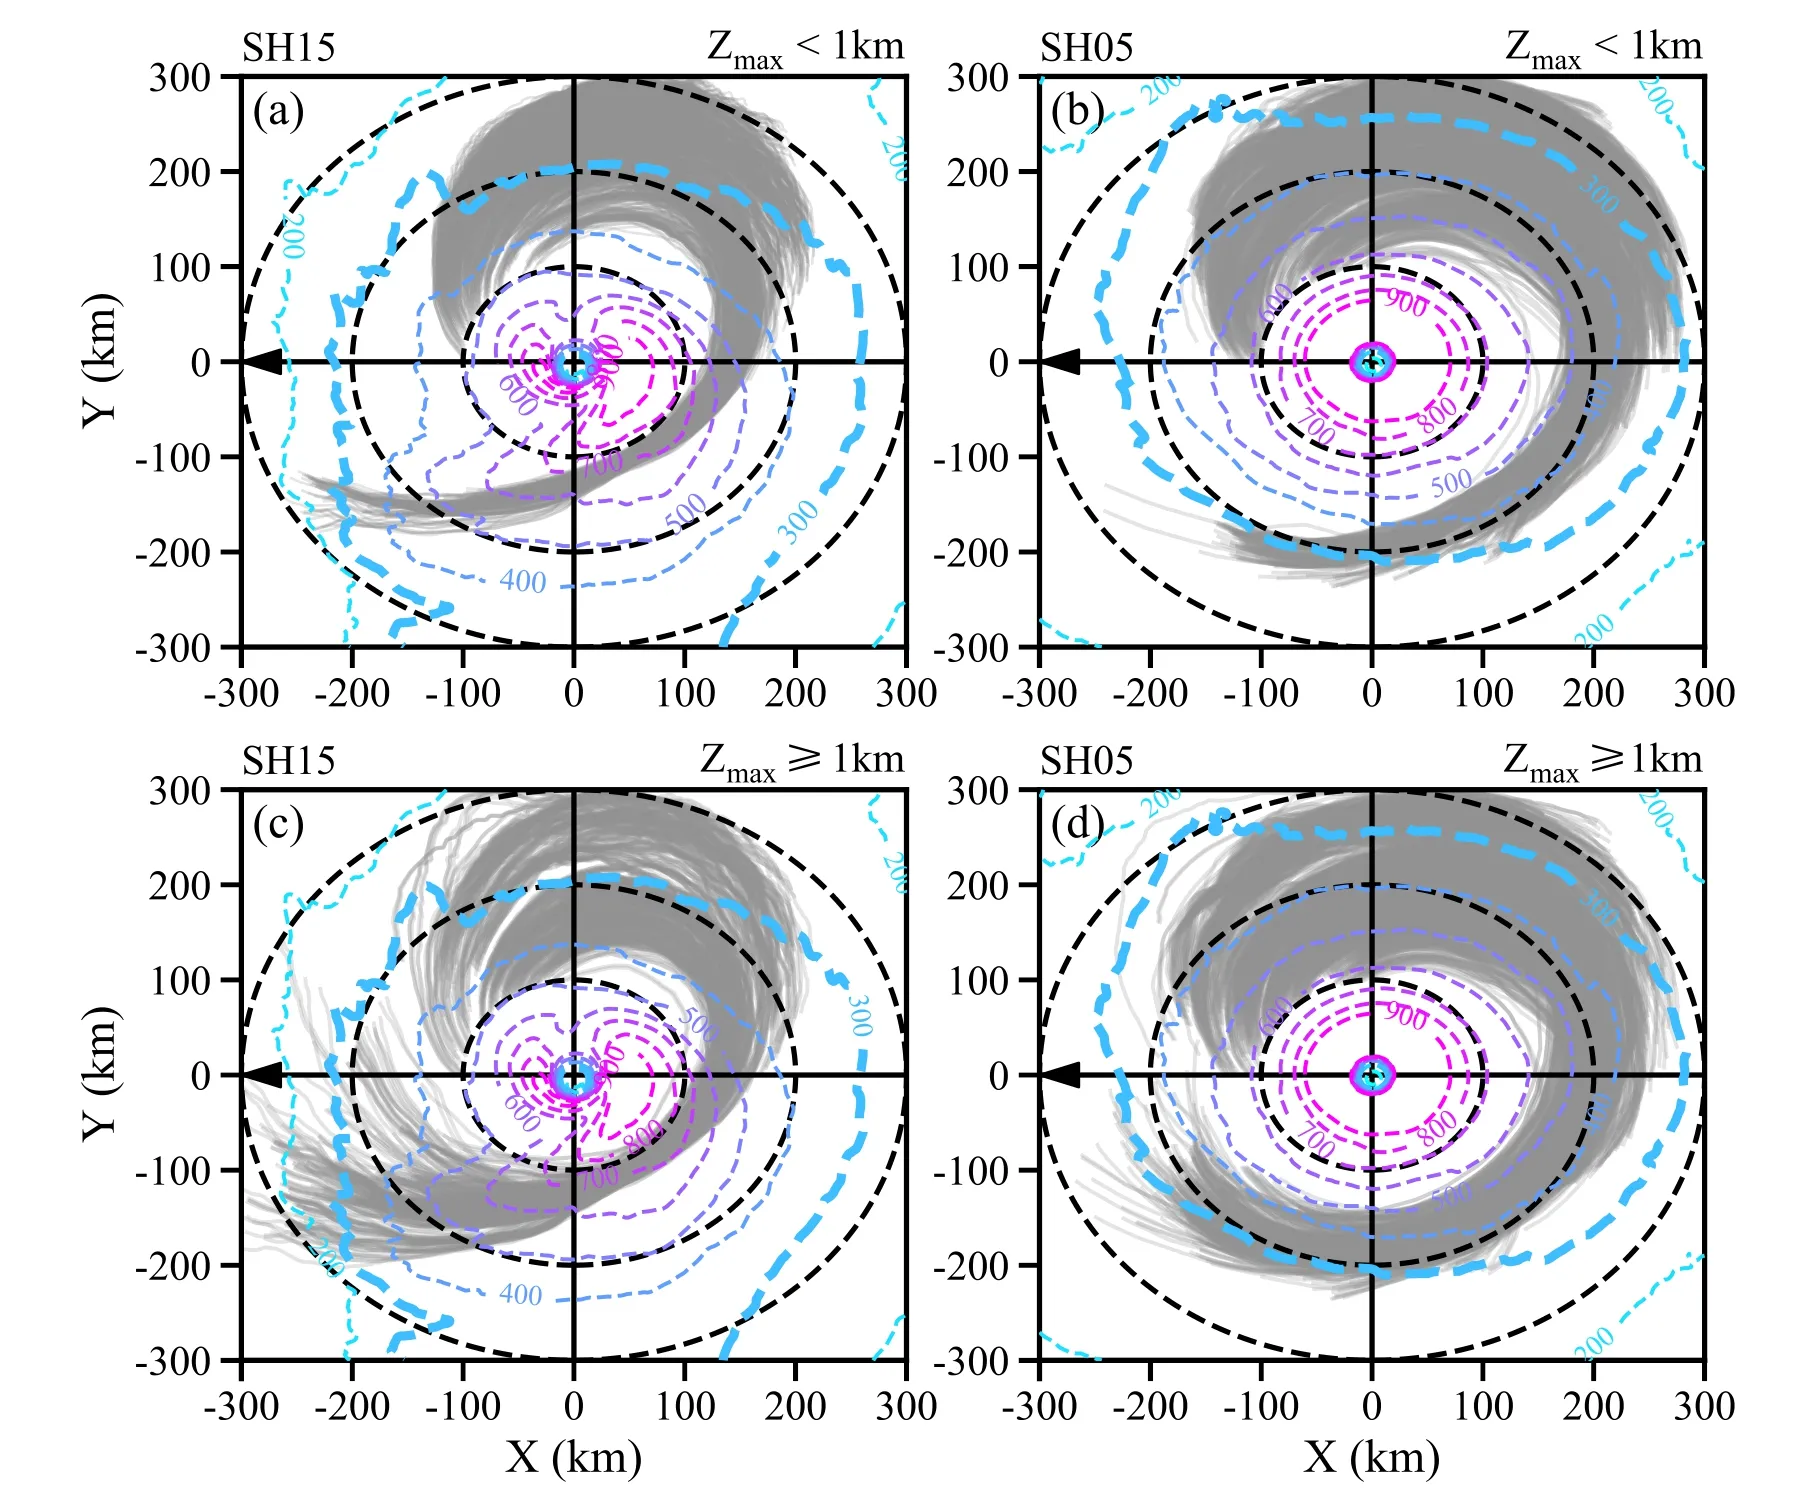
Fig.3.Tracks of (a, b) type-1 and (c, d) type-2 trajectories (grey lines).The parcels are seeded in the sectors marked in Figs.2a and 2b.The left and right columns represent results in SH15 and SH05, respectively.Surface enthalpy fluxes (dashed contours; units: W m—2), temporally averaged between 12 and 27 h, are superimposed.Black dashed circles are plotted every 100 km from the TC center, and the black arrow indicates the shear direction.
A further examination of the backward trajectories shown in Fig.4 indicates that the parcels can commence in the downshear-left, upshear-left, and upshear-right quadrants before eventually reaching the downshear-right quadrant.Figures 5a, 5c, and 5e suggest that the parcels’θegenerally increase along the trajectories in SH15.For example, the average θeof the type-1 trajectories originating from the downshear-left quadrant increases from approximately 346 K at 12 h to more than 357 K at 27 h in SH15 (Fig.5a), consistent with the θepattern in Fig.1c and the contrasting CAPE magnitudes between downshear-left and downshear-right quadrants (LD20).In contrast, the average θevalue of the type-1 trajectories originating from the downshear-left quadrant in SH05 experiences a high-low-high variation (Fig.5b), showing a downshear-upshear contrast in CAPE (LD20).When initially moving from the upshear-left and upshear-right quadrants, the parcels display a gradually increasing averageθevalue in SH05 (Figs.5d, f).
Figure 6 portrays the average height, azimuth, and θevalues of the type-2 trajectories in SH15 and SH05.Type-2 trajectories are mainly associated with parcels traveling above the boundary layer at certain times, so the average height of the trajectories is higher as the parcels fall in the downshear quadrants (Figs.6a—d).In addition, the mean height of the parcels in the downshear quadrant is higher in SH05 (Figs.6b, d) than in SH15 (Figs.6a, c).Afterward, the trajectories tend to descend in the two experiments.As revealed in previous studies, the low-level parcels can be primarily attributed to the evaporation-induced descending motions associated with convection within outer rainbands (Didlake and Houze,2009; Molinari et al., 2013; Cheng and Li, 2020).Therefore,the features of descending trajectories indicate that cellular convection within the outer rainbands is likely less tilted in SH05 than in SH15, resulting in deeper downdrafts in the former.Moreover, the average θeof the type-2 trajectories originating from the downshear quadrants progressively increases from lower values (Figs.6a—d), compared to those originating from the upshear quadrants (Figs.6e—h).
Figures 5 and 6 show that θeregularly increases along the trajectories, which mirrors the boundary layer entropy recovery.Such recovery can be quantitatively estimated using the bulk method of surface latent and sensible fluxes(Zhang et al., 2013; Wadler et al., 2018a; Zhang and Rogers,2019).This estimation neglects dissipative heating and entrainment near the top of the boundary layer.The change of θeis estimated by conducting a logarithmic differentiation to the θetendency equation:
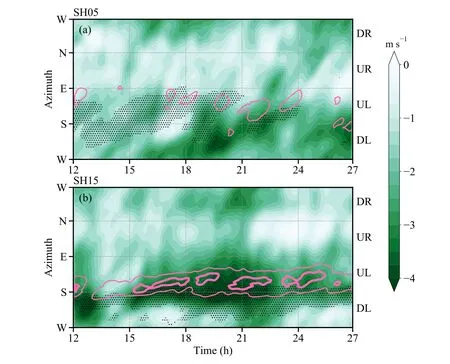
Fig.4.Time-azimuth distributions of the irrotational radial wind (shading; units:m s—1) and vertical velocity (contours; units: m s—1) vertically averaged between z =0.5 km and 3 km and radially averaged between 100- and 200-km radii for (a) SH15 and (b) SH05.Vertical velocity is contoured at —0.2 and —0.1 m s—1, with thicker lines indicating a larger velocity.The stippling indicates those regions dominated by stratiform clouds.
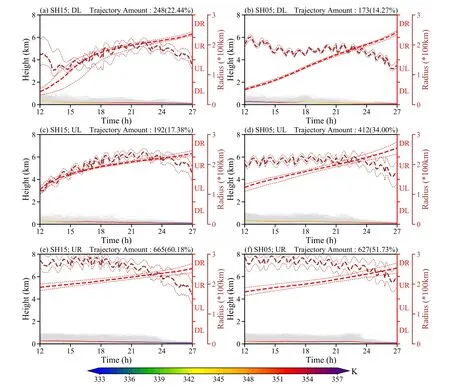
Fig.5.Height variations of type-1 trajectories (grey lines), with the final parcel positions in the (a, b) downshear-left, (c, d)upshear-left, and (e, f) upshear-right quadrants.The parcels are initially released at z = 0.1 km in the sectors marked in Figs.2a and 2b.The left and right columns represent results in SH15 and SH05, respectively.The color-changing lines indicate the average height and θe of the trajectories over time.Red and brown long dashed lines represent the median azimuth and radius of the trajectories, respectively, with dotted lines indicating 25% and 75% percentiles.
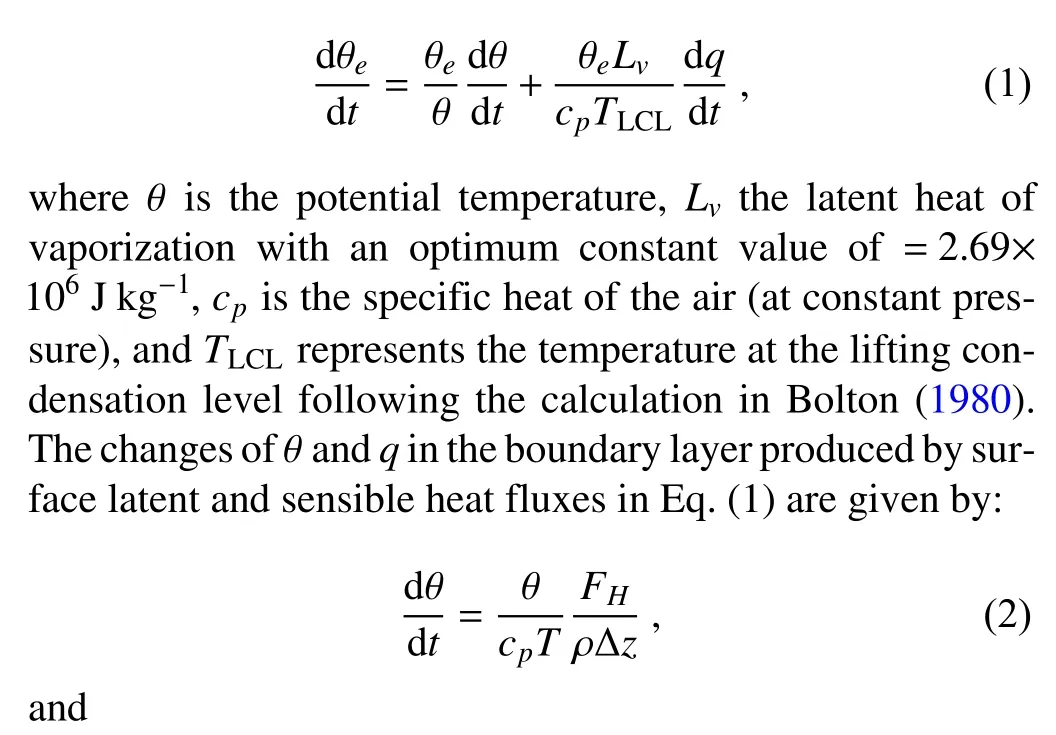
where ρ is the air density,Lvis the latent heat of vaporization, ∆zis the boundary layer height (1 km hereafter), andFHandFqindicate the surface sensible and latent heat flux,respectively.After substituting Eqs.(2) and (3) into Eq.(1),the boundary layer recovery of θecan be estimated as below:
Figures 7 and 8 compare the boundary layer, θerecovery along the trajectories to the contributions of surface enthalpy fluxes.Note that the contribution of enthalpy fluxes is not included when the trajectory parcel exceeds z =1 km.
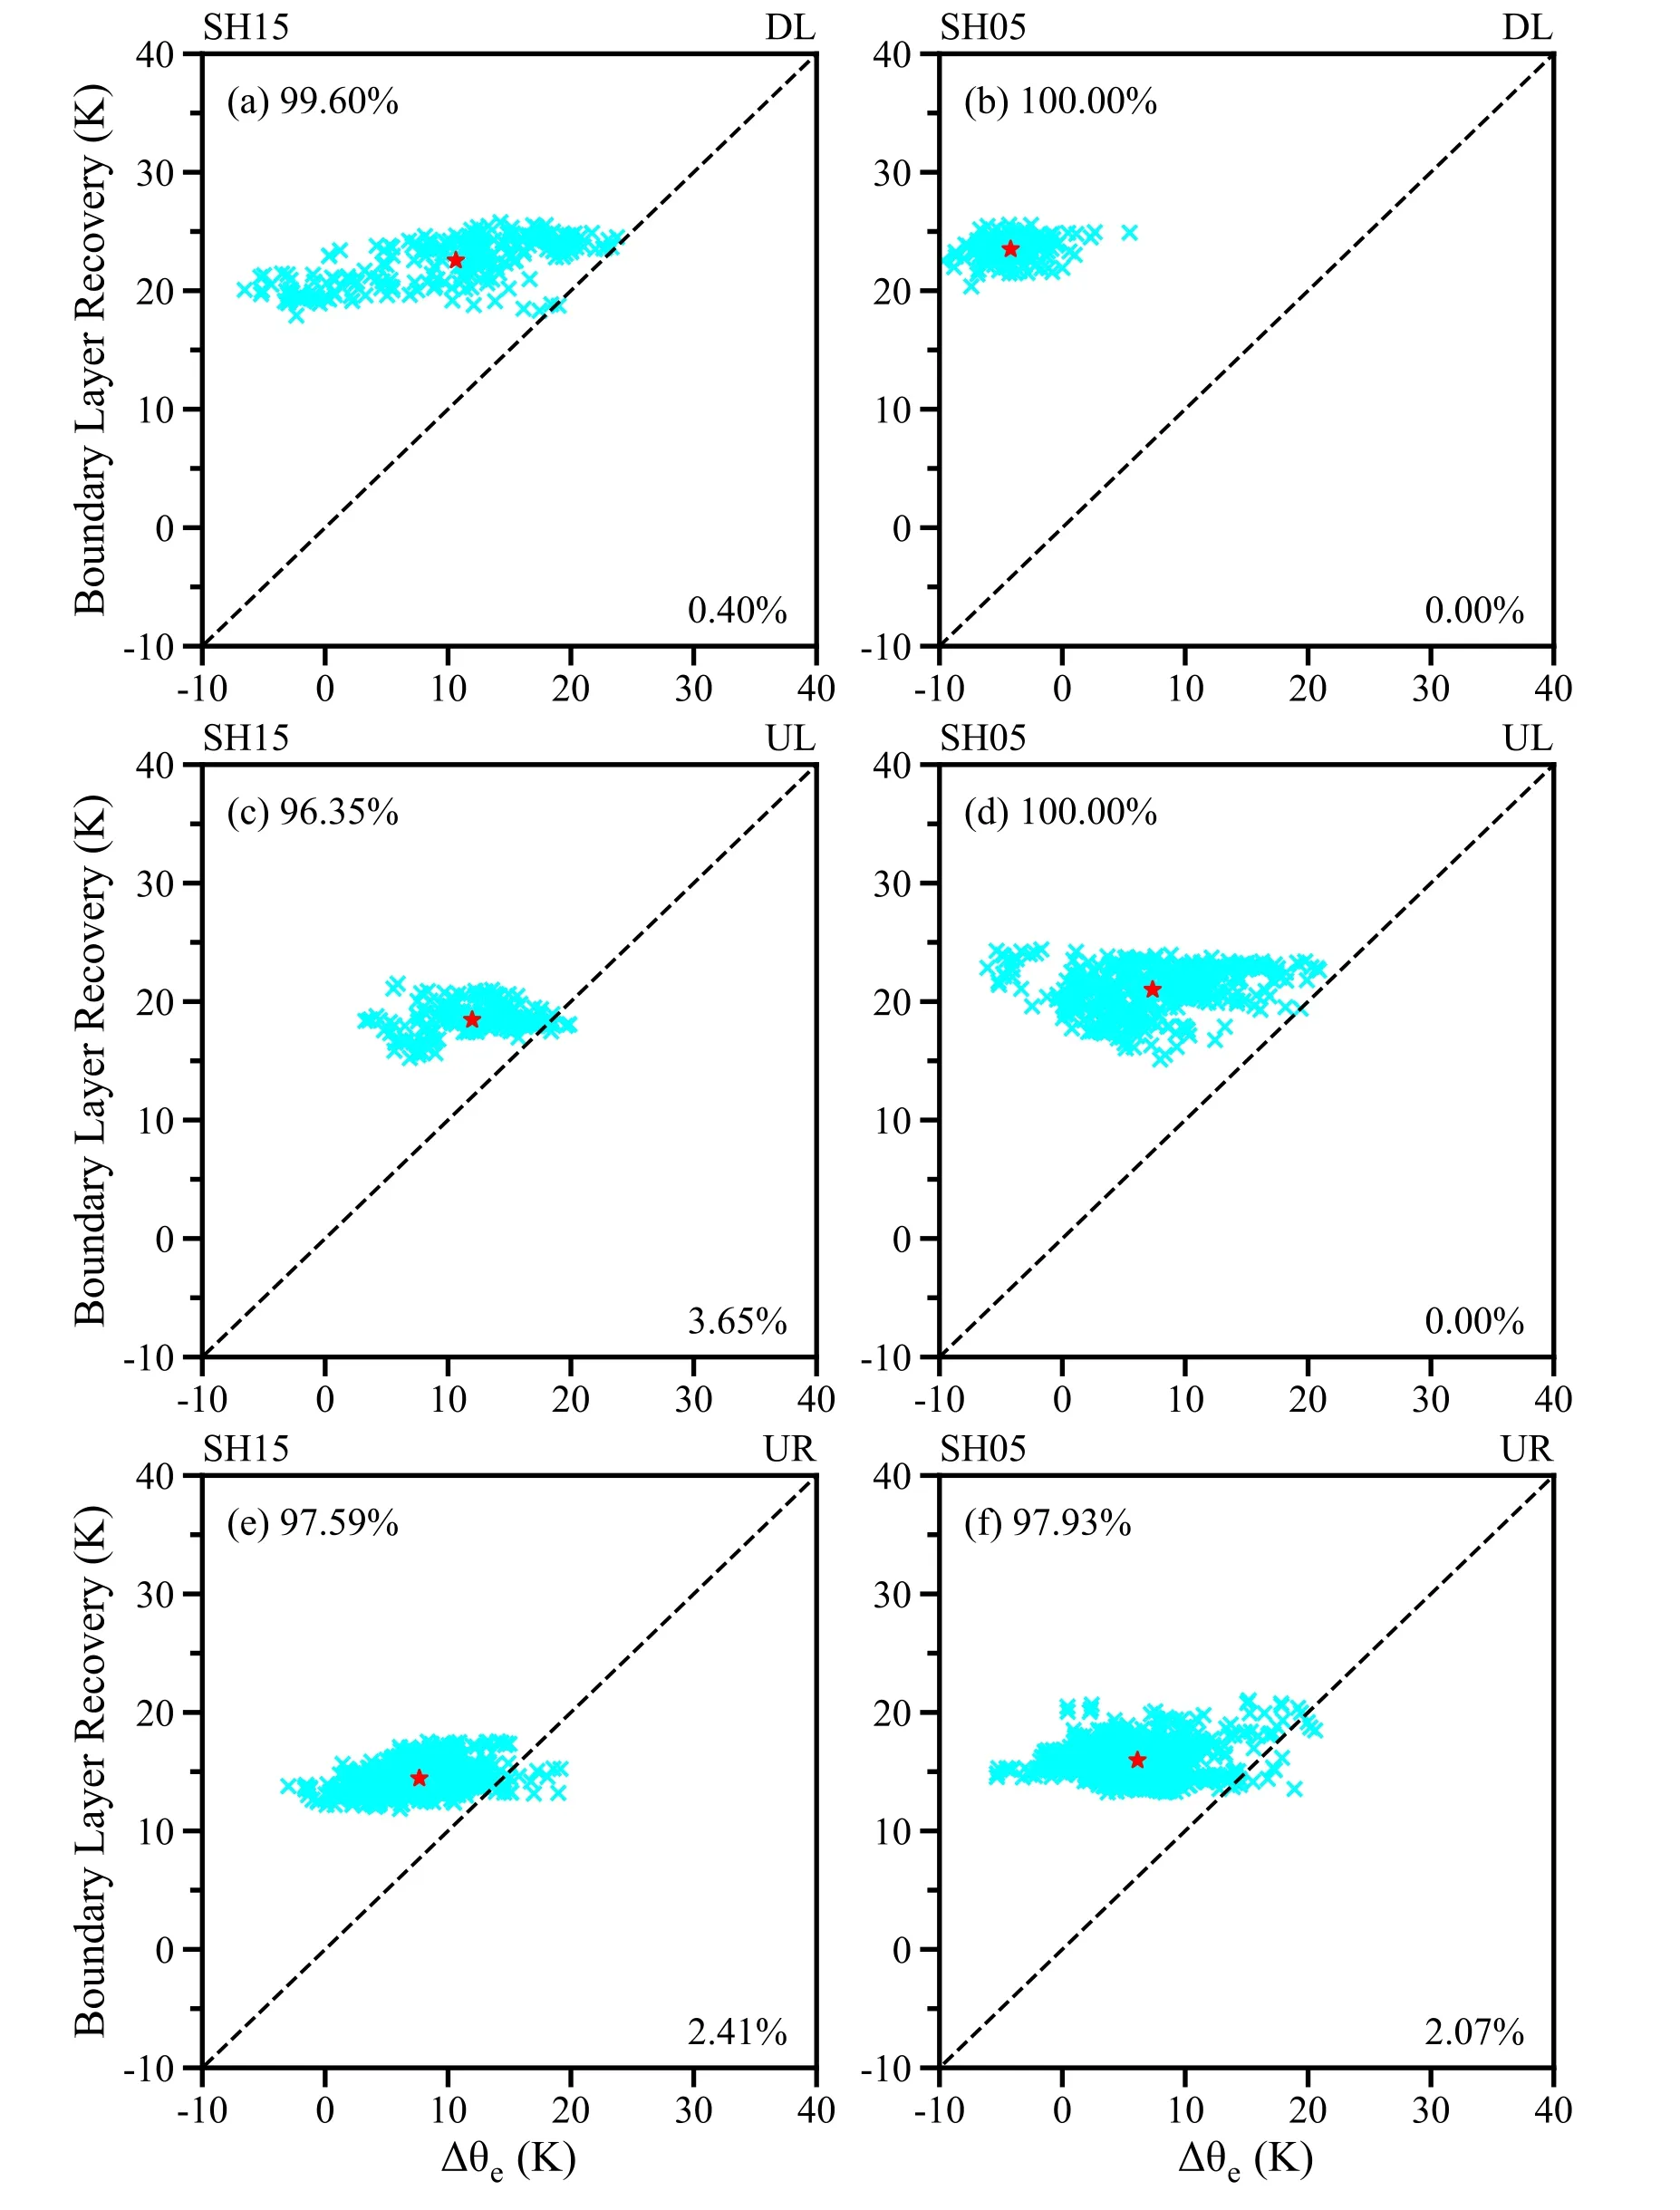
Fig.7.Scatterplots of accumulated θe changes as computed by Eq.(4) versus actual θe changes along the type-1 trajectories starting from the (a, b) downshear-left, (c, d) upshear-left, and (e, f) upshear-right quadrants for SH15 (left column) and SH05 (right column).Red stars represent the mean values.The proportion of trajectories uponwhichtheaccumulatedθechange,as estimatedbyEq.(4), is larger (smaller) than the actual θechangeis shown intheupper-left(bottom-right)corner ofeachpanel.
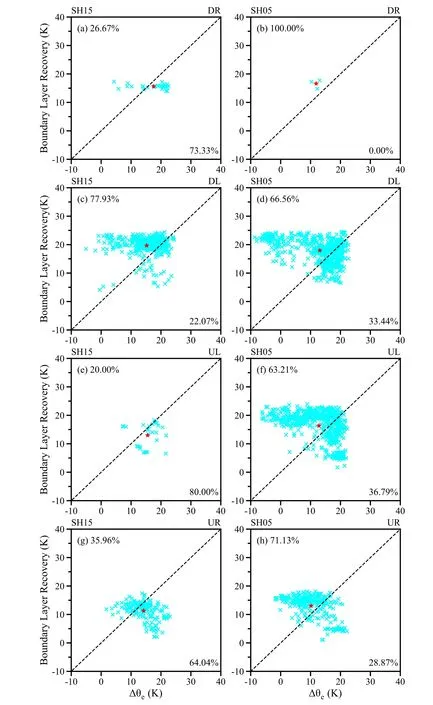
Fig.8.Scatterplots of accumulated θe changes computed by Eq.(4) versus actualθe changes along the type-2 trajectories starting from the (a, b) downshear-right, (c, d)downshear-left, (e, f) upshear-left, and (g, h) upshear-right quadrants for SH15 (left column) and SH05 (right column).Red stars represent the mean values.The proportion of trajectories on which the accumulated θe change estimated by Eq.(4) is larger (smaller) than the actual θe change is shown in the upper-left (bottom-right)corner of each panel.
Except for the parcels of type-1 trajectories originating from the downshear-left quadrant in SH05 (Fig.7b), theθeof the majority of parcels tend to increase due to surface enthalpy fluxes when the parcels move cyclonically in the two experiments (Figs.7a, c, d, e, and f).That is, most trajectories can recover from low θethrough surface enthalpy fluxes and obtain a maximum θevalue in the downshearright quadrant (Fig.5).For instance, on average, surface enthalpy fluxes can lead to an accumulated θegrowth of about 22.5 K along the type-1 trajectories traveling initially from the downshear-left quadrant in SH15, while the actual average increase in θeis around 10 K (Fig.7a).It is conjectured that diabatic condensational cooling partially limits the increase in θeso that it is not as high as the accumulated θeby surface enthalpy fluxes.In addition, the negativeθechanges shown in Fig.7b actually reflect the less asymmetric distribution of θewithin the boundary layer in weakly sheared TCs (Li and Dai, 2020).As seen in Fig.1b, larger θeis present in the downshear quadrants in the SH05 case,with peaks in the downshear-left quadrant.As a result, the θechanges tend to be negative in Fig.7b.A further examination indicates that the mean contribution of surface enthalpy fluxes to the boundary layer recovery along the type-1 trajectories is slightly larger in SH05 than in SH15 (Fig.7) due to larger surface enthalpy fluxes to the right of the VWS in SH05 (Figs.3b, d).
For the type-2 trajectories, the actual average increases in θein SH15 are subtly larger than the average values of accumulated θedue to surface enthalpy fluxes (Figs.8a, e,and g), except for those moving from the downshear-left quadrant (Fig.8b).By way of example, the actual averageθeincrease is approximately 14 K for the trajectories initially from the upshear-right quadrant, in contrast to a mean accumulated increase in θeof about 11 K induced by surface enthalpy fluxes (Fig.8g).Because those trajectories move from the upshear-right to downshear-right quadrants at large radii (Fig.6g) where the surface enthalpy fluxes are smaller than in other quadrants (Fig.3c), the contribution of the surface enthalpy fluxes to the gain of θeis relatively small(Fig.8g).Additionally, those trajectories can be maintained at a high altitude for a long time, with some parcels even moving above z = 4 km (Fig.6g).This scenario seems to be related to the upward motion of nascent convective cells in the upwind sector of principal rainbands in sheared TCs (Li and Fang, 2018).Therefore, diabatic heating can additionally contribute to the θegrowth of the trajectories (not shown).Contrastingly, the type-2 trajectory parcels initially from the downshear-left quadrant in SH15 rapidly descend from an altitude of z = 1 km or more to near the surface (Fig.6c),thereby making surface enthalpy fluxes contribute to the efficient growth of θe(Fig.7c).
In SH05, the surface enthalpy fluxes to the right of the shear are much larger than in SH15 (Figs.3c, d).Moreover,the type-2 trajectories tend to get closer to the ground in SH05 when the parcels arrive to the right of the VWS.Therefore, surface enthalpy fluxes can function efficiently in the growth of θevalues regarding the type-2 trajectories in SH05 (Figs.8b, d, f, and h).
It should be noted that although the above discussion places emphasis on the backward trajectories initially starting in the downshear-right outer core at z = 0.1 km, similar results associated with the trajectories originating at other levels below z = 1 km are also found (not shown).
5.Azimuthally asymmetric θe in the mid-level troposphere
LD20 found a relatively larger θepresent in the downshear-left outer core at middle levels (also in Fig.1e), and indicated that a positive θetendency occurs about three hours after the VWS is introduced in SH15 (Fig.8h in LD20).Such a positive θetendency is produced mainly by the shearforced asymmetric outflow in the midtroposphere that can transport high-entropy air outward from the inner core.In addition, the upward advection of low-level water vapor by convective-scale updrafts on the downshear semicircle enhance θeat midlevels (LD20).Note that the possible contribution of air from the middle and upwind portions of outer rainbands to such θeincreases were not examined in LD20.
Figure 7 depicts the 6-h backward trajectories of parcels, which are seeded at 15 h of simulation at z = 5 km in the downshear-left quadrant between 100 and 300 km(Figs.1c, d), on a radius-height plane with horizontal tracks in insets.As shown in Fig.1a, the storm simulated in SH15 is intensifying during this period.LD20 indicated that radially outward transports of high-entropy air from the inner core by shear-forced asymmetric outflow play an important role in the presence of the larger θein the downshear-left outer core.Therefore, we first examine the traits of those trajectories traveling through the inner core.Here, the trajectories that have ever appeared within a radius of 100 km from the storm center are treated as trajectories through the inner core.Around 20.8% of the trajectories move through the inner core in SH15, while around 10% track through the inner core in SH05 (Figs.9a, b).This result mirrors that VWS-forced asymmetric outflow at midlevels tends to be stronger in SH15 than in SH05 (LD20), so a much larger percentage of parcels can be transported outward in SH15.Most of the trajectories originate below z = 5 km, indicating parcels from the lower troposphere and the boundary layer are more readily transported outward to the outer core in the middle layers.
Moreover, the parcels appear at relatively small radii as they move away from the inner core and then approach the outer core.A comparison of Figs.9a and 9b further shows that more of this type start within a radius of 100 km in SH15.In addition, some of the trajectories, initially outside 200 km, move from lower levels in the downshear-right quadrant in SH15 (Fig.9a), suggesting the presence of more significant low-level asymmetric inflow as a consequence of the shear in this experiment.As noted in previous studies(Cram et al., 2007; Finocchio and Rios-Berrios, 2021),θechanges, thermodynamically produced by a variety of trajectories, can be quantitatively estimated as:
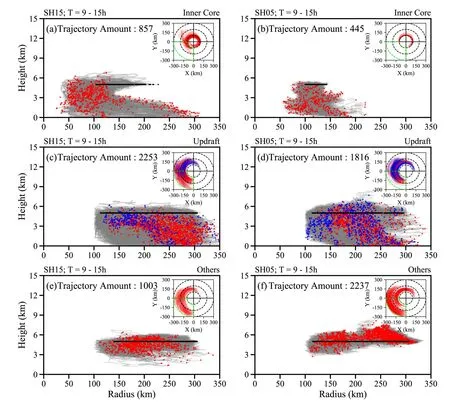
Fig.9.Height versus radius plots of the 6-h backward trajectories (grey lines) starting at 9 h, with parcels being initially released at z = 5 km.The parcels are seeded in the sectors marked in Figs.2c, d.Panels (a) and (b) show trajectories moving through the inner core, (c) and (d) display trajectories moving within the outer core with a maximum upward velocity larger than 1 m s—1,and (e) and (f) show the remaining trajectories moving within the outer core.The left and right columns represent results in SH15 and SH05, respectively.Black dots represent the release positions of parcels of the trajectories.Red dots in (a), (b), (e),and (f) represent the end positions of parcels on the backward trajectories.Red and blue dots in (c) and (d) represent the end positions of parcels on the backward trajectories with the peak upward velocity in the downshear-left quadrant and other quadrants, respectively.Insets show the horizontal tracks of the trajectories, with the sectors bounded by green dashed lines indicating the parcel seeding region.
wherePseedsrepresents the percentage of trajectories of various classifications, θeseedrepresents the θeof seed parcels at the beginning of backward trajectories, θefinalindicates the θeof parcels at the end of backward trajectories, andθedenotes the θeaveraged in the seed region.Angled brackets in Eq.(5) indicate averages over all trajectories.By and large, Eq.(5) approximates the θechanges in the targeted region due to advection and ventilation (Cram et al., 2007;Finocchio and Rios-Berrios, 2021).Based on Eq.(5), theθechange in the downshear-left midlevel outer core by these trajectories is approximately 1.69 K in SH15 in contrast to approximately 0.29 K in SH05 (Table 1).Therefore, the contribution to the midlevel increase in θeby VWS-forced asymmetric outflow is much higher in SH15 than in SH05.
LD20 demonstrated that the upward transport of water vapor also contributes to the midlevel enhancement of θein the downshear-left outer core, and trajectories with striking ascent are hence examined herein to investigate their corresponding effects.Those trajectories that appear outside 100 km from the storm center and have a maximum upward velocity exceeding 1 m s—1are discussed.The tracks of the trajectories in SH15 and SH05 are shown in Figs.7c and 7d,respectively.Compared to the trajectories from the innercore, these trajectories tend to appear at further radii as they approach the downshear-right quadrant.
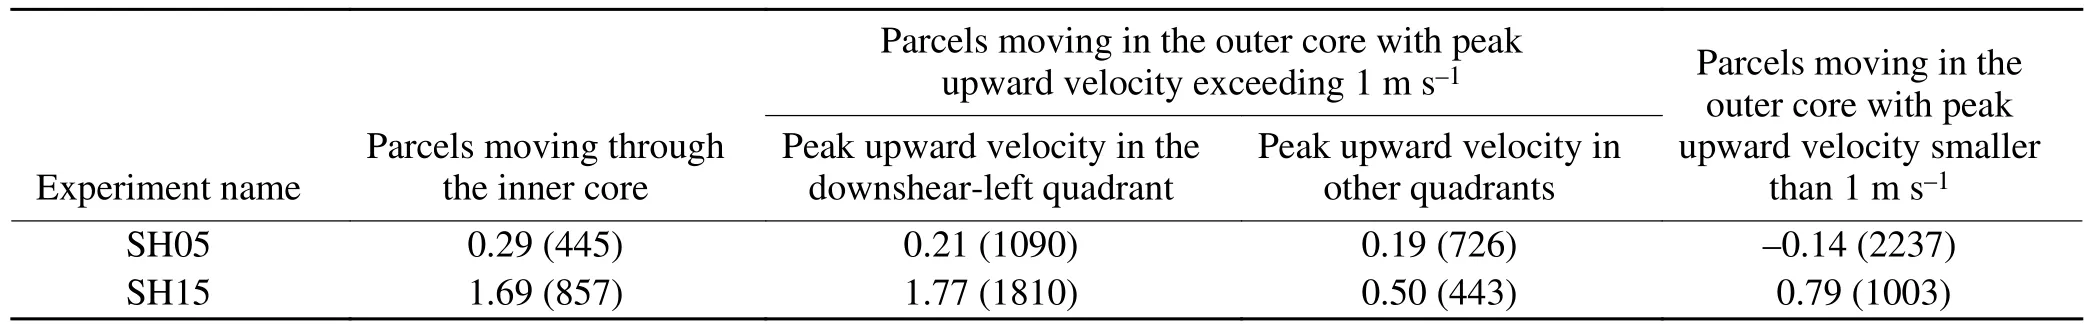
Table 1.θe changes averaged in the downshear-left outer core at z = 5 km due to the trajectories during 9 to 15 h.The number in brackets indicates the number of trajectories.
Moreover, these trajectories can be categorized into two groupings, with one having peak upward velocities found in the downshear-left quadrant and the other showing peak upward velocities observed in different quadrants.The initial locations of the first grouping of trajectories in SH15 are mainly outside a radius of 200 km from the TC center in the downshear-right quadrant (red dots in Fig.9c).Previous studies revealed that mature convective cells in the outer rainbands of sheared TCs generally populate in the downshearleft quadrant (Li and Fang, 2018), and upward motion is characterized by out-up-out and in-up-out updrafts (Barron et al.,2022).Therefore, these trajectories are closely linked to parcels moving from the upwind sector of the outer rainbands in SH15, subsequently ascending in the mature cellular convection in the middle portion of the rainbands.
Interestingly, a θeincrease of 1.77 K in the downshearleft outer core at z = 5 km is estimated in association with these trajectories (Table 1), which is slightly larger than that produced by trajectories through the inner core.Therefore,the present trajectory analysis indicates that the greatest contribution to the midlevel growth in θein the downshear-left outer core in SH15 is due to parcels ascending in the mature convective cells in the middle sector of the outer rainbands,followed by the contribution of parcels moving through the inner core.
In addition, the trajectories with peak upward velocities not in the downshear-left quadrant show their initial positions in the right-of-shear quadrants (Fig.9c).These trajectories are likely related to parcels that rise along the nascent convection in the upwind portion of the outer rainbands and subsequently approach the downshear-left outer core at midlevels.These trajectories result in an average θeincrease of 0.50 K in the downshear-left quadrant between 100- and 300-km radii at z = 5 km in SH15 (Table 1).In SH05, the track features of the trajectories moving beyond 100 km from the storm center and with a maximum upward velocity higher than 1 m s—1are akin to those in SH15, apart from the parcels starting at a more skewed position towards the center (Fig.9d).Although Table 1 shows these trajectories also contributing positively to the θechange in the downshear-left outer core at midlevels, their contributions are much smaller than those in SH15.
The movement features of other trajectories in the outer core are portrayed in Figs.9e and 9f.In SH15, these trajectories prefer to persist in the lower and middle troposphere(Fig.7e), resulting in a moderate, incremental θeincrease of 0.79 K in the downshear-left quadrant between 100- and 300-km radii at z = 5 km (Table 1).In contrast, the majority of the trajectories originate above z = 5 km in SH05 (Fig.7f)and even contribute negatively to the θechange in the downshear-left quadrant between 100- and 300-km radii at z =5 km (Table 1).These trajectories are possibly associated with the outer rainband downdrafts from the upper levels in this experiment (Didlake and Houze, 2009; Cheng and Li,2020).A more in-depth examination regarding the provenance of these trajectories is required, which is beyond the scope of this study.
Figure 1a shows the storm intensity experiencing quasiperiodic pulses in SH15.Correspondingly, the rain rate averaged in the outer core of the TC simulated in SH15 also oscillates with time (Fig.1a), implying periodic activity of outer rainbands (Li and Wang, 2012b).It has been indicated that the periodic evolution of outer rainbands can lead to TC intensity oscillations (Li and Wang, 2012b).Given the pronounced effect of outer rainbands on the θechanges in the downshearleft outer core at midlevels, we discuss the backward trajectory properties during 18 and 24 h of simulation when the storm in SH15 is weakening and the outer rainbands thrive.The traits of trajectories during the same period in SH05 are also examined for comparison.
The characteristics of the trajectories through the inner core in SH15 during this time resemble those during 9 and 15 h, except that more trajectories come from the upper layers(Fig.10a).The parcel trajectories originating from the upper levels are possibly relevant to the inflow beneath the upper-tropospheric outflow layer (Komaromi and Doyle,2017; Smith et al., 2019; Wang et al., 2020).Table 2 shows a significant increase in average θeof 2.66 K in the downshear-left quadrant between 100- and 300-km radii at z = 5 km resulting from these trajectories.Further estimations show that the corresponding θechanges due to trajectories from the levels above z = 5 km is about 0.30 K; this in contrast to the 2.36 K produced by trajectories below z = 5 km (not shown).In SH05, only approximately 7% of trajectories move through the inner core due to lower VWS (Fig.10b),yielding an average θeincrease in the downshear-left outer core in the midtroposphere (Table 2).
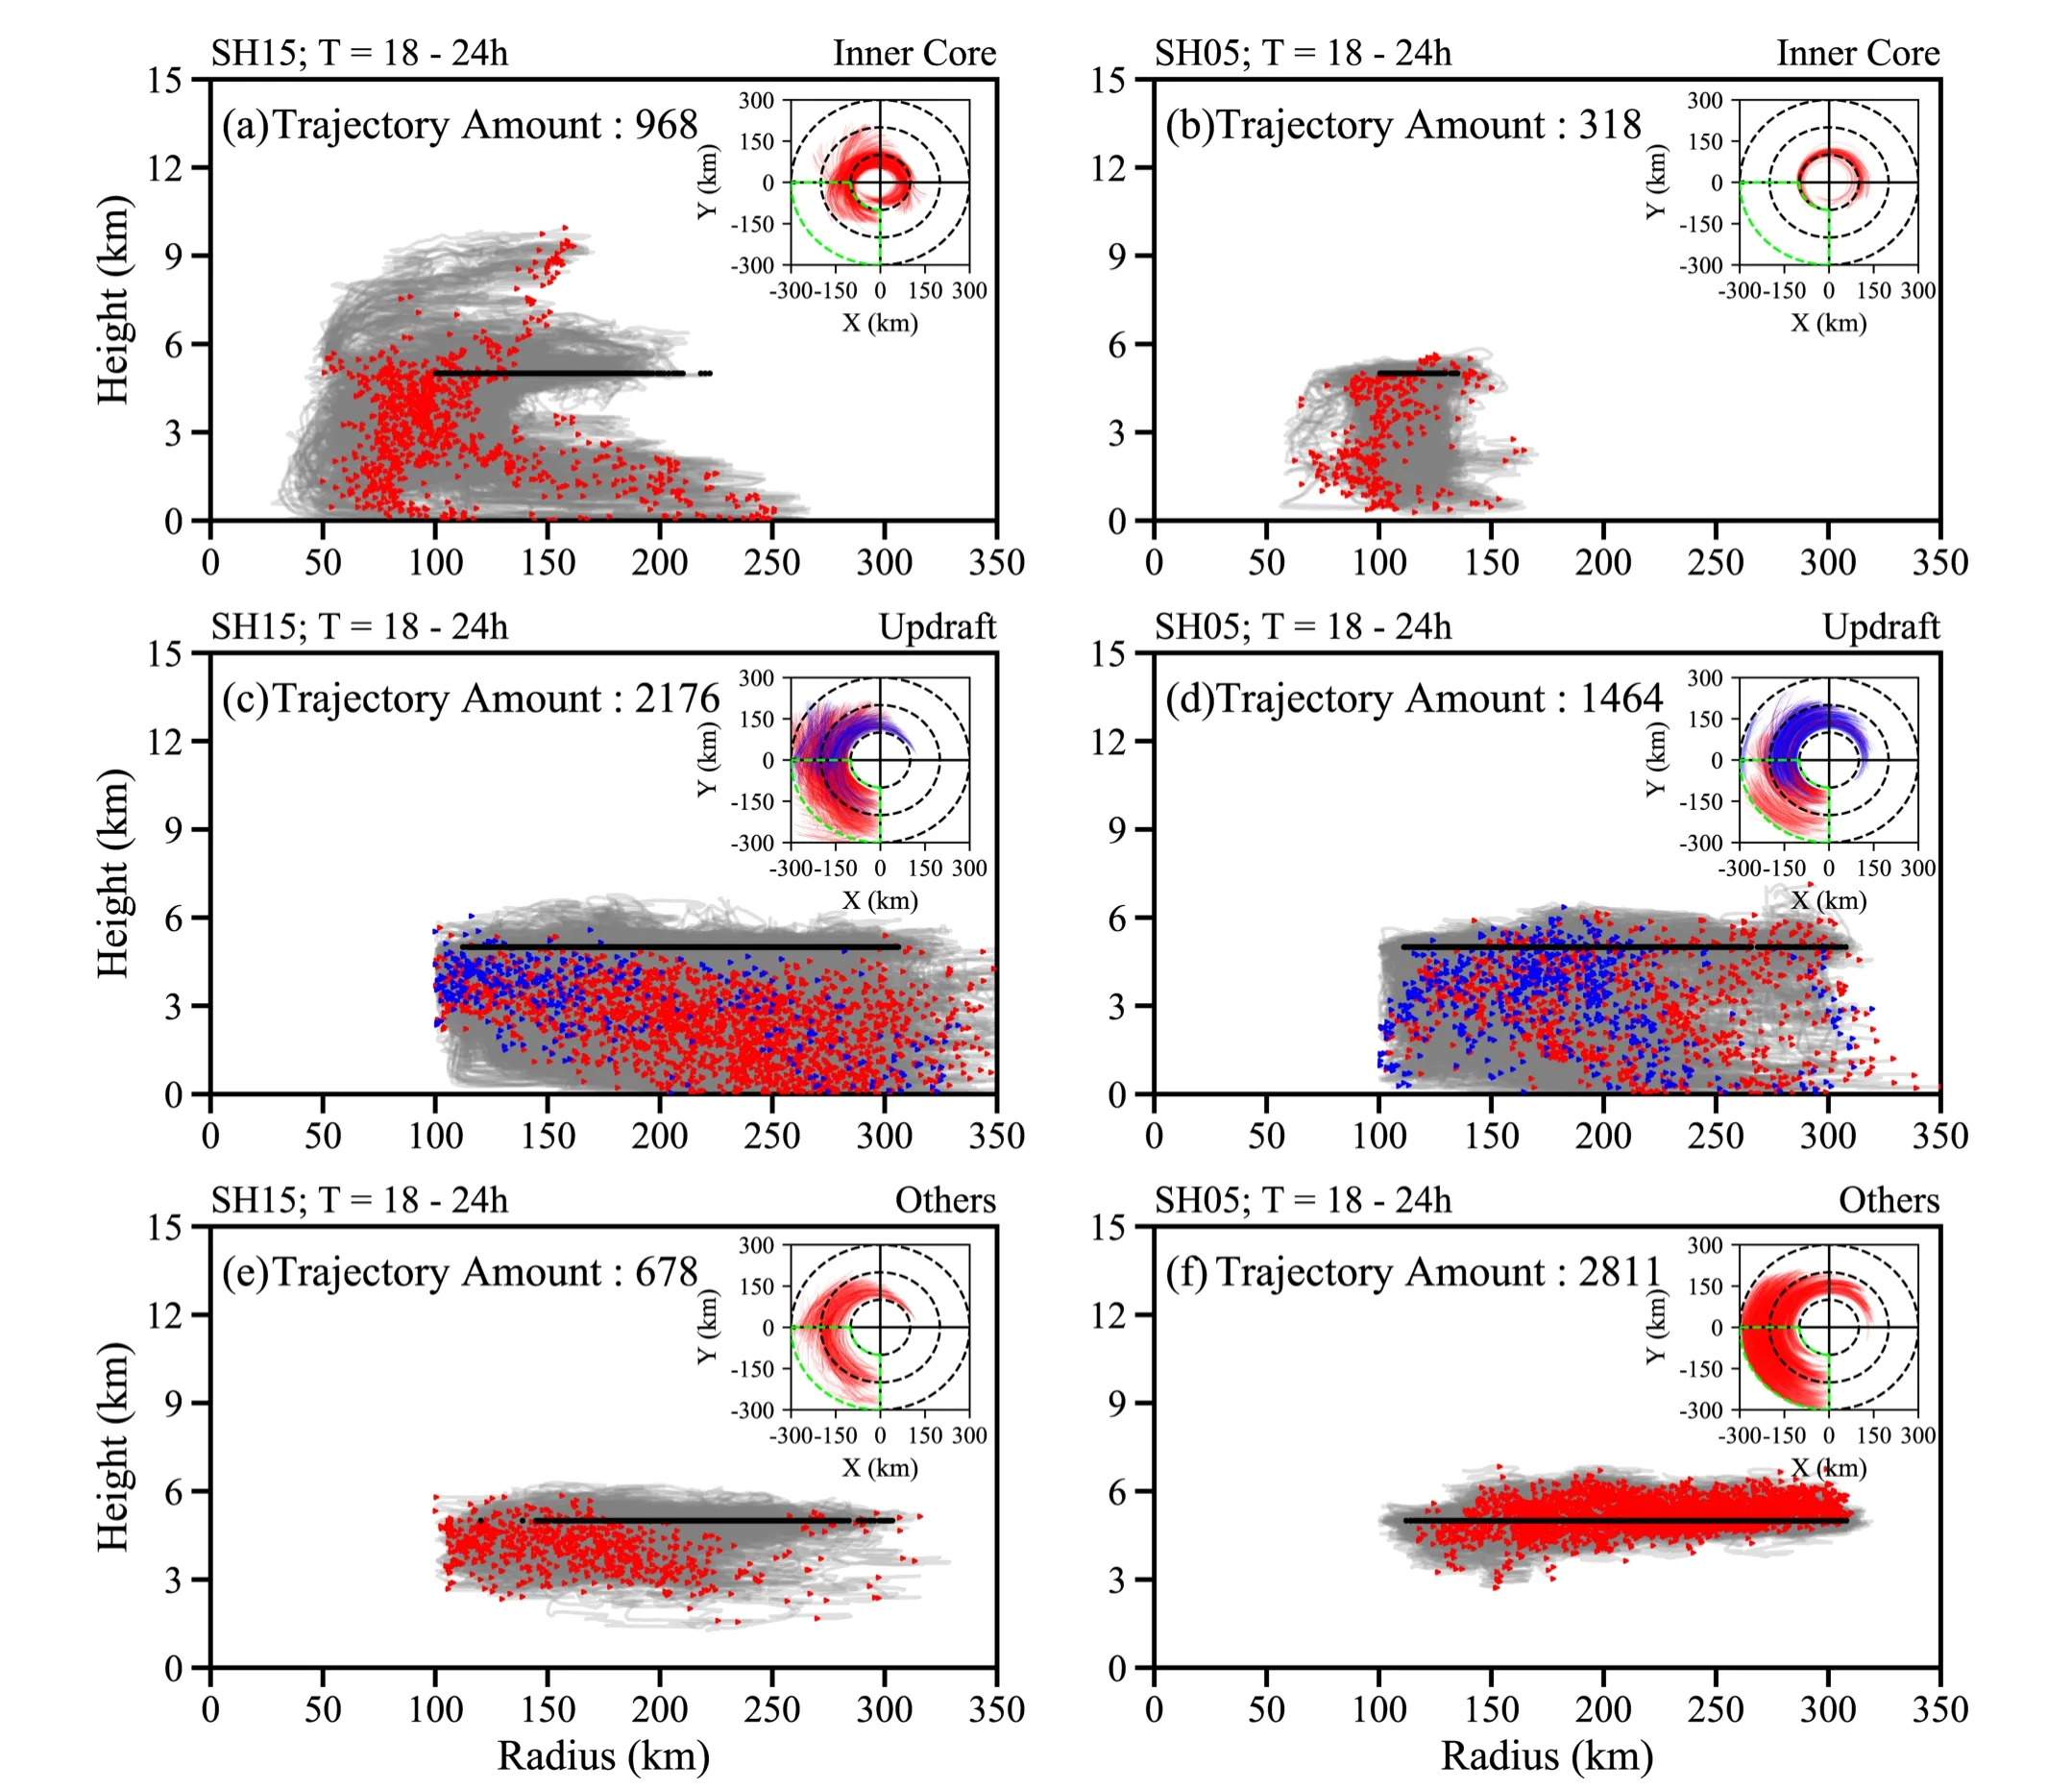
Fig.10.As in Fig.9, but for trajectories during 18 to 24 h.
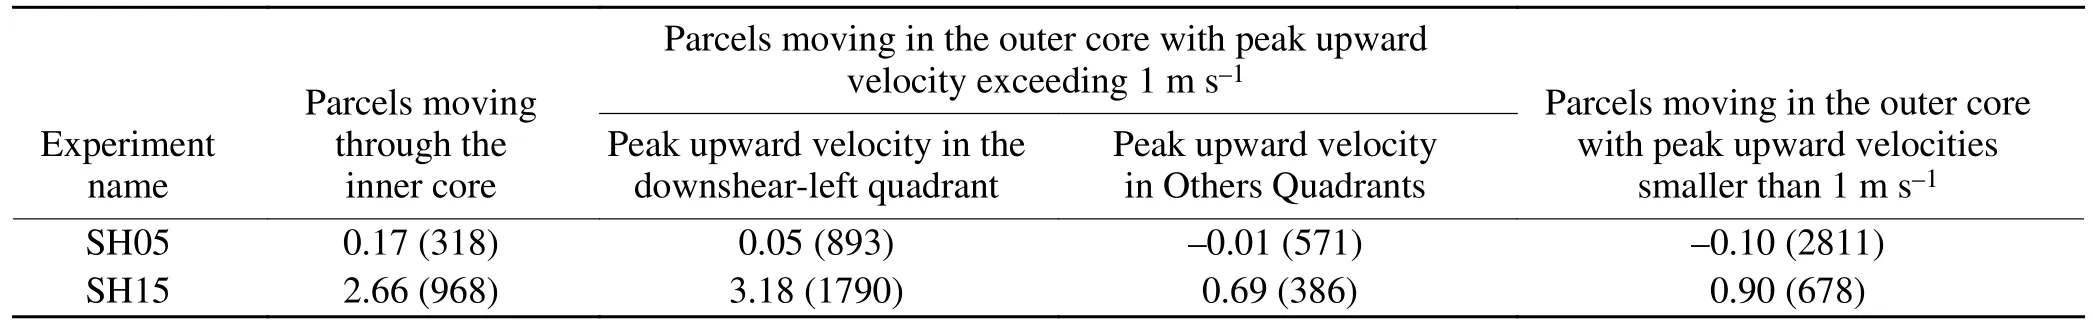
Table 2.θechangesaveraged inthedownshear-left outer core at z = 5 km due to the trajectories during 18 to 24 h.The number in brackets indicatesthenumberof trajectories.
Between 18 and 24 h, the tracks of those trajectories 100 km outside of the storm center and with a maximum upward velocity exceeding 1 m s—1are depicted in Figs.8c and 8d.These trajectories accounted for 56.9% of the total trajectories in SH15 and 31.9% in SH05, commensurate with those between 9 and 15 h of simulation.Additionally, the characteristic movement of these trajectories is similar to those during the period 9 to 15 h.However, the trajectories with peak upward velocity of > 1 m s—1in the downshearleft quadrant lead to an average θechange of 3.18 K in the downshear-left quadrant between 100- and 300-km radii at z= 5 km in SH15 (Table 2).This increase in θeis much larger than that during the period 9 to 15 h, indicating that more active outer rainbands tend to produce a larger θeincrease in the downshear-left outer core at midlevels.
Other trajectories moving in the outer core during 18 and 24 h show tracks similar to those during 9 and 15 h(Figs.10e, f).Table 2 indicates that these trajectories yield average θechanges of 0.9 and —0.1 K in the downshear-left quadrant between 100- and 300-km radii at z = 5 km in SH15 and SH05, respectively.
6.Summary and Conclusions
Observations and modeling results revealed azimuthally asymmetric distributions of θein the outer core of sheared TCs.In general, with increasing shear magnitude,the degree of θeasymmetry is more striking, with much larger near-surface θeespecially concentrated in the downshear-right quadrant.In contrast, larger θetends to appear in the downshear-left quadrant in the midtroposphere.In this study, a trajectory analysis is conducted to elucidate the trajectory characteristics with respect to the asymmetric θedistribution in the outer core.
The azimuthally asymmetric distribution of boundarylayer θein the outer core is mainly associated with convective-scale downdrafts in outer rainbands and near-surface enthalpy fluxes.Active convective-scale downdrafts in the downshear-left quadrant transport low-entropy air downward into the boundary layer, cooling the boundary layer.As a result, the parcels descending above the boundary layer, particularly in highly sheared TCs, cause the most significant changes in θeto occur in the downshear-left outer core near the surface.As the parcels travel cyclonically, they gain energy through surface enthalpy fluxes, causing the boundary-layer θerecover.Therefore, the lowest boundary-layer θeis found in the downshear-left outer core of the strongly sheared TC, and the highest boundary-layer θeappears in the downshear-right outer core.CAPE is, thus, featured by a similar asymmetric pattern in the outer core.
Prior budget analyses demonstrated that the midlevel enhancement of θeon the downshear-left side in the outer core results mainly from asymmetric outflow induced by VWS and the upward advection of water vapor (LD20).From the trajectory perspective, it is also indicated that two types of parcels, one traveling from the inner core and the other associated with convective-scale updrafts in outer rainbands, play a critical role in producing the notable midlevel increases in θein the downshear-left portion of the outer core.Parcels moving from the inner core likely contribute to θeenhancements at smaller radii, while parcels associated with convective-scale updrafts in outer rainbands lead toθeenhancements at larger radii.Further estimation of theθechanges show that in a strongly sheared TC, the principal contribution to the midlevel increase in θein the whole downshear-left outer core is due to parcels responding to the convective-scale updrafts in outer rainbands.This differs from the results of previous studies.In particular, the contribution of these parcels is much more dramatic when the outer rainbands are more vigorous.Comparatively, the contribution from parcels moving from the high-entropy inner core is secondary.In addition, the θeincrease in the mid-tropospheric outer core due to trajectories through the inner core becomes larger in a higher sheared environment mainly because of a larger asymmetric outflow occurring in the downshear-left quadrant at midlevels.
The abovementioned processes, which result in entropy changes along trajectories, indicate the azimuthally asymmetric distribution of moist instability.Larger θevalues in the downshear-right boundary layer represent and signal significant conditional instability in that quadrant, favoring cellular convection initiation and the convective development in the upwind sector of outer rainbands in sheared TCs (Li and Fang, 2018).As the cells become active, convective-scale updrafts thrive in the middle portion of the outer rainbands(Li and Fang, 2018; Barron et al., 2022) and positively contribute to the enhancement of midlevel θe(Tables 1 and 2).In addition, evaporation-induced convective-scale downdrafts associated with the convective cells (Cheng and Li,2020) transport low-entropy air into the boundary layer, resulting in a smaller θeon the left side of the shear.Therefore,potential stability occurs there, as previously discussed.The presence of potential stability is possibly responsible for the convective collapse and the organization of broad stratiform clouds in the outer rainbands, which is worthy of further investigation.Furthermore, the radial migration of low-level low-entropy air induced by downdrafts has been recently defined as low-level ventilation (Riemer et al., 2010, 2013;Alland and Davis, 2022).It is documented that low-level ventilation can play a significant role in the intensification rate of TCs.In short, outer rainband activities can considerably influence the asymmetric characteristics of entropy in the outer core of sheared TCs, and those entropy features are also, in turn, responsible for rainband activities and, ultimately, TC development.
More recently, an increasing number of studies has revealed that different characteristics of VWS (e.g., shear height and depth, shear-relative low-level flow direction,and storm-relative helicity) have pronounced impacts on TC structure and intensity changes (Rappin and Nolan, 2012;Onderlinde and Nolan, 2014, 2016; Finocchio et al., 2016;Chen et al., 2018, 2019; Gu et al., 2018, 2019).In the present study, we only examine the traits of azimuthally asymmetric θe, and hence moist instability in the outer core in differing shear magnitudes.Further investigations are warranted in the future on how VWS height and depth, shear-relative low-level flow direction, and storm-relative helicity can influence the distribution of θewithin a TC circulation.
Acknowledgements.The constructive comments by three anonymous reviewers and the editor are greatly appreciated and are valuable in improving the manuscript.We would like to thank Dr.Chau-Lam YU for sharing the code to calculate the divergent and rotational winds and Dr.William MILLER for sharing the trajectory model.This work was jointly supported by the National Key Research and Development Program of China under Grant No.2017YFC1501601 and the National Natural Science Foundation of China under Grant Nos.42175005 and 41875054.The numerical simulations and trajectory analyses were conducted in the High-Performance Computing Center of Nanjing University of Information Science and Technology.
杂志排行

Advances in Atmospheric Sciences的其它文章
- Mongolia Contributed More than 42% of the Dust Concentrations in Northern China in March and April 2023
- Super Typhoon Hinnamnor (2022) with a Record-Breaking Lifespan over the Western North Pacific
- Rainfall Monitoring Using a Microwave Links Network:A Long-Term Experiment in East China
- Recent Enhancement in Co-Variability of the Western North Pacific Summer Monsoon and the Equatorial Zonal Wind
- Interdecadal Variations of the March Atmospheric Heat Source over the Southeast Asian Low-Latitude Highlands
- Linkage of the Decadal Variability of Extreme Summer Heat in North China with the IPOD since 1981