Drivers of evapotranspiration increase in the Baiyangdian Catchment*
2023-04-22ChristineMushimiyimanaLIULinlinYANGYonghuiLIHuilongWANGLinnaSHENGZhupingAugusteCesarItangishaka
Christine Mushimiyimana,LIU Linlin,YANG Yonghui**,LI Huilong,WANG Linna,SHENG Zhuping,Auguste Cesar Itangishaka
(1.Center for Agricultural Resources Research,Institute of Genetics and Developmental Biology,Chinese Academy of Sciences / Key Laboratory of Agricultural Water Resources,Chinese Academy of Sciences / Hebei Key Laboratory of Water-saving Agriculture,Shijiazhuang 050022,China; 2.University of Chinese Academy of Sciences,Beijing 100049,China; 3.Texas A & M AgriLife Research Center,El Paso,Texas 79927,USA)
Abstract: The Baiyangdian Catchment is facing a growing shortage of water resources.Identifying the sensitive drivers of evapotranspiration (ET) changes from land and crop management will be critical to understanding the reasons for mountainous runoff reduction and depletion of groundwater resources in the plain.It will also be important for making Xiong’an become a Future Example City for green and sustainable development.In this study,remotely sensed ET data from PML V2 products with a spatial resolution of 500 m was used to analyze the trend of ET at the pixel level and to understand its influence on vegetation such as GPP (Gross Primary Production) and NDVI (Normalized Difference Vegetation Index) under different land-use types for 2002–2018.Results showed that there was a significant increase in ET in mountain regions and a slight increase in plain regions of the catchment.The spatial pattern of mean annual ET was very much relevant to the changing trend of GPP and NDVI.For the whole catchment,the average increases of ET,GPP,and NDVI were respectively 2.4 mm·a-1,9.8 g·cm-2·a-1,and 0.0021 at an annual rate.In the mountainous region,changes in annual precipitation and vegetation recovery together caused a total increase of ET by 56.5 mm over the period and negatively affected the runoff.In the plain region,there were 3 factors influencing the change of ET.While intensification of urbanization and reduction in the cultivation of wheat,the water consumptive crop,had both resulted in the decrease of ET and water consumption,ET or water consumption in most irrigated fields increased.Since the beneficial effects from urbanization and crop adjustment were not enough to offset the increase of ET in irrigated fields,an overall ET increase of 6.4 mm over the period was found.In conclusion,both in the mountainous and plain regions,ET increased.And therefore,more efforts are needed to control the ET increase in natural vegetation and cropland for a green and sustainable catchment.
Keywords: Evapotranspiration; Vegetation change; Urbanization; Winter wheat; Irrigated land; Baiyangdian Catchment
Evapotranspiration (ET) is the main element of the hydrologic cycle responsible for distributing energy,water,and carbon cycles in a terrestrial ecosystem (Jung et al.,2010; Wegehenkel et al.,2005).It is the secondlargest part of the water cycle after precipitation (Rodell et al.,2015; Trenberth et al.,2007).Globally,more than two-thirds of global terrestrial precipitation is returned into the atmosphere via ET (Oki and Kanae,2006).In water-limited basins where agriculture,environment,and social economy compete for water,the ratio of water lost through ET can be considerably high (Li et al.,2016).ET varies with the properties of the land surface,vegetation,and topography (e.g.,slope and aspect) and directly affects region and catchment water availability (Sun et al.,2018; Zhou et al.,2015).Globally,the hydrological cycle is modified by changing climate and human activities(Oki and Kanae,2006; Sherwood and Fu,2014).Therefore,there is an urgent need to determine the effects of land-use change and vegetation on ET.
Recent developments in remote sensing technology make it possible to detect where and when ET changes across the globe (Ai et al.,2020; Anderson et al.,2012;Pascolini-Campbell et al.,2021) and at the regional level(Yang et al.,2014).For instance,it is noted that change in vegetation is the main driver of ET change and hydrology.Zeng et al.(2018) analyzed multiple global ET products and noted that significant increase in ET.More than 50% of the increase in global terrestrial ET was driven by the greening of the earth.Chen et al.(2019)observed that one-third of global greening was due to reforestation and agricultural activities in China and India.In China,forest cover has increased from 12.0% in 1980 to 22.9% in 2018 (China Forest and Grassland Statistical Year Book,2019).Such a large increase could have heavily influenced the local hydrological cycle.Li et al.(2020) reported that due to vegetation recovery,total ET in North China increased at 13 km3·a-1.Jiang et al.(2020)studied the driving factors of ET in the Yellow River Basin using the improved Shuttle Worth-Wallace model and noted that NDVI (Normalized Difference Vegetation Index) had the greatest impact on ET.
Globally,80% of the world population is threatened by severe water security (Vörösmarty et al.,2010).Yang et al.(2021) studied runoff change in 11 067 rivers and 5172 human-impacted rivers and found that 62% of the runoff in human-influenced catchments was non-stationary.Aside from climate change,which can be simulated by hydrological models (Mueller et al.,2011; Sun et al.,2013; Yang et al.,2013),detecting the driving forces of hydrological changes from human activity has remained challenging (Allen et al.,2011; Anderson et al.,2012).Remote sensing is becoming increasingly promising in detecting a human effect (especially as land-use changes)on ET (Feng et al.,2016; Li et al.,2017).Thus,remote sensing can be used to analyze spatial and temporal changes in ET to deepen the existing understanding of human influences.
In 2017,Xiong’an was selected as a Model Future City for sustainable and green development.However,there is a severe water shortage in the Baiyangdian Lake and its upstream Baiyangdian Catchment.In the 1950s and 1960s,the Baiyangdian Lake was the largest freshwater lake in the Haihe Catchment and always had the problem of floodwater control.Persistent human intervention,especially in recent decades,has led to a drastic shrink in runoff from the upstream mountain region and groundwater depletion in the plains (Hu et al.,2012;Moiwo et al.,2010).Since the 1990s,the lake has heavily relied on over 2 km3of external water delivery from the Yellow River and recently from the South-to-North Water Transfer Project from the Yangtze River.Currently,it is still unclear as to what extent of each human intervention has influenced the increase of ET and feedback on the water resources.Thus,the objective of the paper was to clarify the drivers of ET increase from agricultural irrigation,vegetation recovery,and other land use influence.
1 Materials and Methods
1.1 Study area
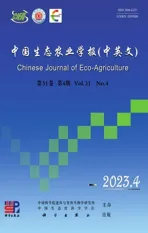
The Baiyangdian Catchment is in the up- and middle-reaches of Daqing River Catchment in the Haihe River Basin.It has a total drainage area of 3.12 × 10⁴km2with a mainly mountainous region in the upstream or the west part and a plain area in the east part for agricultural production and dense residential cities (Fig.1a).
Agriculture is the major user of water resources in the catchment.In the plain regions,two main crops,winter wheat and summer maize are planted in an annual rotation,while winter wheat grows from October to May and summer corn from June to September.In the mountainous regions,grassland and artificial forest are distributed.In the valley,irrigation land is developed mainly for the growth of maize (see land use distribution in Fig.1b).Influenced by the East Asia monsoon climate,July and August have the highest precipitation and ET.
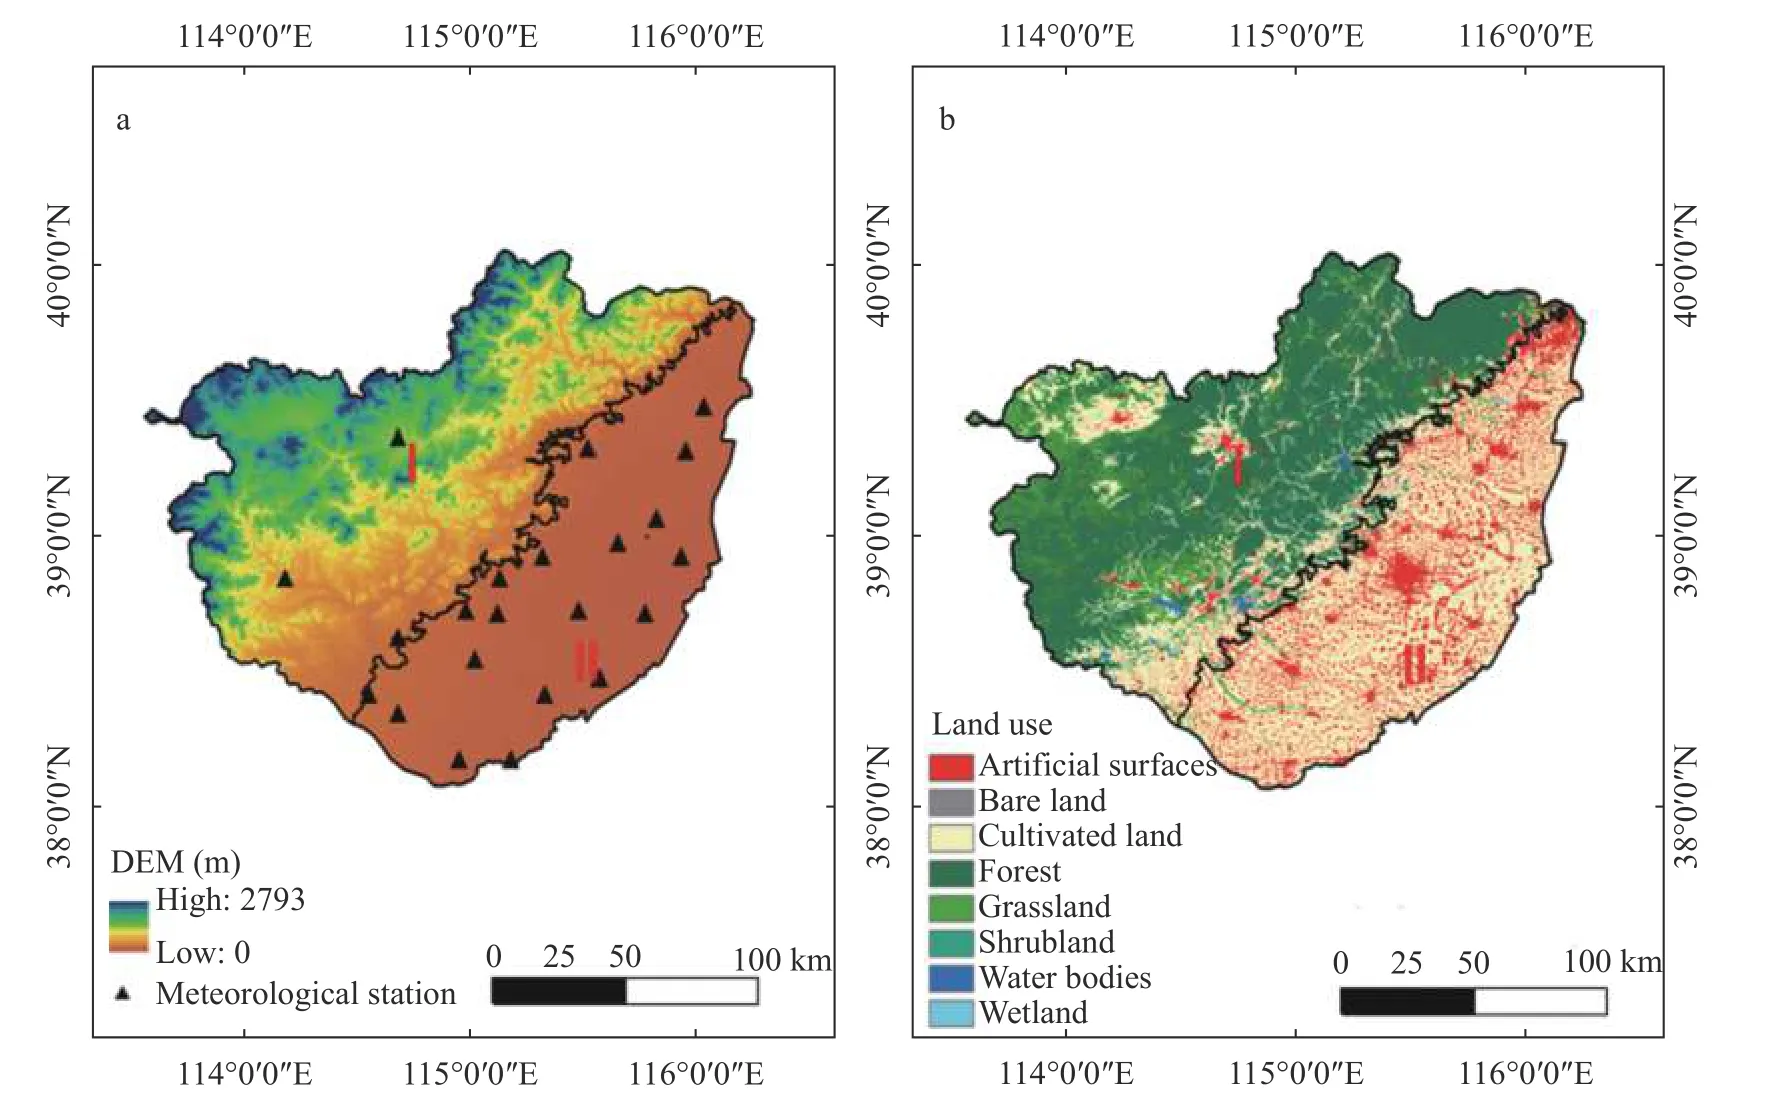
Fig.1 Location of the Baiyangdian Catchment [ a: map of elevation with meteorological stations; b: map of land use types in 2020; the map is separated into the mountain region (Region Ⅰ) and plain region (Region Ⅱ) by the elevation of 100 m asl]
1.2 Data sources
Even though ET data are increasingly being available,Anderson et al.(2012),by comparing MODIS ET(1 km resolution) with Landsat ET (100 m resolution),found that high spatial resolution products were preferable for water resources assessment.Recently,several studies (Gan et al.,2018; Zhang et al.,2019) highlighted the advantages of PML V2 ET product with the spatial resolution of 500 m for accurate trend analysis.Thus,the PMLV2 ET and GPP (Gross Primary Production) data for 2002—2018 at 500 m spatial resolution at an eight-day interval from the Google Earth Engine was used for this study (Zhang et al.,2019).
The primary goal of the PM-based framework is to get an accurate estimate of surface conductance (Gs),which defines soil-canopy water flux.The biophysical model forGswas developed by Leuning et al.(2008) and Zhang et al.(2010) to account for canopy physiological processes and soil evaporation (PML V1 or version 1).Then,Gan et al.(2018) coupled vegetation transpiration with GPP using the biophysical canopy conductance (Gc)model called PML-V2.PML-V2 ET is estimated as the sum of evaporation from soil (Es),transpiration from plant canopy (Et),and evaporation of intercepted precipitation by vegetation (Ei).PML-V2 GPP has subsequently become to be known as GPP.PML-V2 is wellcalibrated using 8-day measurements at 95 widely distributed flux towers for 10 plant function types (Gan et al.,2018).
Remote sensing NDVI at annual and monthly scales at a spatial resolution of 1.0 km derived from the Moderate Resolution Imaging Spectroradiometer (MODIS) data was obtained for 2002-2018 (https://www.resdc.cn/).The NDVI data was then resampled to a spatial resolution of 500 m to match the resolution of ET data.
Land use data,with a spatial resolution of 30 m ×30 m for 2020,was obtained from the website of http://www.globallandcover.com.
Precipitation data (2002—2018) from 21 meteorological stations of the Baiyangdian Catchment was obtained from the China Meteorological Data Service Center (http://data.cma.cn/).
1.3 Data analysis
Considering the fact that the land use types are so different,the whole analysis for the study was separated into the mountainous region (as Region Ⅰ) and plain region (as Region Ⅱ),and the catchment as a whole (as BYD).The test for trend and significance of trend was done at pixel level and at annual level for the Regions ofⅠ,Ⅱ,and BYD.
Linear regression was used to detect the trend of ET,NDVI,and GPP at pixel level.It is determined from the slope of the least-square regression line (Ai et al.,2020):
whereViis the value of the variable (ET,GPP,NDVI,) in theithyear,andnis the length of time series which is 2002—2018.
In general,a slope > 0 implies an increased trend andvice versa.
The Mann-Kendall (MK) statistical test was used to test the significance of the trend atP≤0.05 (Kendall,1975; Mann,1945).
2 Results
2.1 General distribution of ET,GPP,and NDVI in the catchment
Fig.2 shows the spatial distribution of average annual ET,GPP,and NDVI for 2002-2018 for RegionsⅠandⅡin the Baiyangdian Catchment.In general,ET is high in the plains,especially in irrigated croplands,and low in the mountains.The mean ET values were 516.9 mm,575.8 mm,and 541.2 mm respectively for the mountains (RegionⅠ),plains (RegionⅡ),and the whole catchment region (BYD).By contrast,the average annual precipitation were 523.7 mm,498.9 mm,and 508.8 mm,respectively,for RegionⅠ,Ⅱ,and BYD(Fig.3).
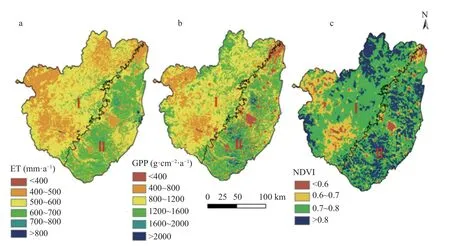
Fig.2 Spatial distribution of annual average evapotranspiration (ET,a),gross primary production (GPP,b),and normalized difference vegetation index (NDVI,c) for the period of 2002–2018 in the Baiyangdian Catchment
Spatially,ET,GPP,and NDVI show pretty much the same distribution.For instance,in the irrigated cropland (RegionⅡ),ET,GPP,and NDVI all have the highest value.On the other hand,in the mountainous region and urban,the low-value zones of ET,GPP,and NDVI are the same.Both in the mountainous region and the plain,water bodies,rivers and wetlands are found to have the highest ET value.
2.2 Comparison on the temporal trend of ET and precipitation
Fig.3 shows the comparison between ET and precipitation for RegionⅠ,RegionⅡ,and BYD for 2002–2018.Precipitation heavily influenced annual variations of ET,both in the mountainous (Ⅰ) and plain regions (Ⅱ).For example,in the wet years of 2008 and dry years like 2005 and 2006,ET followed the trend of annual precipitation change.Driven by groundwater irrigation,aside from 4 rich precipitation years such as 2008,2012,2013,and 2016,ET in the plain area was higher than precipitation.In contrast,in most years,ET in the mountainous or headwater region was lower than annual precipitation,suggesting the water recharging service from the mountains.
MK test and correlations also suggest the significant influence of precipitation on ET in the mountains of the catchment (P≤0.05).However,there was no significant correlation between ET and precipitation for the plain and the whole catchment (BYD) (Fig.3).
Fig.3 Variation and trend in annual evapotranspiration (ET) and precipitation (P) in mountain areas (Ⅰ),plain areas (Ⅱ),and the whole catchment (BYD)
For the 17-years period,the mean annual ET increased by 56.5 mm,6.4 mm,and 38.1 mm respectively for the mountain region,plain region,and the whole catchment.This suggested an overall increase in ET demand.
2.3 Temporal trend of GPP and NDVI
Fig.4 shows the trend and significance of GPP and NDVI for 2002–2018.Similar to ET,both GPP and NDVI show significant increasing trends in mountain areas (P<0.05),but not for the plain area and the whole catchment.In the plain area,even a decreasing trend of NDVI was found since 2008 possibly driven by the urbanization (Fig.4b).In the whole catchment,the annual NDVI increased marginally by 6.9%.

Fig.4 Trend and significance of Gross Primary Production (GPP) (a) and Normalized Difference Vegetation Index (NDVI,b) in mountainous areas (Ⅰ),plain areas (Ⅱ),and the whole catchment (BYD) from 2002 to 2018
2.4 Spatial distribution and temporal trends of ET,GPP,and NDVI
Fig.5 shows the distribution of trends of ET,GPP,and NDVI for 2002–2018.Overall,ET had noticeable increasing trends,which were significant(3.53 mm·a-1) for the mountain area (Ⅰ),slight but not significant (0.4 mm·a-1) for the plain area (Ⅱ),and medium increase (2.4 mm·a-1) for the whole catchment.Such increases were mainly contributed from ET increases in the mountain area (Fig.5 and Fig.3).
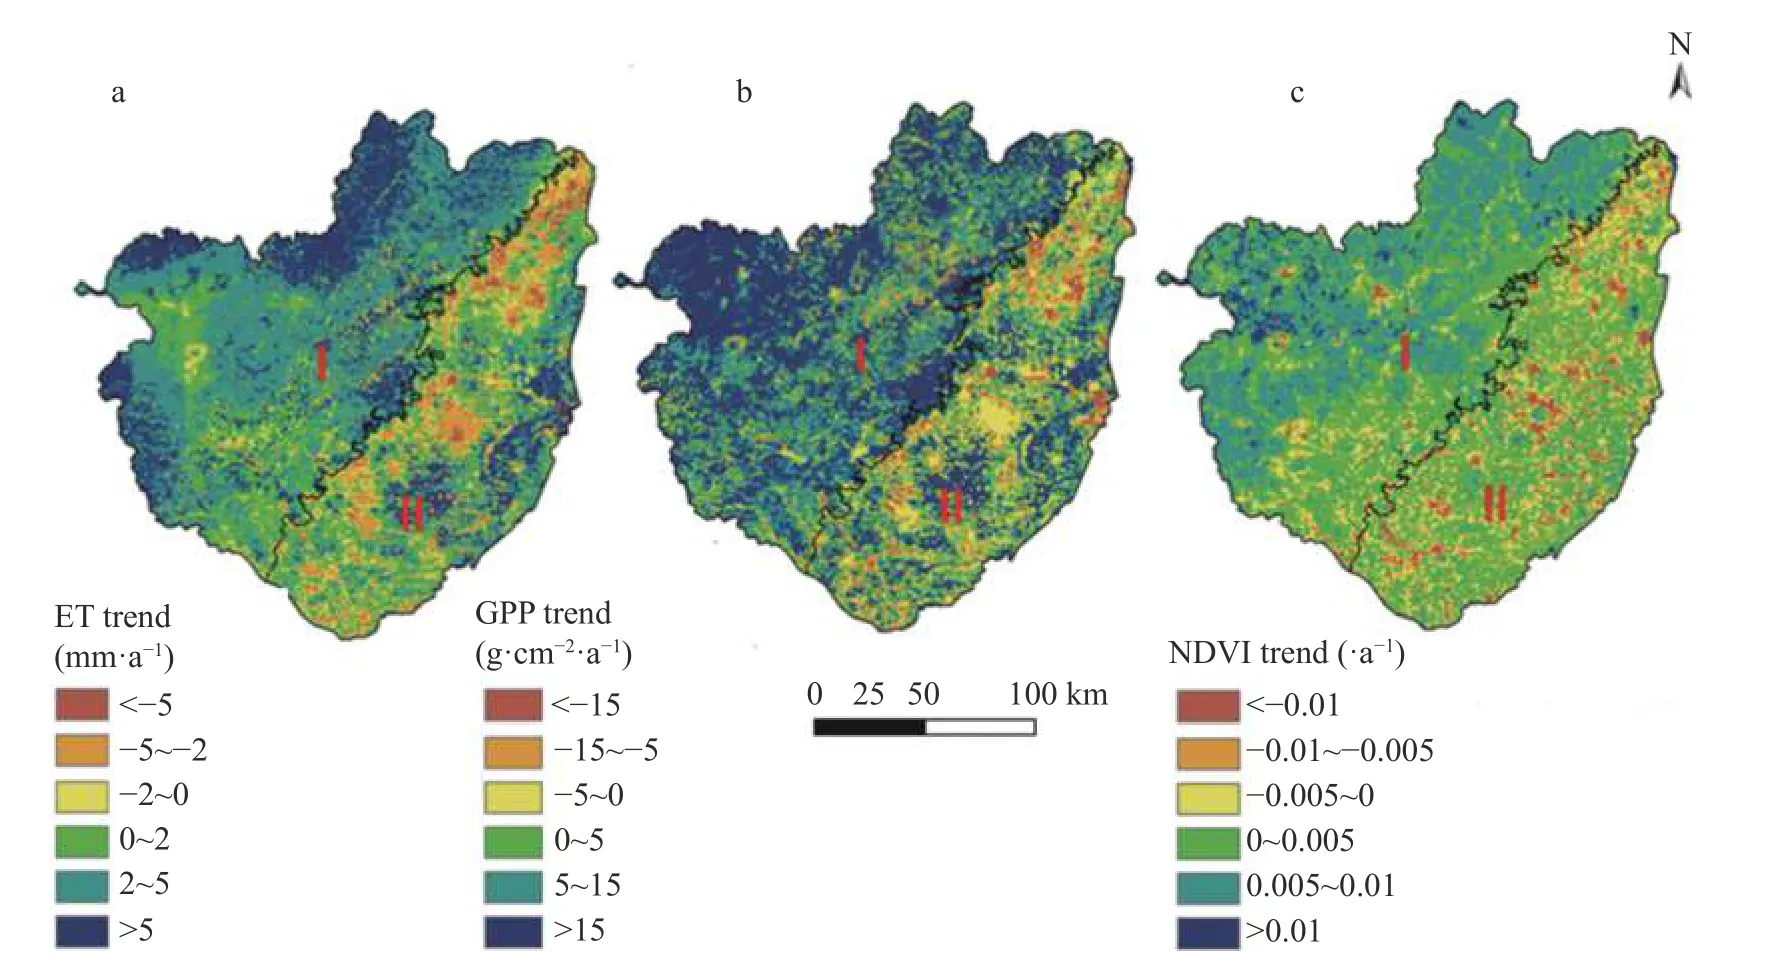
Fig.5 Temporal trends in evapotranspiration (ET,a),gross primary production (GPP,b),and normalized difference vegetation index (NDVI,c) in Baiyangdian Catchment for the period 2002–2018
Spatially,the distribution of temporal trends in GPP and NDVI were very similar to that of ET.Most of the decreasing zones in ET,GPP,and NDVI took place in urbanized areas.In the valleys of the mountainous region,decreasing areas of ET,GPP,and NDVI were also observable possibly caused the conversion from arable land to forest or grassland.
2.5 Temporal trends in monthly ET,GPP,and NDVI
Fig.6 shows the temporal trends of monthly ET,GPP,and NDVI and the comparisons among the mountainous region,plain region,and the whole catchment.For the mountain region (Ⅰ),there was a good agreement between ET,GPP,and NDVI for nearly all the growing seasons.The only exception was for the cold season (October to mid-March) when ET,GPP,and NDVI were very low and natural vegetation withered.It suggested that the recovery or greening of natural vegetation was responsible for the increase of ET in the mountainous areas.
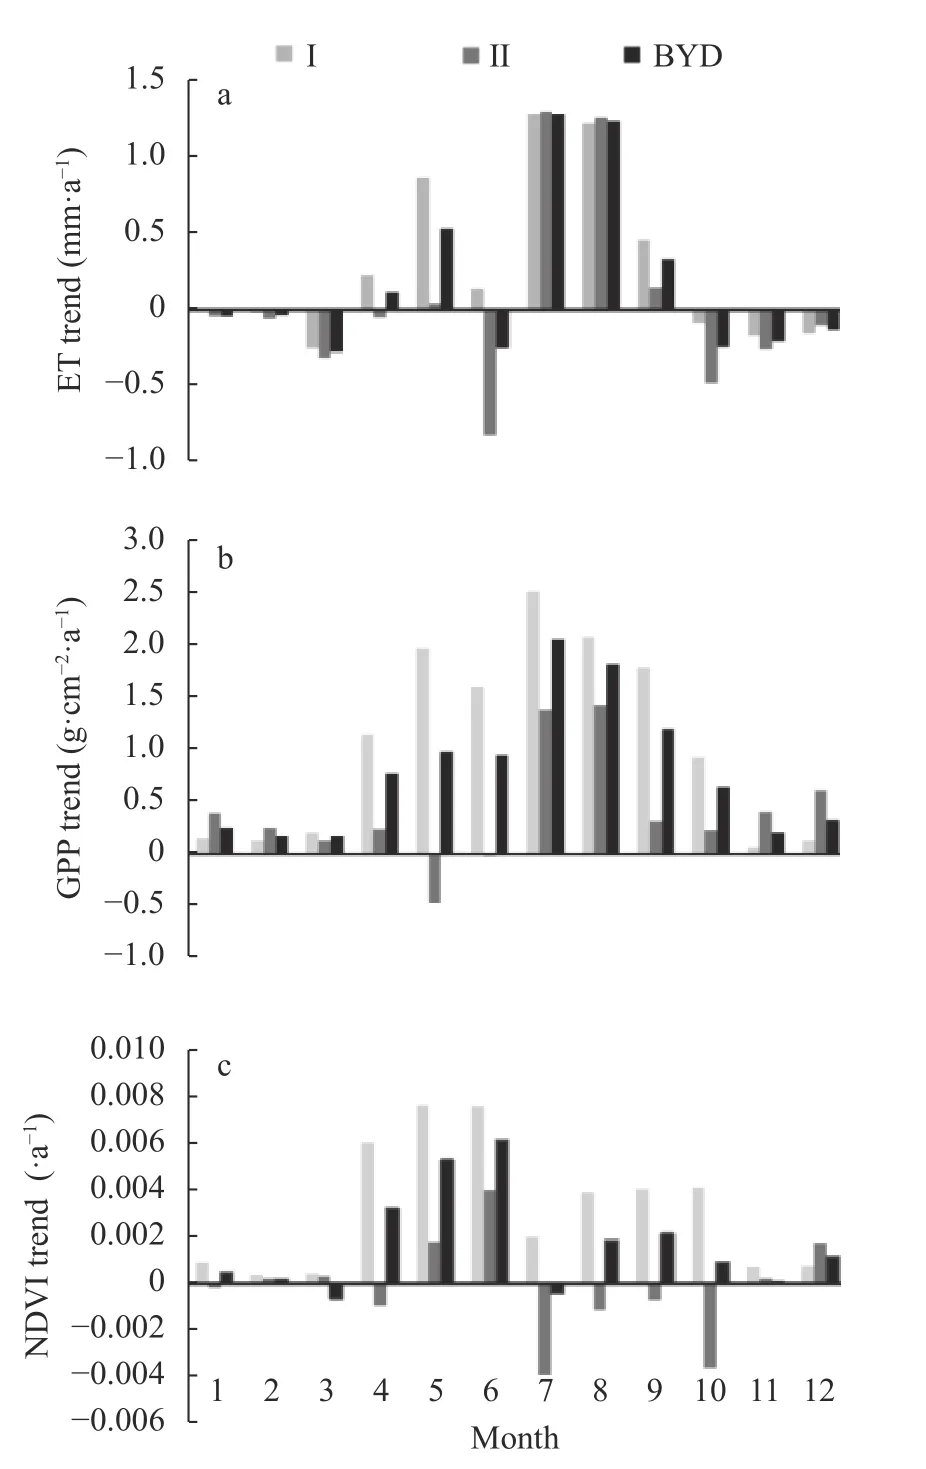
Fig.6 Temporal trends in monthly evapotranspiration(ET,a),gross primary production (GPP,b),and normalized difference vegetation index (NDVI,c) in the mountain region (Ⅰ),plain region (Ⅱ),and the whole catchment (BYD) for the period 2002–2018
In the plain area (Ⅱ),the trends in ET,GPP,and NDVI were a little complicated.Aside from the strong urbanization effect (Fig.5),there could be other influencing factors.For instance,there was a general agreement between the decrease in ET and NDVI; especially from October to May which was the winter wheat growing season.In the summer or maize growing season from June to September,ET and GPP increase but not NDVI.
2.6 ET response to vegetation and land-use
Our results showed an increase in ET followed by a stable increase in NDVI,both at the catchment level and for the mountain region during 2002–2018.There was still a need to more clearly determine the main drivers of change in ET.
Analysis of precipitation data for 2002–2018 showed that on average,precipitation for the early 5 years (464.7 mm in 2002–2006) was quite similar to that for the late 5 years (472.2 mm in 2014–2018).This provided a valuable time to observe the influence of NDVI changes (NDVI2014–2018minus NDVI2002–2006) on the change of ET at pixel-level under similar precipitation conditions.Fig.7 shows the correspondence of NDVI changes to the changes of ET for the mountains area(Fig.7a) and for the urban area (Fig.7b) and cropland(Fig.7c) in the plain region between the two periods.
For the mountain area,both ET and NDVI increased in most pixels in the late 5 years with average increase of 50.1 mm·a-1in ET and 0.04 in NDVI.This could be explained by the lunch of afforestation program in the Taihang Mountain since 1986 and returning of agricultural land to the forest at the end of the 1990s.This policy has largely increased forest cover from 13.1% at the start of 1980 to the current value of 26.8% in the Taihang Mountain,where our study area is located.The vegetation recovery was at least one of the major drivers of the increase in ET.
Given the large difference in ET between cropland and urban area in the plain region,the urban area was separated from cropland for further analysis.In Fig.7b,ET in more urban pixels shifts to the negative value in correspondence to the development of urbanization and decline of NDVI.Although there were seemingly more pixels with a positive trend of ET and NDVI in cropland,there was still a large amount of pixels with declining ET and NDVI as in Fig.5.In some cropland areas,especially on the north side of the plain near Beijing and cropland near the mountains,ET and NDVI decreased.This was likely driven by the government policy on reducing the cultivation of high water-consuming crops like wheat.
2.7 ET response to the reduction of wheat plantation
In the plain area,two staple crops are heavily cultivated.While summer maize is planted in the rainy season from June to September with less irrigation,winter wheat is grown in the dry season from October to early June and relies heavily on groundwater irrigation.Crop adjustment is one of the policies the governments use to reduce the unsustainable use of groundwater since 2014.
As shown in Fig.8,ET in maize and wheat season in the plain without urban pixels performs very differently.While ET in maize growing season generally increased for most of the pixels,it was totally different in wheat season.The area with increasing ET was mostly on the east side of the plain.On average,ET for winter wheat decreased by –1.03 mm·a-1,while ET for summer maize increased by 2.5 mm·a-1.On average,ET in the plains increased slowly driven by the decrease of ET during the wheat growing season.
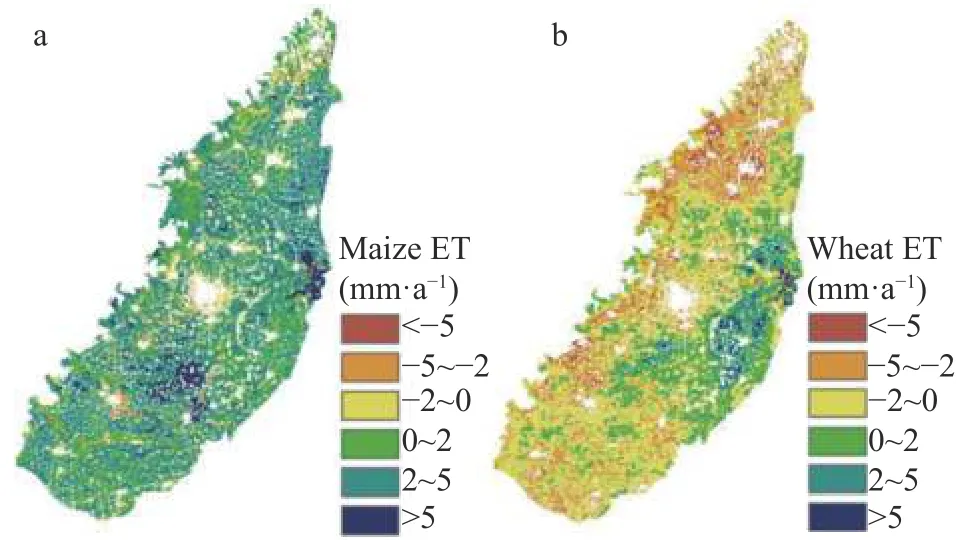
Fig.8 Spatial distributions of evapotranspiration (ET trend) changes for summer maize season from June to September (a) and winter wheat growing season from October to May (b) in the plain region for the period 2002–2018
3 Discussions
3.1 Drivers of ET change
Remote sensed ET is increasingly becoming a useful tool to detect the effect of natural and human influence on the water cycle and water resources (Anderson et al.,2012).Our study confirmed several drivers influencing the changes of ET in the mountainous and plain regions of the Baiyangdian Catchment.
One critical driver is the negative effect of vegetation recovery in the mountains.There is a significant visible increase in ET at an annual rate of 3.54 mm·a-1(Fig.3) or 56.5 mm from 2002-2018.Such trend was similar to recent studies on the effect of greening on ET increase.For instance,Feng et al.(2016) in the Loess Plateau found that new planting has caused both net primary productivity (NPP) and ET to increase and result in a decrease in the runoff.Considering the fact that the annual runoff in the Tanghe Catchment,one of major rivers in the mountainous region,varies from 13.5-225.0 mm with an average of 63.1 mm from 1960-2002 (Hu et al.,2009),56.5 mm of change in ET for the study period in the Baiyangdian Catchment was huge.Bai (2017)studied runoff change in three sub-catchments,Fuping,Daomaguan,and Zijingguan,at the upstream of the Baiyangdian Catchment and found that runoff decreased from 839 million m3in the 1990s to 425 million m3in 2000-2015,which is equivalent to 34.5 mm of runoff decrease.The runoff decrease of 34.5 mm in 2000-2015 is already very close to 56.5 mm of ET increase.Besides,from Fig.3,variation of annual precipitation is another factor significantly influencing the annual variation of ET,although it is still not enough to conclude to how much extent the ET increase is driven by precipitation and vegetation recovery separately.
In the plain region,there are three factors influencing the trend of ET.Firstly,urbanization is good for the decrease of ET.As much land is shifted to a concreted surface,it is easy to understand that less available water for evaporation causes the decrease of ET.Secondly,from Fig.8,not like the maize growing season,ET in the winter wheat growing season decreased (Fig.8).It suggested that the government’s effort to reduce high groundwater use in winter wheat since 2014 was making effect.The above two factors are beneficial for controlling groundwater depletion in the plain.However,even though the two factors were causing the decrease in ET,cropland irrigation still caused ET increase in the whole plain.In other words,the two beneficial factors are not enough to offset the ET increase from irrigation.A stabilization of ET in the plain is still not achieved.A previous study by Gao et al.(2017) and Chi et al.(2022)also showed that even after the implementation of ecological water recharge from South-to-North Water Transfer projects,groundwater levels in the plain continuously declined caused by over-exploitation of groundwater.This is another example of the “irrigation paradox”(Grafton et al.,2018),which means that agricultural water saving at the field level can hardly solve water shortage in the basin or catchment level.The visible increase in GPP in the plain area also suggests that an increase in ET is beneficial for the increase of crop yield.For instance,Ai et al.(2020) investigated the global trend of ET,GPP,and water use efficiency (WUE) and found the increase of ET,GPP,and WUE in the North China Plain or more water for a higher crop yield.
3.2 ET as an indicator for catchment hydrology and the reliability
While our results suggested that different drivers were responsible for the hydrological change in the mountain and plain regions,ET insignificantly increased at an annual rate of 2.4 mm·a-1or 38.4 mm,mainly contributed from the upstream mountainous region.Even though ET increase in the plain is limited,as there is less and less runoff available for the plain and Baiyangdian Lake,groundwater depletion is likely to accelerate (Moiwo et al.2010; Hu et al.2012).For instance,even with only 1 billion m3of water from South-to-North Water Transfer Projects between 2014 and 2018 (Sohu News,2019),Wang (2020) simulated that around 489 million m3of groundwater was over-drafted per year in 2015–2017.And during 2006–2011,over 0.51 billion m3of water was delivered from the Yellow River to the Baiyangdian Lake (Wang et al.,2018).And after the lunch of the Xiong’an New Area,much water has been delivered to Xiong’an City and Baiyangdian Lake.Considering the catchment area is around 31 200 km2,34.5 mm of overuse of water equals around 1.07 km3of water shortages each year in the catchment.It cannot be conclusively stated that the 1.07 km3water deficit was the precise value of water shortage in the catchment,since both ET value from PML-V2 (Fisher et al.,2017;Pascolini-Campbell et al.,2021) and precipitation from limited stations especially in the mountains are not accurate enough for a precise evaluation of water shortage.