Low-temperatures synthesis of CuS nanospheres as cathode material for magnesium second batteries
2023-03-24QinZhngYoboHuJunWngFushengPn
Qin Zhng ,Yobo Hu,b,∗ ,Jun Wng ,Fusheng Pn,b
a College of Materials Science and Engineering,Chongqing University,Chongqing 400044,China
b National Engineering Research Center for Magnesium Alloys,Chongqing 400044,China
Abstract Rechargeable magnesium batteries (RMBs),as one of the most promising candidates for efficien energy storage devices with high energy,power density and high safety,have attracted increasing attention.However,searching for suitable cathode materials with fast diffusion kinetics and exploring their magnesium storage mechanisms remains a great challenge.CuS submicron spheres,made by a facile low-temperature synthesis strategy,were applied as the high-performance cathode for RMBs in this work,which can deliver a high specifi capacity of 396 mAh g−1 at 20 mA g−1 and a remarkable rate capacity of 250 mAh g−1 at 1000 mA g−1.The excellent rate performance can be assigned to the nano needle-like particles on the surface of CuS submicron spheres,which can facilitate the diffusion kinetics of Mg2+.Further storage mechanism investigations illustrate that the CuS cathodes experience a two-step conversion reaction controlled by diffusion during the electrochemical reaction process.This work could make a contribution to the study of the enhancement of diffusion kinetics of Mg2+and the reaction mechanism of RMBs.
Keywords: Magnesium second batteries;Cathode material;CuS;Submicron spheres;Low-temperature synthesis.
1.Introduction
Overconsumption of traditional energy such as oil and gas led to excessive environmental issues and imminent energy crisis.Therefore,environmentally friendly,grid-scale and efficien energy storage devices are urgently demanded for sustainable development [1–3].Lithium-ion batteries (LIBs),one of the most advanced energy storage devices for portable electronics and electric vehicles,were still unable to meet the currently ever-increasing demand for high energy density for the challenges of lithium-resource depletion and lithium dendrite propagation [4–6].In recent years,rechargeable magnesium batteries (RMBs) have drawn an increasing attention as a potential candidate due to the higher theoretical volumetric capacity (3833 mAh cm−3),greater gravimetric capacity (2205 mAh g−1),suitably low redox potential (−2.36 V vs.SHE),higher safety and lower cost of metallic Mg anode [7–12].Nevertheless,developing high energy density RMBs with excellent rate capacity and outstanding cycle stability are challenging for the lack of suitable cathode materials [6,13,14].
Copper sulfid is one of the most typical transition metal sulfide (TMSs) and copper sulfur compounds.Untill now,different structural CuS,such as particles [15],microspheres [16,17],nanotubes [18],nanocubes [19],nanosheets[20,21],nanorods [22],nanowries [23,24] and microfl werlike [25] have been widely prepared to be electrode materials for LIBs and sodium ion batteries (SIBs).For some attractive advantages of abundant resources,low cost,desirable theoretical specifi capacity (560 mAh g−1) and superior electronic conductivity (103S cm−1),CuS has recently aroused extensive attention and research for cathode of RMBs [22,25–28].However,a series of unsatisfactory electrochemical performance such as rate capability,specifi capacity and cycling stability still hinder the further development of CuS cathode materials for RMBs.One feasible strategy for improving the electrochemical performance of CuS at room temperature is to reduce the size of particles,which can shorten the diffusion path of Mg2+and increase the contact area between the cathode material and the electrolyte [29–37].Therefore,the diffusion kinetics of Mg2+can be improved significantl[36,38,39].On the other hand,as a traditional conversion-type material,the magnesium storage mechanism of CuS is highly related to the diffusion kinetics of Mg2+.However,the direct low-temperature synthesis of CuS and elucidation of its electrochemical mechanism are rarely reported.
Herein,an efficien low-temperature synthesis method to prepare CuS submicron spheres with a diameter about 250–300 nm was reported in this work.It is concluded that the CuS submicron spheres as cathode for RMBs can deliver a capacity of 396 mAh g−1at 20 mA g−1and a remarkable rate capacity of 250 mAh g−1at 1000 mA g−1.Such excellent rate performance could be attributed to the nano needle-like particles on the surface of CuS submicron spheres,which can facilitate the conversion reaction of CuS with Mg2+and improve the reversibility of electrochemical reaction.Moreover,the possible storage mechanism of CuS cathode is further investigated by CV and a series of ex-situ characterization techniques.In conclusion,the electrochemical results suggest that reducing the size of material is a potential strategy for the exploration of high rate cathode materials for RMBs and the conversion reaction mechanism demonstrated in this work can also contribute to the reaction mechanism of RMBs.
2.Experimental methods
2.1.Material preparation
CuS submicron spheres were fabricated using a facile low-temperature synthesis strategy.Typically,4.84 g Cu(NO3)2·3H2O and 3.16 g Na2S2O3were dissolved in 200 mL of ethylene glycol via vigorous stirring at room temperature for 20 min,and followed at 70 °C for 3 h.After naturally cooling down to room temperature,the sample was collected by high-speed centrifugation and washed with deionized water and absolute ethanol for 8 times alternately.Finally,the black product was obtained by drying at 60 °C for 24 h.
2.2.Microstructural characterizations
Structural characterization of CuS was performed by X-ray diffraction (XRD) with Cu Kαradiation (PANalytical X’ Pert Powder).The valence information of elements was obtained by X-ray photoelectron spectroscopy(XPS,ESCALAB250Xi)and the C 1s located with the binding energy of 284.4 eV was used as the standard.The specifi surface and pore size of CuS were detected through Nitrogen adsorption-desorption measurements (Quadrasorb 2MP) at 77 K.The morphologies of CuS were observed by field-emissio scanning electron microscopy (FE-SEM,JEOL JSM-7800F) and transmission electron microscopy (TEM,Talos F200S).Energy dispersive spectrometer (EDS) elemental mappings were also conducted with Talos F200S microscopy.
2.3.Electrochemical measurements
The electrochemical performance of the as-prepared samples was evaluated in a two-electrode configuration The cathode slurry was prepared by mixing the active material (70 wt%),Super P (20 wt%),and the polyvinylidene fluorid binder (10 wt%) in a solvent of N-methyl pyrrolidone.After stirring for more than 12 h,the slurry with moderate viscosity was coated onto current collector of carbon paper and dried at 80 °C for 12 h under vacuum.The prepared electrode foil was punched into discs with a diameter of 12 mm.The mass loading of the active material within the whole material was about 2 mg cm−2.CR2032 coin cells were used to test the electrochemical properties applying the above-prepared cathode,APC electrolyte,a glass microfibe fil (Whatman,GF/A) as the separator and high pure Mg foil with a diameter of 14 mm as the anode.All cells were assembled in an argon-fille glove box (H2O,O2<1 ppm).Galvanostatic discharge-charge measurements were conducted in Neware battery test systems at different current densities between 0.01 and 2.0 V (vs Mg/Mg2+).Cyclic voltammetry(CV) measurements were performed on the CHI 660E electrochemical work station (ChenHua Instruments Co,China).Importantly,all current densities and specifi capacities were calculated based on the active material in the CuS working electrode and all the electrochemical tests were performed at room temperature.For ex-situ characterization,the Mg//CuS cell with different electrochemical states was disassembled in an argon-fille glovebox,and then washed with THF and soaked for 5 days.
3.Results and discussion
3.1.Structure and morphology
Fig.1a shows the Rietveld refinemen result of the XRD pattern for CuS.All diffraction peaks are consistent with the hexagonal CuS (JCPDS PDF 01–1281) with the space group of P63/mmc,except for the (222) characteristic peak of S as a result of the slow oxidation of the prepared of CuS.The Rietveld refinemen of this XRD pattern gives a high-quality fi ofχ2=6.724,and the corresponding crystal structure and the cell parameters are shown in Fig.1b.

Fig.1.(a) Rietveld refinemen of the XRD pattern for CuS,(b) crystal structure of CuS.

Fig.2.(a) N2 adsorption-desorption isotherms,(b) XPS survey spectra,(c) Cu 2p and (d) S 2p of CuS.
N2adsorption-desorption isotherms was conducted to characterize the specifi surface area and pore structure of CuS submicron spheres (Fig.2).The results indicated that CuS submicron spheres have a BET surface area of 11.05 m2g−1,and the BJH pore size distribution of around 3.7 and 16.1 nm(Fig.2a).The extremely fin pores of 3.7 nm could be assigned to the interstices between the nano-needles on the surface of the CuS submicron spheres,while the larger pores of 16.1 nm might be derived from the gaps between adjacent CuS submicron spheres.Compared with other sphere-like CuS particles [29,40],CuS submicron spheres synthesized in this work have a lager specifi surface area and abundant pore structure,which can provide more reaction sites for electrochemical reactions and thus improving the electrochemical reaction kinetics.The element composition and valence state distribution of CuS were further confirme by XPS measurement.As shown in Fig.2b for overall XPS spectra,the signals of Cu and S can be easily recognized.In high-resolution Cu 2p spectra shown in Fig.2c,two peaks of Cu 2p1/2and Cu 2p3/2located at 931.2 and 952 eV can illustrate the presence of Cu2+.The S 2p for CuS shown in Fig.2d exhibits a broad envelope,which can be deconvoluted into three spinorbit-splitting doublets.Two peaks at 161.3 and 162.4 eV are ascribed to S 2p3/2and S 2p1/2,respectively.While the other peaks at 163.3 and 168.3 eV can be attributed to nonstoichiometric complexes and the satellite peak,respectively[41,42].
For more detailed information about the morphology and structure characterization of CuS,SEM and TEM images are examined and presented in Fig.3.As shown in Fig.3a and b,the synthesized CuS particles with a diameter of about 250–300 nm are agglomerates of many nano needle-like primary particles.TEM and STEM images (Fig.3c–e) further confir the abundant porous submicron structure of CuS.The corresponding EDS elemental mapping analysis presented in Fig.3f and g shows the homogenous dispersion of Cu and S components in CuS particles.In a HRTEM image (Fig.3h),the interplanar spacing of 0.281 nm is well recognized and indexed to (103) planes of hexagonal phase CuS.The corresponding SAED pattern shown in Fig.3i reveals the concentric diffraction rings,indicating the typically polycrystalline structure of CuS.The marked diffraction rings can be attributed to the (102),(103),(110),(114) and (116) planes of the covellite CuS.

Fig.3.Morphology and structure characterization of CuS: (a and b) SEM images,(c and d) TEM image,(e) STEM image and (f and g) corresponding Cu and S element mapping images,(h) HRTEM image,(i) corresponding SAED pattern.
3.2.Electrochemical performance
To investigate the electrochemical performance of the CuS cathode in a coin-cell configuration CV and discharge/charge tests were conducted.First,CV test was applied to get an insight into the Mg storage behavior of the as-prepared CuS electrode over the voltage window of 0.01–2.0 V at the scan rate of 0.1 mV s−1(Fig.4a).During the firs negative scan,only one reduction peak can be observed at 0.87 V,while two oxidation peaks can be clearly identifie at around 1.87 and 1.95 V in the subsequent positive scan.After the firs cycle,all curves shift slightly towards higher potential and exhibit similar shapes,indicating that the CuS cathode has a good electrochemical reversibility.In the second cycle,the relatively weak reduction peak at 1.43 V may be assigned to the formation of MgxCuS due to the insertion of Mg2+into the CuS lattice [43].In addition,the reduction peak at about 1.0 V could be attributed to the transformation of MgxCuS into Cu2S and MgS,and another peak centered at 0.8 V could be ascribed to the transformation of Cu2S into Cu and MgS[43–45].During the following cycles,two pairs of redox peaks of the CV curves can be assigned to theCu2+↔Cu+andCu+↔Cu0,respectively.
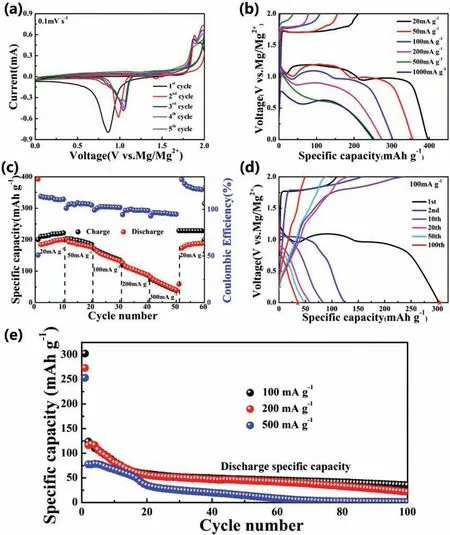
Fig.4.(a) CV curves of the CuS electrode at a scan rate of 0.1 mV s−1.(b and c) The firs discharge-charge profile and rate capacities of CuS cathode at different current densities.(d) Galvanostatic discharge-charge profile for CuS at different cycles at 100 mA g−1.(e) Cycling performance of CuS at different current densities of 100,200 and 500 mA g−1.
As shown in Fig.4b and c,the rate performance of CuS cathode was tested at different current densities.All typically discharge-charge curves at different current densities from 20 to 1000 mA g−1are composed of voltage plateaus and slope regions (Fig.4b).As the current density increases,the shorter voltage platforms are observed,indicating a gradual reduces of the achieved specifi capacity.However,even when the current density increases to 500 and 1000 mA g−1,the as-prepared CuS cathode can still achieve a high discharge specifi capacity of 252 and 250 mAh g−1,demonstrating the excellent diffusion kinetics of Mg2+during electrochemical reactions.Benefitin from the nano needle-like particles,the CuS electrode delivers high reversible specifi capacities of 200,171,126,87 and 40 mAh g−1(Fig.4c) at the current density of 20,50,100,200 and 300 mA g−1,respectively.Remarkably,when the current density decreased back to 20 mA g−1,a higher reversible specifi capacity of 188 mAh g−1can be obtained,suggesting the superior tolerance to various current changes.However,the coulomb efficien y at relatively high current densities is closer to 100% than that at lower current densities,which could be the result of self-discharge phenomenon [46].Furthermore,the cycling performance of CuS cathode at different current densities was shown in Fig.4d and e.All typically discharge-charge curve platforms shown in Fig.4d are corresponding to the redox peaks in the CV curve mentioned in Fig.4a,further proving the multi-step transformation process of the CuS cathode.As shown in Fig.4e,when used as cathode material for RMBs,CuS exhibits rapid capacity fade after firs cycle,which is a common challenge for further improvement for converted sulfide [47].At a current density of 100 mA g−1,the specifi capacity decreased from 124 mAh g−1obtained at the second discharge to 35 mAh g−1obtained at the 100th cycle,which could be ascribed to the Mg2+trapping [48].Such relatively poor cycling performance of the CuS cathode possible due to the occurrence of irreversible side reactions during the electrochemical reaction,and the destruction and re-aggregation of CuS nanospheres during the cycling process [49].

Fig.5.(a) CV curves and the corresponding (b) log (i)-log (v) plot of the CuS cathode at different scan rates.(c) Ex-situ XRD patterns of the CuS cathode at different discharge/charge status.(d) Galvanostatic discharge-charge curves of the CuS electrodes in the firs cycles at 10 mA g−1.
3.3.Reaction mechanism
To analyze the magnesium storage behavior of CuS cathode,the CV tests at different scan rates from 0.5 to 2.0 mV s−1were performed(Fig.5a and b).As shown in Fig.5a,peak 1 and peak 2 are two mainly redox peaks corresponding to the reaction processes of magnesium ions in the CuS cathode.And these processes are dominated by the Faraday reaction and the illegal pull reaction.To identify the different reaction mechanisms of magnesium ions,the relationship between the peak current value(i,A)and the scan rates(v,V s−1)was obtained by the equation:log(i)=blog(v)+log(a)(aandbare adjustable values).If the value ofbis about 0.5,the electrochemical reaction is dominated by diffusion-control.Whereas,the electrochemical reaction process is mainly attributed to the surface-control when the value ofbapproaches to 1.0 [50–52].As shown in Fig.5b,theb-values obtained by linearly fittin the scatter plots are about 0.46 and 0.58 for peak 1 and peak 2,respectively,implying that the storage process of magnesium ion in the CuS cathode is mainly driven by strong diffusion-controlled.
Ex-situ XRD were performed for the CuS cathode at different discharge/charge states (Fig.5c and d) to get further insight into the electrochemical reaction.As shown in Fig.5c,for the fresh CuS electrode (Ⅰ) immersed in electrolyte for 24 h,the marked diffraction peaks at 29.3°,31.7°,32.8°,47.9°,52.7nd 59.3re assigned to the pure CuS phase.After firs discharge to 1.0 V (Ⅱ) at a current density of 20 mA g−1,most of diffraction peaks of CuS disappeared.Meanwhile,new peak at 46.5° for the Cu2S phase is emerged,and the peaks of MgS and Cu can also be recognized.With further discharge to 0.01 V (Ⅲ),peaks of CuS almost disappeared.It can be concluded that the CuS reduced to copper species with a lower valence during the firs discharge process and thus produced a discharge specifi capacity of 396 mAh g−1(Fig.5d),which was much lower than the theoretical specifi capacity of 560 mAh g−1.This is mainly caused by the incomplete transition of Cu2S,as evidenced by the maintained Cu2S peak after the firs discharge.After completely charged to 2.0 V (Ⅳ) in the firs cycle,the diffraction peaks of CuS with slightly weak intensity appear again,and the peaks of Cu2S sharpen largely.However,the peak of MgS is still maintained,indicating that metallic Cu and MgS had only partially converted back to Cu2S and CuS,which is in good accordance with the lower charging specifi capacity of 211 mAh g−1(Fig.5d)during the initial cycle.The XRD pattern of discharging(Ⅴ)and charging(Ⅵ)states after the tenth cycle are basically similar to that after the firs cycle,with a little difference that the peak of MgS slightly sharpened,demonstrating that the conversion reaction is more complete as the cycle progresses.

Fig.6.Ex-XPS spectra of CuS cathodes at different discharge/charge status: (a–d) Cu 2p3/2 and (e) Mg 1s.

Fig.7.(a) TEM image,(b) SAED pattern,(c-d) HRTEM images and (e) EDX elemental mapping images of CuS cathode in fully discharge state.
Ex-XPS was also conducted at different electrochemical states to reveal the reaction path of the elemental valence during the magnesiation/demagnesiation process.Fig.6a presents the Cu 2p3/2spectra for the fresh electrode,in which two peaks at 931.4 and 932.1 eV are attributed to the Cu2+and Cu+,respectively.The appearance of a relatively small amount of Cu+could be due to the reduction of Cu2+to Cu+caused by self-discharge during the aging process,which was accompanied by the formation of MgS shown in Fig.6e.Afterwards,the electrode was discharged to 1.0 V (Fig.6b) and the peak of Cu+became much higher,while the peak of Cu2+weakening obviously with the emergence of Cu0and shake-up satellite peak (marked as Sat.) [29].As presented in Fig.6c,the fully discharge to 0.01 V resulted in the disappearance of Cu2+,the significan decrease of Cu+and the remarkably increase of Cu0.After further charging to 2.0 V,the Cu 2p3/2spectra is basically similar to the fresh electrode (Fig.6a).Fig.5e shows the Mg 1s spectra at different electrochemical states.The peak of 1303.9 eV for the fresh electrode could be attributed to the self-discharge effect,which can explain the presence of Cu+.As the discharge continuing,the peak of MgS gradually increases.The result shows that the proportion of MgS increased significantl during the magnesiation process,which is well consistent with the Cu 2p3/2spectra results.Finally,the residual MgS peak just corresponds to the retain of the Cu+shown at the charging state.These results are in good agreement with that of ex-situ XRD (Fig.5c) and further confir the multi-step magnesiation and incomplete demagnesiation process during the electrochemical reaction.
To characterize the change of morphology for the CuS electrode after cycling,ex-situ TEM analysis was performed after the 5th cycle and the details were presented in Fig.7.As shown in the TEM image(Fig.7a),the cycled CuS appears as irregular nanosphere with a diameter of about 150 nm,slightly smaller than the as-prepared CuS powder sample (about 250–300 nm).The similar reduction of particle size after cycling has also been reported in other conversion electrode materials [41,53,54].The possible reason is the destruction and re-aggregation of CuS nanospheres during electrochemical cycling,which can well explain the poor cycling performance for the CuS cathode.Such large capacity loss can also be assigned to the formation of solid electrolyte interphase (SEI)layer (Fig.7b) during the discharge process.Furthermore,the SAED and HRTEM patterns (Fig.7c–e) clearly showed that the cycled CuS electrode were composed of Cu2S,Cu and MgS.The residues of Cu2S demonstrated an incomplete conversion reaction occurred during the discharge process.These finding indicated that a conversion reaction occurred between CuS electrode and Mg,which was in good accordance with the ex-situ XRD and ex-situ XPS results.Moreover,as shown in the elemental mapping images (Fig.7f),the Cu,S and Mg elements are uniformly distributed in the nanosphere,which indicates the magnesiation of CuS electrode occurred during the discharge process.
4.Conclusions
In summary,an efficien low-temperature synthesis strategy is applied to synthesis CuS submicron spheres for cathode material of RMBs.Though the CuS cathode exhibits a relatively poor cycling performance due to the formation of SEI layer and destruction of the electrode structure,the CuS cathode synthesized in this work can deliver a high specifi capacity of 396 mAh g−1at 20 mA g−1and a remarkable rate capacity of 250 mAh g−1at 1000 mA g−1due to the advantages of the nano needle-like particles on the surface of CuS submicron spheres and porous structure.In addition,the Mg storage mechanism has been investigated by CV,ex-situ XRD,ex-situ XPS and ex-situ TEM,and all results demonstrated that the electrochemical reaction process is dominated by the two-step conversion reaction controlled by diffusion.Such one high-safety and low-cost synthesis strategy is proved to be an effective method to improve the diffusion kinetics of Mg2+,and the analysis of the conversion reaction mechanism could make a contribution to the reaction mechanism of RMBs.
Acknowledgements
The authors are very grateful for the support from the Fundamental Research Funds for the Central Universities of Chongqing University (No.2020CDCGCL005).
杂志排行

Journal of Magnesium and Alloys的其它文章
- Development of high-strength magnesium alloys with excellent ignition-proof performance based on the oxidation and ignition mechanisms: A review
- Development and application of magnesium alloy parts for automotive OEMs: A review
- Recent advances in surface endothelialization of the magnesium alloy stent materials
- Recent developments in high-pressure die-cast magnesium alloys for automotive and future applications
- Exploring the contribution of oxygen reduction reaction to Mg corrosion by modeling assisted local analysis
- Microstructures,mechanical properties,corrosion,and biocompatibility of extruded Mg-Zr-Sr-Ho alloys for biodegradable implant applications