Formation of carbon and oxygen rich surface layer on high purity magnesium by atmospheric carbon dioxide plasma
2023-03-24GyoungJangSinhulYeomJongKeumMinaYoonHarryIIIMeyerYiFengSuJiheonJun
Gyoung G.Jang ,Sinhul Yeom ,Jong K.Keum ,Mina Yoon ,Harry III Meyer ,Yi-Feng Su ,Jiheon Jun,∗
a Manufacturing Science Division,Oak Ridge National Laboratory (ORNL),One Bethel Valley Road,PO Box 2008,MS6054,Oak Ridge,TN 37831,United States
b Material Science and Technologies Division,Oak Ridge National Laboratory (ORNL),One Bethel Valley Road,Oak Ridge,TN 37831,United States
c Neutron Scattering Division &Center for Nanophase Materials Sciences,ORNL,One Bethel Valley Road,Oak Ridge,TN 37831,United States
d Chemical Sciences Division,ORNL,One Bethel Valley Road,Oak Ridge,TN 37831,United States
Abstract Carbon and oxygen-rich corrosion barrier layer formed on Mg by a simple and scalable CO2 atmospheric plasma (CO2-AP) process.The reactive CO2-AP interacts with the Mg surface and forms a unique layered structure with the top MgCO3/MgO-intermixed particulates pillars and the bottom dense layer.The surface features were simultaneously formed on the nano-/micro-structured MgO layer by carbonate molecules,plasma-active CO2 molecules,and/or other volatile organic compounds on the nano-/micro-structured MgO particle layer.The resulting surfaces after CO2-AP were either hydrophobic or hydrophilic and exhibited lower anodic current or high resistance for Mg corrosion.For the hydrophobic surfaces of CO2-AP treated Mg,molecular dynamic simulations were performed to understand the origin of hydrophobicity and identifie that the amorphous carbon layers formed on the Mg surface are the source.The environmentally benign abundant-gas-based process enables the cost reduction associated with waste treatment,generation of by-product,and supply of raw material.
Keywords: Atmospheric plasma;Magnesium;Corrosion protection;Surface modification
1.Introduction
Poor corrosion resistance of Mg is one of the major bottlenecks to limit the wide application of Mg alloys in lightweight vehicle and aircraft components,bioengineering implants,and battery and fuel cell electrodes [1–6].In humid air and water,the surface of Mg naturally forms Mg(OH)2and MgO layers[7] which are often porous and unprotective,especially in the presence of NaCl.Various alloying strategies have demonstrated a moderate increase of Mg corrosion resistance;however,protective coatings are still considered to be the most cost-effective way for improving the corrosion resistance of Mg and Mg alloys.
Conventional coating techniques such as chemical and electrochemical conversion coatings [8],anodizing [9,10],electroplating [11],thermal powder spray coatings [12] or polymer coatings have been developed to fabricate corrosionresistant coatings and thus provide protection for practical applications.However,reliable Mg protection typically requires multilayer coatings via a series of processes [2,13].Also,these wet-chemical-based coating approaches must follow the standard of US Environmental Protection Agency regulations regarding volatile organic compound generation.These conditions raise the issues of the complexity of processes,high cost,and an inadequate degree of corrosion protection.
Recently,superhydrophobic coatings have been considered as a promising technology to significantl improve the corrosion resistance of metallic substrates because this method can effectively reduce the contact area from aqueous corrosive medium [14–16].As is well-known,the superhydrophobic surfaces on metallic substrates are usually fabricated by a two-step route: (1) creating nano/micro surface structures on a substrate with particle deposition,etching,and conversion;(2) modifying the surface with low-surface-energy compounds such as F and C.Still,the technical issue is increasing adhesion between nano/microstructures and metal surfaces to achieve durable superhydrophobicity.Hydrothermal treatment and chemical conversion in a salt solution have been studied to growin-situMgO/Mg(OH)2-corroded product on the Mg surface for the strong nano/microstructure as a single entity.The structured surfaces are then modifie with low-surface-energy compounds such as steric acid and fluorosilan [15–18].
A new coating approach recently reported that a corrosionresistant MgCO3layer on the surface of the micro Mg structure was formed via direct reaction of an already-existing surface oxide fil with excited CO2under electron-beam irradiation [19].Magnesium carbonate is a stable compound with a very low solubility of 20 mg per 100 mL in water;it can stay inert in water for a long time and grow in a dense and compact layer on the Mg metal surface [19].Additionally,research on film formed on Mg substrates under atmospheric conditions containing CO2shows that layers containing carbonates/hydroxy carbonates on the surface of Mg alloys can suppress corrosion by blocking the anodic and/or cathodic sites [20].
Inspired by the reported MgCO3layer formation under CO2-driven,electron-beam/plasma irradiation and improved corrosion resistance [19],the objective of this study is to demonstrate the facile formation of MgCO3for an anticorrosion layer on Mg via an atmospheric room temperature CO2chemical plasma technique (Fig.A1).The atmospheric plasma(AP)is generated by a high-frequency electromagnetic fiel under high voltage.As compressed gas fl ws across the field the atoms become ionized with free electrons and atomic and molecular radicals in excited levels,producing a “cold”plasma [21].This highly reactive environment is maintained close to the room temperature.
Depending on the principle of generation,these APs can be employed directly in the production line because no need exists for high-cost vacuum chambers.The cold plasma has a high chemical energy but a low thermal energy,so it should not damage temperature-sensitive materials [22].Currently,the AP technique has been successfully industrialized in largescale deployments such as an automated in-line continuous system for rapid,low-cost,open-air surface cleaning,activating,and cutting.By simply using CO2instead of O,N,and Ar as the source feedstock gas,and ideally with CO2as a cover gas,our approach provides improved corrosion protection for Mg.
In the present study,we report a new corrosion mitigation method using the CO2-AP treatment.Among the CO2plasma-treated Mg samples,some surfaces showed hydrophobicity which remarkably reduced Mg corrosion.To mechanistically demonstrate the hydrophobic Mg surfaces,molecular dynamics (MD) simulations were also performed.
2.Experimental
2.1.Materials
The cast commercial purity Mg,approximately 99.98%Mg[23],was obtained from Magnesium Elektron North America,Madison,IL,USA.Test samples,25 mm×25 mm in size and ∼1 to 1.5 mm thick,were obtained for all samples by electric discharge machining.The test samples were wet ground with SiC paper 120 to 600 grit finis for rough and smooth references,cleaned with deionized water,and dried with an air stream.The samples were stored in a desiccator before AP treatment.
2.2.Preparation of the CO2-AP–treated Mg substrate
The CO2-AP treatment was carried out in a customdesigned CO2-enriched cover gas chamber to increase the MgCO3formation.The cold-plasma treatment was performed using a PlasmaFlux system manufactured by Atmospheric Plasma Solutions [22].The process was performed in a working chamber with a 3D robotic surface equipped with an exhaust and filtratio system.The plasma generated a highvelocity fl w of chemically active CO2radicals that exited the nozzle tip as a plasma plume,as shown in Fig.A1 in the appendix.The robotic stage and plasma pen were controlled by three stepper motors and three rack and pinion drives that have the ability to move in the x (forward),y (side),and z(height) directions.Various plasma operation conditions were tested to uniformly treat on surface.For example,the nozzlegenerating CO2-AP by 100% CO2gas passed through the sample surface with 0.38 cm height,762 cm/min and 0.06 cm spacing at 70 SLPM of fl w rate.The swing number,which is the overlapping of plasma treatments,increased to intensify the CO2-AP effect for uniform and multiple layers.
2.3.Characterization of materials
Surface treated samples were analyzed by surface scanning electron microscopy (SEM) with energy dispersive Xray analysis (EDS),X-ray diffraction (XRD),X-ray photoelectron spectroscopy (XPS),and cross-section scanning transmission electron microscopy (STEM) in dark fiel (DF)and high angle annular dark fiel (HAADF) modes.Water contact angles (WCA) were measured using an optical tensiometer (OneAttension,Biolin Scientific) The XPS analysis used a monochromated,micro-focusing,Al KαX-ray source(1486.6 eV) with an ∼400 μm X-ray spot size for maximum signal and to obtain an average surface composition over the largest possible area [24].Depth profilin analyses were conducted with a Thermo Scientifi EX06 argon ion gun operated at 1000 eV and rastered over a 2 mm×4 mm area.The specimens for STEM analysis were prepared via the focus ion beam (FIB) milling technique by thein-situlift-out method using a Hitachi NB5000 FIB-SEM.A tungsten and/or carbon and tungsten overlayer was deposited to protect the exposed top surface of the fil during ion milling.Further details of the sample preparation and analysis methodology are provided elsewhere [24].
2.4.Corrosion evaluation
Potentiodynamic polarization measurements were conducted for the 600-grit finishe and CO2-AP-treated Mg samples as working electrodes,with the exposed area of 0.98 cm2(7×14 mm2) or 0.833 cm2(Ø=10.3 mm) prepared by insulation tape masking.Reference saturated calomel electrode (SCE) and Pt plate counter electrode with ∼5 cm2of surface area were used in 3.5 wt.% NaCl solution.In the beginning,the Mg samples were resting at open-circuit potential(OCP) for 50–60 min.After this open-circuit potential delay,potentiodynamic polarization was performed with a rate of 1 mV·s−1in two different potential windows: for the exposed area of 0.98 cm2,−1.8 to −1.2 VSCE,and for 0.833 cm2,−2.25 to −0.95 VSCE.
Electrochemical impedance spectroscopy (EIS) was also performed to assess the corrosion behavior with increasing immersion time in 3.5 wt.% NaCl solution.OCP was measured for 1 h before the firs EIS measurement for the impedance data with 1 h immersion.The next EIS measurements were also performed for the same samples at longer immersion times.The frequency window was 200 kHz to 7 mHz,and the amplitude was ±10 mV with respect to the last OCP value.The impedance data were analyzed using a commercial computer software(Zview,Scribner)to determine the key resistance values for corrosion evaluation.All electrochemical measurements were conducted at room temperature and open to air.
H2gas evolution measurements during immersion were also carried out in 3.5 wt.% NaCl solution at ambient temperature for untreated and CO2-AP-treated Mg samples.The edges of all samples were masked with a polymer tape to expose a fi ed area of 7×14 mm2(0.98 cm2) to NaCl solution.Each sample was positioned upright in a glass beaker containing 500 mL of 3.5 wt.% NaCl.The solution was open to air for the duration of the experiment.An inverted funnel was placed over the sample,and a burette fille with 3.5 wt.%NaCl solution was placed over the tip of the inverted funnel.This apparatus collected H2gas evolved during Mg corrosion[25].After exposure,the samples were removed from the solution,rinsed with deionized water and then ethanol,dried using a stream of air,and photographed.
3.Computational modeling
3.1.Modeling magnesite (MgCO3) and its interaction with water droplets
Magnesium carbonate or magnesite is an inorganic salt of trigonal crystal (symmetry group of) with experimental lattice parameters of a=b=4.635,c=15.019,α=β=90°,andγ=120° [26].We employed a forcefiel potential [27,28] that was established for alkaline-earth carbonate and water systems and leads to the lattice parameters a=b=4.611,c=15.069,α=β=90°,andγ=120°.At 300 K,these values are slightly modifie to a=b=4.615,and c=15.165[26].The interaction between C and O atoms of carbonate is described by the 12–6 Lenard-Jones potential,,whereεC–O=0.1 eV andσC-O=2.98.These parameters were determined to eliminate any internal pressure at 300 K by performing canonical MD simulations as implemented in the Large-scale Molecular Massively Parallel Simulator (LAMMPS) program [29].
We then modeled the magnesite surface as a rectangularlike slab consisting of a 117.3×119.7×13.03size supercell (containing total 20,800 atoms) with large vacuum layers of 100,20,and 20each along the z,x,and y axes,with periodic boundary conditions,where ± (104) crystallographic orientation along the z axis andalong the x and y axes,respectively,were exposed.Then,a water droplet of ∼6 nm diameter (consisting of 1000 water molecules) was introduced on the (104) surface and the configuratio was fully optimized until the maximum force became less than 10−8eV/,using the conjugate gradient scheme implemented in LAMMPS [28].After that,we began MD simulations using the optimized configurations
3.2.Modeling graphite and amorphous carbon and their interaction with water droplets
We compared the wetting behavior of water molecules on two different carbon surfaces,graphite and amorphous carbon.Our graphite is modeled as 6 graphene layers with a surface area of 25.6×398.52containing 22,842 carbon atoms,where the atomic distance between the nearest carbon atoms is 1.42and the distance between the layers is 3.35.We then used the adaptive intermolecular reactive empirical bond order—Morse (AIREBO-M) force-fiel potential [30] to generate an amorphous carbon structure according to the scheme in the literature [31].The initial structure is a simple cubic cell with 27,900 carbon atoms of the same atomic density of graphite,2.267 g/cm3.We then performed MD simulations to treat the structure with heating,annealing,and cooling cycles[30].The structure was heated to 8,000 K for 10 ps,cooled to 2,000 K for 100 ps,annealed at 4,000 K for 100 ps,and cooled to 300 K for 10 ps,resulting in an amorphous carbon slab with dimensions of 31.0×384.0×20.63.We applied periodic boundary conditions in x and y directions for all the supercell calculations.
As shown in Fig.1a,the amorphous carbon completely lost the essential features of the initial configuratio (“graphite,”six-layered graphenes),such as the network of sp2hexagonal rings and their arrangement in two-dimensional layers,and it became completely amorphous.It consisted of a randomly distributed mixture of hexagons and polygons interconnected to form a three-dimensional sp3network of carbon atoms.This structural feature is confirme in the radial distribution functions (RDFs) comparing the atomic distance with their distribution.Fig.1b compares the RDFs of the graphite and the amorphous carbon.Because of the well-define structure of graphite,its RDF shows discrete peaks at r∼1.4,2.5,2.8,and so on,corresponding to the nth-nearest-neighbor atomic distances.Meanwhile,the RDF of the amorphous carbon shows relatively smooth and broad peaks with the firs two peaks located at r∼1.4 and 2.5.
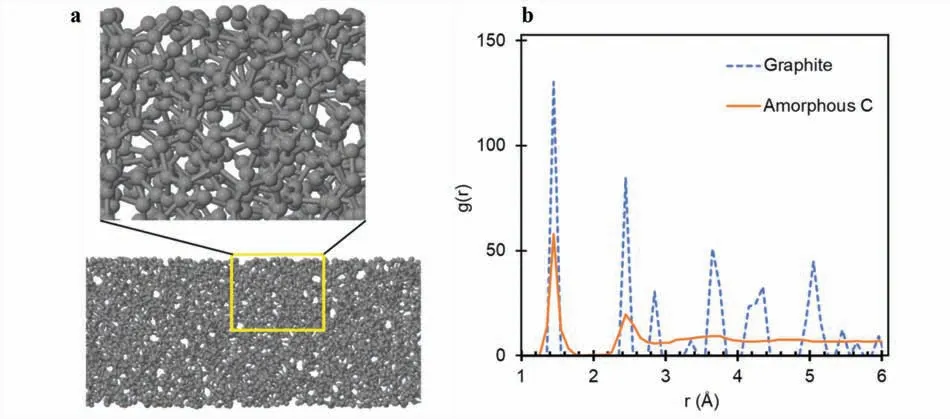
Fig.1.(a) Side view of the amorphous C slab with magnificatio of the structure in the yellow region.(b) Radial distribution functions of “graphite” (our six-layer graphene system) and amorphous C.
To describe the interaction between carbon and water system,we employed a force fiel [32] which combines point charge interactions for electrostatic interactions and a Lenard-Jones potential for the chemical interactions.Our parameters of partial charges for Coulomb interactions are O=−0.8476 e and H=+0.4238 e,the Lenard-Jones parameters for O–O areεO-OO=0.00674 eV andσO-O=3.16,for C–O areεC-O=0.00412 eV andσC-O=3.19with a cut-off distance of 10.A water droplet of ∼7 nm diameter (consisting of 3,969 water molecules) was relaxed and annealed on the carbon surface at 300 K for 10 ps by canonical MD simulations with the coordinates of the surface fi ed.Next,we performed 0.9 ns of MD simulations for sampling.After that,we collected the configuration of the last 10 snapshots at every 10 ps and analyzed the contact angles between a water droplet on each surface for the further analysis.
4.Results and discussion
4.1.Characteristics of the CO2 plasma-treated surface
CO2-AP treated Mg samples resulted in either hydrophobic or hydrophilic surfaces where some examples are shown in Fig.2a and b.The untreated Mg surface (600 grit SiC finish was hydrophilic as exemplifie in Table 1.Despite our repeated reviews on plasma processing parameters,it was impossible to defin the cause (es) for hydrophobic or hydrophilic treated Mg surfaces.As Mg is highly reactive with any environmental factor (e.g.humidity),the affinit to water on treated Mg samples may have been impacted by the conditions in which the samples were stored during the transportation between the plasma treatment facility in Cary,North Carolina and corrosion testing and microscopic characterization labs in Oak Ridge,Tennessee.For the treated samples with hydrophobic surface,the value of water contact angle increased with increasing the swing number of CO2-AP as presented in Table 1.
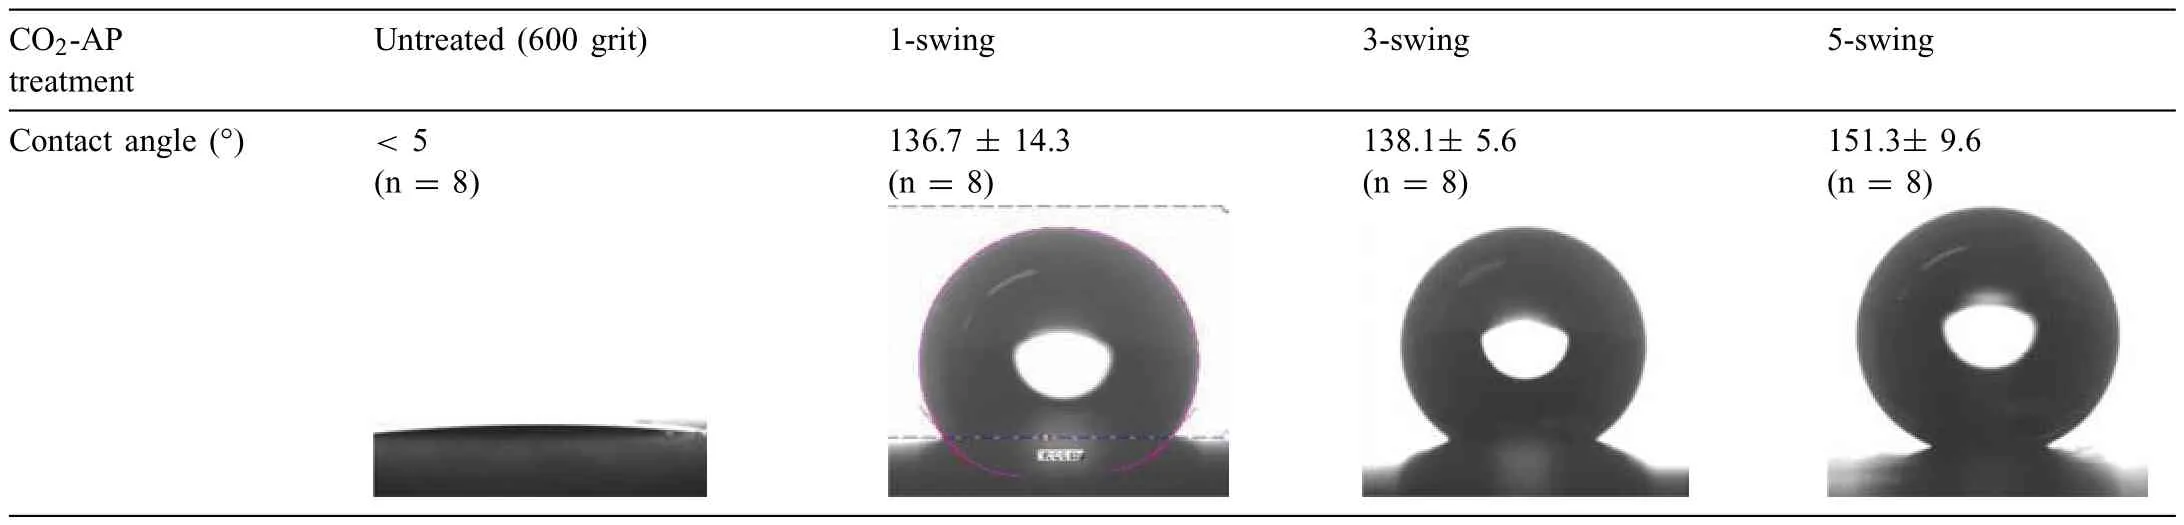
Table 1 Water contact angle measurement on CO2-AP–treated Mg surfaces and corresponding surface morphologies of the treated surfaces.The hydrophobicity increased with the plasma swing number,correlated with surface morphology changes.
Here,we focus on characterizing a treated hydrophobic Mg specimen with 5-swing of CO2-AP,and for the sample,two SEM images are presented in Fig.2c and d.In plan view,the treated surface exhibited agglomerated sub-micron particles which resulted in a rough profile In cross-sectional view(Fig.2d),duplex surface structure,with ∼1 μm thick inner dense layer and outer porous pillars containing sub-micron particles,is observed on Mg substrate.For the observed sample crosssection,there was no apparent defect or gap between plasmadriven duplex layer structures and Mg substrate (see Fig.2d).The surface nanoparticles appeared interconnected each other,which implies that the particles would not easily be detached upon external friction or other stresses.
4.2.Corrosion mitigation effect of the CO2 plasma-treated surface
In a simple immersion test in 3.5 wt.% NaCl,a CO2-AP treated Mg sample showed reduced corrosion attack with respect to an untreated Mg sample as observed in Fig.A2 in the appendix.Typical potentiodynamic curves are presented for hydrophobic and hydrophilic CO2-AP treated (with 5-swing)Mg samples as well as untreated Mg samples in Fig.3.Hydrophobic treated surfaces showed notably low current compared to the untreated Mg samples (Fig.3a),which is highly likely due to minimal wetting between the hydrophobic surface and NaCl solution.However,a hydrophilic Mg sample showed cathodic and anodic currents that were slightly larger than the untreated sample (Fig.3b),implying no corrosion mitigation if CO2-AP treated surfaces are hydrophilic.

Fig.2.SEM images showing a CO2 plasma-driven protective layer that consisted of particle deposition on a dense layer with ∼1.5 μm thickness.(a) Photoimage of a CO2-AP–treated superhydrophobic Mg surface repelling water droplets (b) Photo-image of hydrophilic Mg surface after CO2-AP-treatment,(c,d)Plane and cross-sectional SEM imges of 5-swing CO2-AP treated Mg sample.
To further investigate the corrosion behavior of ‘hydrophilic’ CO2-AP-treated surfaces,EIS measurements were conducted,and some impedance spectra are plotted in Fig.4 for 1 h and longer immersion times in 3.5 wt.% NaCl.For 1 h immersion,the treated Mg sample showed two impedance arcs,and the total impedance scale was greater in the treated sample than the untreated Mg.In longer immersion times,the impedance scale decreased significantl for both the treated and untreated Mg samples,but the treated sample still exhibited a greater impedance scale.The resistance values,R2or R2+R2’,determined from impedance data fittin are summarized in Table 2.The resistance values suggest that even hydrophilic CO2-AP-treated Mg surface could exhibit slight corrosion mitigation.

Table 2 OCP values and EIS fittin results of the impedance spectra presented in Fig.4.
H2collection measurements were also performed for untreated and CO2-AP-treated Mg samples,and the results are presented in Fig.5.Note that the two separate comparisons are from the different exposed area (0.98 vs.0.833 cm2) and baseline (untreated) surface (120 vs.600 grit SiC finish)Compared to the untreated Mg surfaces,both hydrophobic and hydrophilic CO2-AP-treated Mg surfaces produced lower H2vol during the immersion in 3.5 wt.% NaCl,indicating that CO2-AP-treatment of Mg would result in long-term corrosion mitigation regardless of the surface wetting property(hydrophobic or hydrophilic).
4.3.Protective carbonized MgO/MgCO3 surface fil
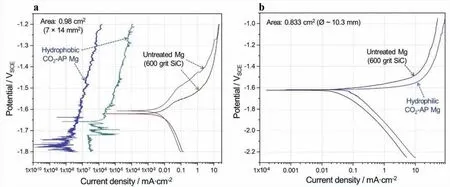
Fig.3.Polarization curves of (a) untreated and hydrophobic CO2-AP treated Mg surfaces with 0.98 cm2 area and (b) untreated and hydrophilic CO2-AP treated Mg surfaces with 0.833 cm2 area.3.5 wt.% NaCl was used.

Fig.4.Impance plots of (a) untreated and hydrophilic CO2-AP Mg surfaces witrh different immersion times and (b) two impedance plots in (a) shown in smaller impedance axes.3.5 wt.% NaCl was used.The impedance values at low frequencies,often in inductive domain,were noisy to be precisley analyzed so that they were not plotted.Although more preciase corrosion rates can be derived by analyzing low frequency inductive impedances [33],fair comparison of corrosion resistance was previously made without considering the low frequency impedances [34,35].

Fig.5.H2 collection volume vs.immersion time plots: (a) untreated and hydrophobic CO2-AP treated Mg surfaces with 0.98 cm2 area and (b) untreated and hydrophilic CO2-AP treated Mg surfaces with 0.833 cm2 area.

Fig.6.SEM-Energy-dispersive X-ray spectroscopy images of CO2-AP–treated Mg surface.The Mg surface was treated with 1 swing.(a) Top view of SEM SE image and corresponding elemental maps (b–d).
The corrosion mitigation effect is presumably originated from the chemical composition and crystalline changes (the MgCO3/MgO mixture) resulting from the CO2-AP treatment.Hydrophobicity,observed from some CO2-AP treated samples,should also contribute significantl to corrosion mitigation and could be originated from surface roughness associated with the nanoparticle (i.e.,the MgO/MgCO3intermixed)pillars (see Fig.2d) We suggest that chemically active CO2plasma molecules adsorbed on the MgO nanoparticle surfaces,then formed carbonated layers.In principle,MgCO3can be formed via the chemical reaction,MgO+CO2→MgCO3.At ambient temperature and pressure,Gibbs free energy change of this chemical reaction is −21.4 KJ mol−1(i.e.,the exothermic and thermodynamically favorable reaction even at room temperature).Also,the MgO particles have diverse basic sites where the acidic CO2molecules be chemically/physically adsorbed on the surface,resulting in various carbonate surface species,including bicarbonate,bidentate,and unidentate carbonates [36].The theoretical CO2uptake capacity of MgO is 109 wt.% (1.09 of CO2/1 g of MgO sorbent).Nano-scale mesoporous MgO can show an adsorption capacity of ∼8–10 wt.% at ∼25–30 °C [37,38].
We also consider that heat generation could be another factor to accelerate CO2adsorption at the surface.It was reported that the substrate temperature under atmospheric plasma could reach to 200 °C during the treatment with the plasma [24].A formation of Mg hydroxycarbonate may be considered as another route for MgCO3.Because of the affinit between CO2and Mg(OH)2,hydromagnesite [i.e.,Mg5(CO3)4(OH2)·4H2O]was formed in humid air with CO2-rich conditions [39].The hydromagnesite becomes MgCO3in dry conditions.The CO2-driven Mg hydroxycarbonate is less soluble in water and could provide a protective and electrically insulating layer on the surface,possibly suppressing corrosion by blocking the anodic and/or cathodic sites [22].
The CO2-AP–treated surface exhibited a higher carbon content.Fig.6 shows the top surface treated with 1-swing CO2-AP.The treated surface had more O and C contents,suggesting that the MgO adsorbed CO2or molecular C (e.g.,volatile organic carbons) from CO2-rich environment.Surface fil formed on 1-swing CO2-AP treatment was further characterized by cross-sectional DF-and HAADF-STEM with energy-dispersive X-ray spectroscopy analyses,as presented in Fig.7.It shows that agglomerated nanoparticles in pillar structures and underlying dense layer on Mg substrate,which is similar to the previous SEM image in Fig.2d.The elemental mapping of the top layer indicates that three major elements (Mg,O,and C) are well-dispersed throughout the layer,verifying the coexistence of MgO and MgCO3.
X-ray diffraction(XRD)measurements in Fig.8 confirme that the phases of the resultant layer were primarily MgO and MgCO3.The peaks at 32.0,43.0,46.5,and 52.0° could be assigned to [104],[113],[202] and [024] planes in the hexagonal phase of MgCO3,whereas other peaks at 37.2 and 43.0° could be assigned to MgO.The surface carbonization was analyzed by XPS spectra of Mg,O,and C (Fig.9).The CO2-AP sample,as shown in Fig.9a,has a distinct Ccarbonate peak at 292 eV and a broad C–C peak fraction at 285 eV,whereas the untreated sample has a relatively low Ccarbonate peak,which is very similar to the reported pure Mg results [36].The untreated referential surface was generated by scratching on the same sample before the XPS examination to simulate the referential corrosion test sample and identify the carbon adsorption.Notably,all carbon-related peaks in the reference scratched area,as shown in Fig.9e,disappear after 15 s of Ar-sputtering.
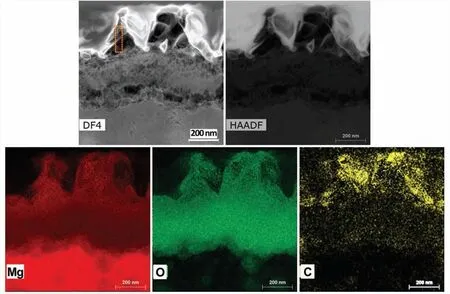
Fig.7.High-magnificatio cross-sectional DF-and HAADF-STEM images of the CO2-AP–treated Mg along with corresponding energy-dispersive X-ray spectroscopy elemental mapping showing the distribution of Mg,C,and O in the top treated layer.In the Yellow dotted box area of DF4 image,the compostions of C,Mg and O were ∼15,∼40 and 35 wt.%,respectively.

Fig.8.XRD pattern for the CO2-AP–treated Mg (fi e-times swing).XRD patterns of untreated Mg were measured at two angles (0° and 90°) to avoid the crystalline directional effect.
A pure Mg fil was reported to form a ∼4 nm oxide/hydroxide film after exposure to the ambient atmosphere within 1 day,the oxide fil thickness increased to 10 nm over three weeks,and the air-formed oxide/hydroxide film on Mg adsorbed a significan amount of carbon from the ambient air to form MgCO3[40].The same study showed that upon exposure to the ambient atmosphere,the thin oxide/hydroxide fil Mg surface adsorbed volatile organic compounds to form predominantly bidentate-bound carboxylate salts,which cause a significan surface change from hydrophilic to hydrophobic.Also,another reported XPS study on carbonization of MgO particles confirme that the formation of carbonate species on MgO particles increases significantl with the increase in the CO2concentration [41].
Fig.9b shows two O 1s peaks are easily distinguished in the XPS spectra of two comparable samples.The literature has shown that the peaks related to MgO have binding energies at ∼530.0–531.0 eV,MgOH have binding energies at ∼530.0–533.2 eV,and MgCO3present peaks at ∼533.2–533.5 eV [42,43].Similarly,a strong O–C peak in the O 1s spectra of the treated sample is present after the long-time sputtering (Fig.9b),while the O–C peak from the untreated sample significantl reduced after the short-time sputtering(Fig.9f).The Mg 2p and Mg Auger indicate that the CO2-AP treatment formed thicker MgCO3/MgO film than the untreated sample as the peaks of respective species were higher in the treated sample (Fig.9c,d,g and h).Additionally,XPS depth profile in Fig.10 show that the C–C/−CO3amount of the treated surface is significantl higher than the untreated one.
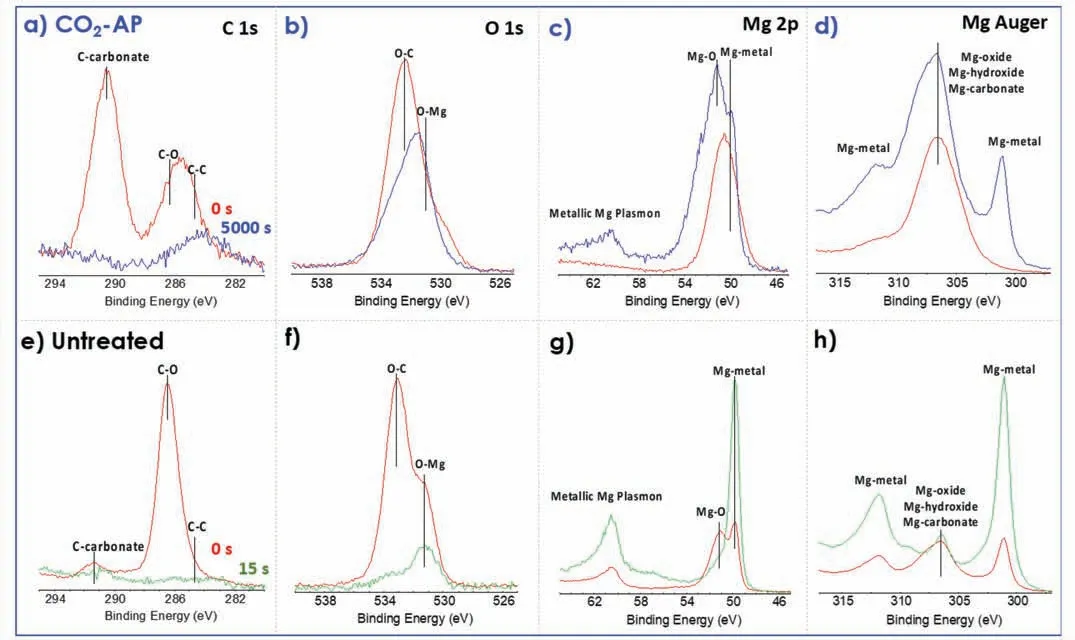
Fig.9.XPS core energy spectra for (a–d) a CO2-AP treated Mg (with 5-swing) compared with (e–h) untreated Mg.

Fig.10.XPS depth profilin of carbon component(C–C/−CO3)for the CO2-AP–treated Mg.
5.Molecular dynamics simulations
Due to analytical limitation of surface characterization at the atomic scale surface layer,we performed classical MD simulations based on empirical potentials [26,27,31] to understand the origin of the hydrophobicity at the atomic level for the hydrophobic treated samples.In the beginning,we investigated the interaction of water molecules on the pristine MgCO3(magnesite) surface using a force fiel [26,27] established for alkaline-earth carbonate and water systems.Our model system (Fig.11a) consists of 1,000 water molecules on a MgCO3slab of 20,800 atoms and a 13.0thickness with (104) facet,which corresponds to the strongest magnesite peak of our XRD analysis,as shown in Fig.8.The thermally equilibrated structure shows the contact angle between water molecules and the surface of ∼20°,which confirm the hydrophilicity of magnesite;the experimental contact angle reported in the literature is ∼10.4° [44].
We hypothesize that the surface roughness of a hydrophobic surface is the origin of the superhydrophobicity of our system [45].Unlike the fla magnesite or MgO,which are hydrophilic,hydrophobic carbon can add surface roughness to the magnesite surface when the carbon molecules bind on the surface during the CO2-AP treatment.The formation of a carbon layer is confirme (Fig.10) but characterizing its structural properties is challenging.Therefore,we model the crystalline and amorphous carbon structures by performing MD simulations: a simple cubic carbon structure is annealed at a high temperature(∼8,000 K),followed by a rapid cooling to room temperature,resulting in an amorphous carbon with the density of graphite (2.267 g/cm3) [30] (see the section: 3.Computational Modeling).
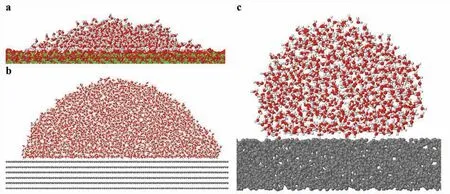
Fig.11.(a) MD simulation modeling a system of a water droplet (1,000 water molecules) on a (104) MgCO3 slab;(b) a water droplet (∼4,000 water molecules) on 6 layers of graphene layers,and (c) on an amorphous carbon slab.Here,the red,white,gray,and green balls represent O,H,C,and Mg atoms,respectively.The atomic simulations confir the hydrophilicity of the pristine magnesium carbonate surface and hydrophobicity or superhydrophobicity on the graphene surface and the amorphous carbon surface.
Next,our MD simulations compare the contact angles of a water droplet on graphite and amorphous carbon with same atomic densities.We obtain a contact angle of the water nanodroplet on graphite of 94.3 ± 2.5° (Fig.11b),which corresponds well with experimental values in the range of 90° to 95° [46].On the amorphous carbon surface,the contact angle increases to 138.3 ± 4.0° (Fig.11c).This angle is slightly less than the superhydrophobic angle,150°,but considering our slab is a fla surface,a roughened amorphous carbon surface would show superhydrophobicity.Indeed,the CO2-AP surfaces show rough surfaces consisting of nanoparticle accumulation (Figs.2d and 7a).
The reason for the increase of the contact angle may be explained by the relatively weakened cohesive force between the water molecules and carbon atoms.The amorphous carbon slab would have relatively less surface atomic density than that of graphite due to defects,and this would decrease the overall cohesive force between water molecules and carbon atoms.Notably,for the system-size independency,we adapted an approach from literature that is free of a systemsize effect by introducing thin slab water droplets instead of dome-shaped water droplets [29].In the literature,the authors found more than 2,000 water molecules show size independency,and more than 4 layers of graphene showed graphitelike behavior;therefore,we choose 4,000 water molecules on 6 layers of graphene and a similar thickness of the amorphous carbon slab.
6.Conclusion
A microstructured MgCO3/MgO based surface was formed on commercially pure Mg substrates via simple CO2-AP treatment.The treated Mg samples exhibited either hydrophobic or hydrophilic surfaces.In hydrophobic treated surfaces,reduction of Mg corrosion was remarkable as confirme from significantl low anodic and cathodic currents during polarization measurements.In hydrophilic treated surfaces,moderated increase of corrosion resistance was confirme by EIS measurements.The results from H2collection measurements showed that both hydrophobic and hydrophilic treated surfaces can exhibit long-term corrosion mitigation.
Electron-microscopic and X-ray based characterization suggest that the treated surfaces had a unique structure,composed of top nano pillars and dense bottom layer and two major phases,MgCO3and MgO,with excessive carbon.Presence of carbon-carbon bonds,possibly a cause of hydrophobicity,were confirme on the very top surface of a CO2-AP treated Mg.The MD simulations demonstrated that superhydrophobicity could originate from the amorphous carbon layers formed on the treated Mg surface.
Declaration of Competing InterestThe authors declare that they have no known competing financia interests or personal relationships that could have appeared to influenc the work reported in this paper.
Acknowledgments
This work was supported by the US Department of Energy’s (DOE’s) Offic of Energy Efficien y and Renewable Energy,Vehicle Technology Office Powertrain Materials Core and Light Metals Core Programs.Sample characterization is also partially supported by the Technology Commercialization Fund Fiscal Year 2020 of DOE’s Offic of Technology Transitions and by the Creative Materials Discovery Program through the National Research Foundation of Korea,with computational modeling of amorphous carbons funded by the Ministry of Science,ICT and Future Planning(NRF-2016M3D1A1919181).The research was conducted at ORNL,which is managed by UT Battelle LLC for DOE under contract DE-AC05-00OR22725.Computational modeling and part of the materials characterization (SEM and XRD)were performed at the Center for Nanophase Materials Sciences (proposal ID: CNMS 2021-A-00626),which is sponsored at ORNL by DOE’s Scientifi User Facilities Division.This research used resources of the Oak Ridge Leadership Computing Facility and the National Energy Research Scientifi Computing Center,which are DOE Offic of Science user facilities.Peter Yancey (Atmospheric Plasma Solutions,11301 Penny Road,Cary,NC 27518,United States) provided significan technical support and supervised the production of plasma-treated Mg samples.
Appendix

Fig.A1.(a) Plasma treatment inside a CO2-enriched chamber with a 3-inch wide observation window,(b) inline automated CO2 atmospheric plasma treatment on an epoxy-mounted Mg disk specimen (Ø≈0.5 inch),(c) the schematic diagram shows a proposed mechanism;CO2 plasma converts the Mg surface to an MgO/MgCO3 intermixed-particulates layer.
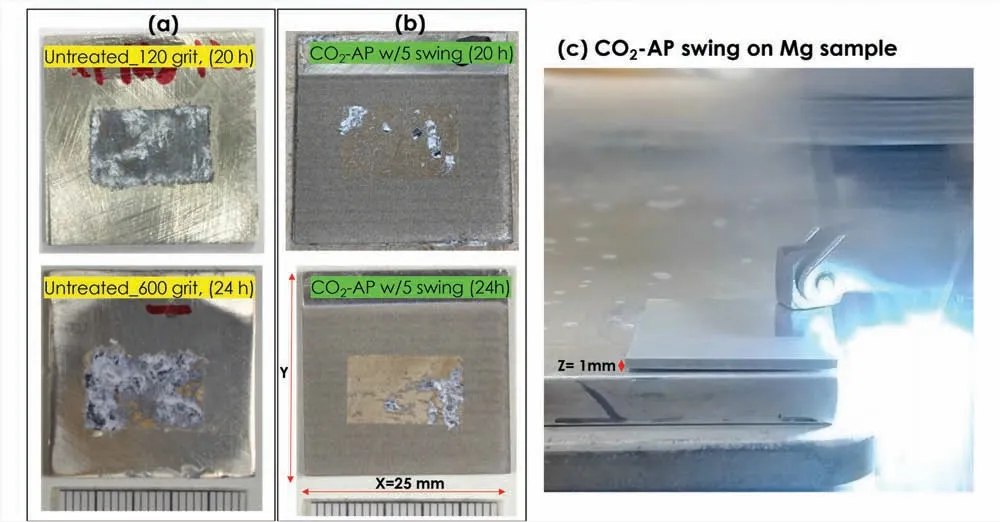
Fig.A2.Exposure surface photos of the Mg specimens (7×14 mm2 or 0.98 cm2) after 3.5 wt.% NaCl solution immersion for 20∼24 h: (a) untreated (120 and 600 grit) and (b) hydrophobic CO2-AP treated Mg surfaces (5-swings).The CO2-AP treated (hydrophobic) surface has much smaller areas of corrosion attack,compared with the untreated Mg.(c) CO2-AP swing on Mg sample.

Fig.A3.Two equivanent circuit models with (a) single and (b) double R//CPE used for fittin the impedance data presented in Fig.4.R1 is solution resistance,R2 corresponds to charge transfer resistance at the interface of Mg alloy and electrolyte (3.5 wt.% NaCl) and R2’ represents resistance of porous surface layer.CPE and CPE’ correspond to non-ideal capacitances of double layer and porous surface layer,respectively.
杂志排行

Journal of Magnesium and Alloys的其它文章
- Development of high-strength magnesium alloys with excellent ignition-proof performance based on the oxidation and ignition mechanisms: A review
- Development and application of magnesium alloy parts for automotive OEMs: A review
- Recent advances in surface endothelialization of the magnesium alloy stent materials
- Recent developments in high-pressure die-cast magnesium alloys for automotive and future applications
- Exploring the contribution of oxygen reduction reaction to Mg corrosion by modeling assisted local analysis
- Microstructures,mechanical properties,corrosion,and biocompatibility of extruded Mg-Zr-Sr-Ho alloys for biodegradable implant applications