Association between vision and cognitive function among community-dwelling older adults in Selangor,Malaysia
2023-02-11ZainoraMohammedQiuTingKeeNorlizaMohamadFadzilMohdHarimiAbdRahmanNormahCheDinVanithaMariappanSuzanaShahar
Zainora Mohammed, Qiu-Ting Kee, Norliza Mohamad Fadzil, Mohd Harimi Abd Rahman,Normah Che Din, Vanitha Mariappan, Suzana Shahar
1Programme of Optometry and Vision Science, Faculty of Health Sciences, Universiti Kebangsaan Malaysia, Jalan Raja Muda Abdul Aziz 50300, Kuala Lumpur, Malaysia
2Centre for Rehabilitation and Special Needs Study, Faculty of Health Sciences, Universiti Kebangsaan Malaysia, Jalan Raja Muda Abdul Aziz 50300, Kuala Lumpur, Malaysia
3Center of Toxicology and Risk Health, Faculty of Health Sciences, Universiti Kebangsaan Malaysia, Jalan Raja Muda Abdul Aziz 50300, Kuala Lumpur, Malaysia
4Programme of Dietetic, Faculty of Health Sciences, Universiti Kebangsaan Malaysia, Jalan Raja Muda Abdul Aziz 50300,Kuala Lumpur, Malaysia.
Abstract
● KEYWORDS: ageing; cognition; global cognitive function; information processing; vision
INTRODUCTION
Globally, life expectancy has extended and the older population aged 65 and above has grown exponentially over the years. In general, there is approximately 9% older population worldwide in 2019, which is expected to reach 16%in 2050[1]. A similar demographic trend was also observed in Malaysia with an increment in the size of the older population over ten years from 5.0% in 2010 to 6.8% in 2020[2]. Growth in the older population is a concern among healthcare providers,as longevity increases the risks of age‐related chronic diseases that can consequently result in various types of disability[3].
Previous studies have shown that ageing increases the risk of vision impairment (VI) and cognitive decline[4‐5]. It has been reported that 70% of the population aged 50y and older had moderate and severe VI worldwide[6]. However, a slightly lower percentage (64%) of older adults in Malaysia was reported to have VI[7]. The difference could be due to the cut‐off visual acuity (VA) used in the definition of VI,i.e.,VA was less than 6/18 in the Malaysian study compared to 6/12 in the report by GBD 2019 Blindness and Vision Impairment Collaborators (2021)[6]. Worldwide leading causes of VI among those aged 50y and older in 2020 were uncorrected refractive error and cataracts[8]. In Malaysia cataracts, diabetic retinopathy and uncorrected refractive were the common cause of VI among older people[9].Ageing could also affect cognitive function[4]. The global prevalence of mild cognitive impairment (MCI) among community dwellers is 15.56%[10]. MCI prevalence in low and middle‐income countries ranged from 0.3% to 63.3%, while the prevalence in Malaysia ranged from 15.8% to 21.1%[11].
Reduced vision is associated with cognitive decline[12‐17]. The sensory deprivation hypothesis states that a decline in visual perception over time leads to gradual neural degradation and consequently reduced cognition[18]. The reduced vision had been postulated to affect cognitive performance because it limits the involvement of elder adults in physical and cognitive activities[16,19]. With the increasing size of the older population,the possibility of an increase in the prevalence of VI and cognitive decline in Malaysia and worldwide is inevitable. In Malaysia, studies on cognitive decline using the Malay version Mini‐Mental State Examination (M‐MSE) and Montreal Cognitive Assessment (MoCA) have been reported in the past[20].
This study extends prior research through an investigation of the association between vision and cognitive functions.It is hoped that a better understanding of the association between vision and cognition would be useful in planning for future interventions of maintaining good vision and cognitive function. Therefore, the main aim of this study was to determine the association between vision and cognitive function among community‐dwelling older adults in Selangor,Malaysia.
SUBJECTS AND METHODS
Ethical ApprovalThe study adhered to the Declaration of Helsinki and was approved by the Medical Research and Ethics Committee (UKM1.21.3/244/NN‐2018‐145). The written informed consent of the participants was obtained before enrolment. Following that, socio‐demographic data (age,gender, and education level) was obtained through interviews.
Study PopulationA cross‐sectional study was performed from August 2018 to May 2019 with the recruitment of Malaysian older adults, who previously participated in the population‐based longitudinal study on a neuroprotective model for healthy longevity (Towards Useful Ageing: TUA)[21‐22].The sampling for the study was carried out with the assistance of the Department of Statistics, Malaysia. The participants were recruited using a multi‐stage random sampling method from Selangor state (the most populated state in Malaysia,6569.5 population in thousands), where a higher prevalence of older adults had been reported[23].
The sample size was calculated according to Krejcie and Morgan (1970), where the minimum number of participants required was 172[24]. The inclusion criteria were older adults aged 60y and above and the exclusion criteria were having scores of 14 and below with M‐MSE.
Study Measures
Vision assessmentHabitual distance VA was measured on each eye using the Early Treatment Diabetic Retinopathy Study (ETDRS) chart (Precision Vision, USA) at 3 m. The testing distance was reduced to 2 or 1 m if subjects failed to identify any letter at 3 m. Habitual near VA was measured on each eye using Lighthouse Near Visual Acuity (LNVA) chart(Precision Vision, USA) at 40 cm.
Cognitive function assessmentCognitive function tests were assessed using the Malay version of M‐MSE[25], the Malay version of MoCA[26]and the Digit Symbol (DS) subtest of the Wechsler Adult Intelligence Scale (WAIS‐III)[27].
1) M‐MSE is a test that measures global cognitive function[28].Ibrahimet al[25]validated three Malay versions of M‐MSE(M‐MSE‐7, M‐MSE‐3 and M‐MSE‐S) and reported α‐coefficient of >0.70. Taking into consideration the higher prevalence of VI in the older population, items requiring vision were omitted resulting in a maximum score of 22[29]. The cut‐off value of 17 indicated the possible presence of cognitive impairment with a sensitivity of 84.9 and specificity of 82.1[29].
2) MoCA is also a test that measures global cognitive function with an additional domain of the executive function[30].Compared to M‐MSE, MoCA is a better measure of cognitive function because it has good detection of cognitive heterogeneity[31]. MoCA was translated into the Malay language and the reported α‐coefficient was 0.69[26]. A similar principle of eliminating items requiring vision was used for MoCA, leaving a total score of 22 with a cut‐off score of 18 indicating the possible presence of cognitive impairment[32‐33].
3) DS subtest of WAIS‐III was used to test information processing which includes visual scanning, visual‐spatial analysis, visual‐motor integration, and incidental learning element[22,34].
4) Covariates included in this study were age (in years),gender, and education attainment (no formal education;primary school, secondary school; tertiary education).
Statistical AnalysisData analysis was performed using SPSS version 23 (IBM SPSS 23 for Windows). The normality tests showed that all the parameters were normally distributed(P>0.05). For continuous data analysis, Pearson correlation was performed to determine the correlation between distance and near VA with age, M‐MSE, M‐MoCA, and DS scores.Multiple linear regression was carried out on variables withP<0.20 (Pearson correlation) to determine the association between vision and cognitive function scores, adjusting age,gender, and education level[35].
For categorical data analysis, the categorization of VI was made based on habitual distance VA and near VA in the better eye.No vision impairment (NVI) was defined as VA≤0.30 logMAR and VI as VA>0.30 logMAR. For near VA, NVI was defined as VA≤0.8 M and VI as VA>0.8 M. For M‐MSE, a score >17 was categorized as high and ≤17 was categorized as low[29]. For M‐MoCA, a score of >18 was categorized as high and ≤18 was categorized as low. The raw score of DS was converted into a scaled score whereby a score ≥5 was defined as good and a score <5 as poor, respectively[27].
Kendall’s Tau‐b was performed to determine the correlations between distance and near VI and NVI with gender, education level, good and poor cognitive functions (high/low M‐MSE,high/low M‐MoCA and good/poor DS). Multivariate logistic regression was carried out on a variable withP<0.20 (Kendall’s Tau‐b) to determine the association between vision and cognitive function, adjusting age, gender, and education level[35].
RESULTS
Baseline Characteristics of the Study SampleA total of 230 subjects participated in this study. However, eight were excluded due to the M‐MSE score being less than 14 and, 13 other participants were excluded due to incomplete data. Therefore, data obtained from 209 participants were analyzed in this study. The participants’ socio‐demographic characteristics, mean VA and vision category and mean cognitive functions scores and category are summarized in Table 1. The majority of the participants were female (56.9%)and mainly of Malaysian Chinese ethnicity (51.2%). Overall,the NVI was higher in both habitual distance VA (logMAR)and habitual near VA (M) with 74.6% and 58.9%, respectively.The M‐MSE blind score showed high among 154 participants,while 170 participants have a low M‐MoCA‐blind score. Of the 209 participants, 174 (83.3%) have a good DS score. Both Pearson correlation and Kendall’s Tau‐b analysis showed a significant correlation between vision and cognitive function(P<0.20), except for habitual distance VA with M‐MSE score(rτ=0.04,P=0.60).
Association Between Vision and Cognitive FunctionTable 2 shows the crude and adjusted multiple linear regression between habitual distance VA, habitual near VA and cognitive functions. Poor habitual distance VA was significantly associated with a low M‐MSE score (β=‐0.01,P=0.03), however,the association did not persist after adjusting the age, gender,and education level. There was also a significant association between poor habitual distance and near VA with a low M‐MoCA score (distance VAβ=‐0.01,P=0.00; near VAβ=‐0.03,P=0.00), but this association did not persevere after the adjusted age, gender, and education level. Both poor habitual distance and near VA were also significantly associated with low DS score (distanceβ=‐0.02,P=0.00; nearβ=‐0.05,P=0.00), and the association remained significant even after adjustment for age, gender and education level were made (distanceβ=‐0.01,P=0.02, nearβ=‐0.05,P=0.00).

Table 1 Socio-demographic characteristics, vision and cognitive functions of participants
Association Between the Status of Vision Impairment and Reduced Cognitive FunctionsDistance VI was found to be significantly associated with a poor DS score and the association remained significant after adjustment for age,gender and education level [odds ratio (OR)=2.84, 95%confidence interval (CI), 1.10‐7.33,P=0.03). Similarly, near VI was also significantly associated with poor DS score and the association remained significant after adjustment for age,gender, and education level (OR=3.32, 95%CI, 1.28‐8.59).There was a significant association between near VI and low M‐MoCA score, but it did not persist after adjusting for age,gender, and education level (Table 3).
DISCUSSION
In this study, we investigated the association between poor distance and near VA with cognitive function measured using M‐MSE, M‐MoCA and DS. It was found that poor habitual distance and near VA are significantly associated with lowM‐MSE score, M‐MoCA score, and DS score. When age,gender and education level are considered, the association remained significant for DS only. When distance and near VA were analyzed by category of vision impairment, poor DS is the only cognitive function that was found to be associated with vision impairment based on distance and near vision.

Table 2 Multiple linear regression between habitual distance VA, habitual near VA and cognitive functions
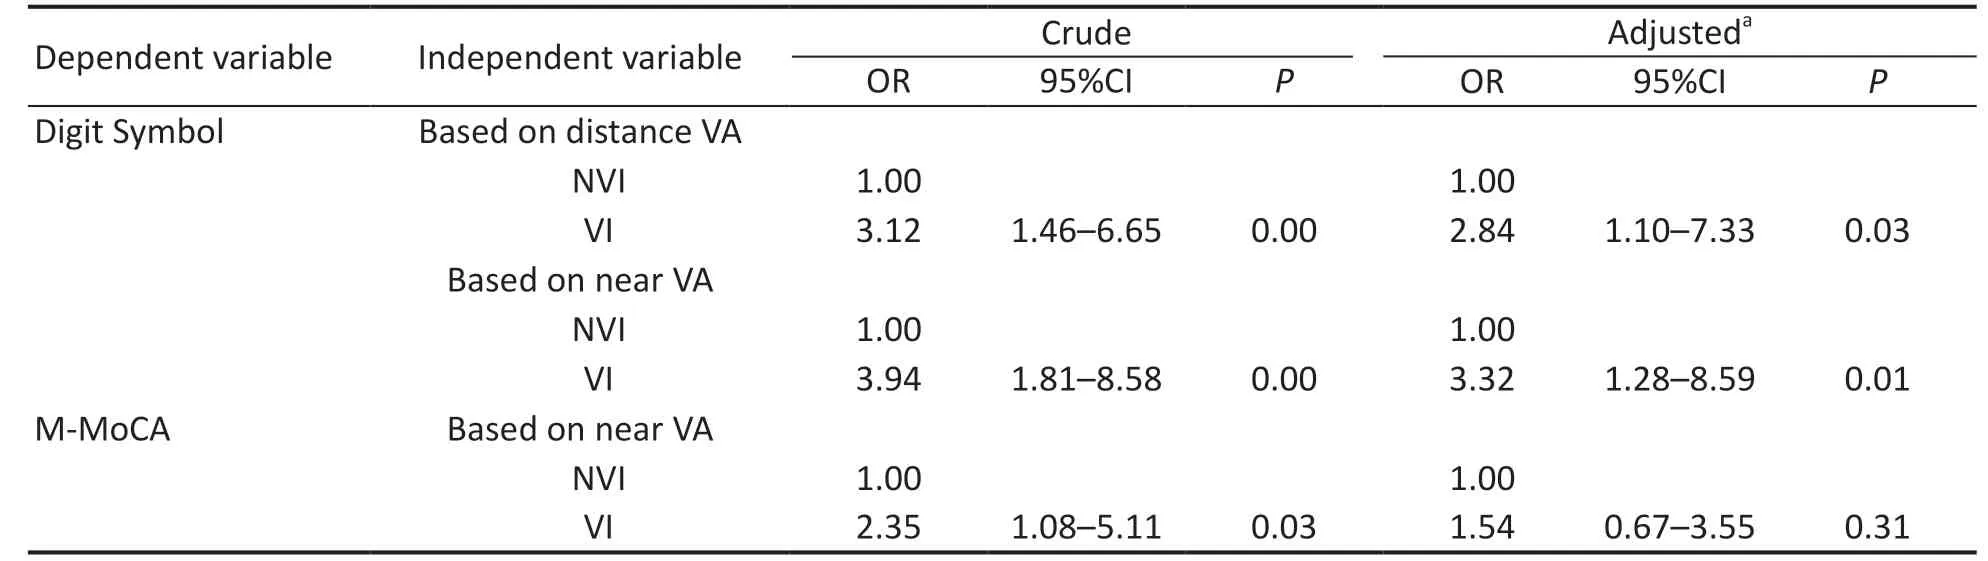
Table 3 Multivariate logistic regression between category of vision impairment and cognitive function
Our findings were found to be parallel with a study of Reyes‐Ortizet al[36], where no association between distance VI(VA≥20/60) and declined cognitive were found among non‐institutionalized Mexican Americans aged 65 and older using M‐MSE. However, a previous study that analyzed cross‐sectional and longitudinal data found a significant association between worse distance VA and M‐MSE scores[16]. The obvious difference reported in Zhenget al[16]study as compared to Reyez‐Ortizet al[36]and our study could be due to the study design. The findings of this study were also in contrast to those reported by Effendi‐Tenanget al[33], where they found an association between distance VI and poor MoCA score.Although both studies were performed in Malaysia, the sample population were different where Effendi‐Tenanget al[33]recruited older adults with a minimum age of 55 from two urban districts in Kuala Lumpur (9thmost populated state in Malaysia, 1773.9 population in thousands)[23], whilst our study recruited older adults aged 60 and above from both urban and rural districts in the state of Selangor.
In a clinical setting, it is more common to categorize VI based on distance VA. However, near VA is also important because impaired near vision could affect daily activities such as reading. In our study, no association was found between habitual near VA with M‐MSE or M‐MoCA. Our finding is in contrast with a study by Spiereret al[14]that reported a significant correlation between good near VA and high M‐MSE score (β=‐4.32,P<0.001). Subjects with good near VA on the Jaeger chart (≤J3) were 2.43 times more likely to have a high M‐MSE score. The subjects in Spiereret al[14]study were much older with a mean age difference of 10y from our study.Moreover, about two‐thirds of the subjects in their study were female. Nagaratnamet al[37]reported that the M‐MSE scores start to decline between the age of 29 to 105y, with the highest decline between ages 84 and 104y. It is possible that the difference in subjects’ mean age contributes to the difference in our findings.
Another aspect of cognitive function involving information processing was measured using DS. There was a significant association between poor habitual distance VA with poor DS score after adjusting to age, gender, and education level. This is comparable to Swenoret al[18], which reported VI (VA>20/40)was significantly associated with low DS scores among community‐dwelling and high‐physical functioning older adults. Similar findings were also reported in a study by Chenet al[15], whereby VI (VA>20/40) was associated with a poor DS score (β=‐5.1,P=0.006) and subjects with poor vision had a 2.8 times higher risk of cognitive decline (OR=2.8, 95%CI,1.1‐6.7).In addition, poor habitual near VA was also found to be significantly associated with poor DS scores following adjustment for age, gender, and education level. Similarly,Hunt and Bassi[12]demonstrated a significant association between reduced near VA and low DS scores in young and older adult subjects (r=‐0.314,P<0.001). They also suggested that reduced near VA may slow down the processing speed during visual scanning and affect visual perception, thus increasing performance time and errors made. In addition,they also noted that symbols may not be readily encoded into memory because of the reduced VA, and consequently,subjects may have had to scan the symbols more frequently.Comparable findings were equally reported by Chenet al[15], in which poor near VA (VA<20/40) was significantly associated with poor DS score (β=‐3.8,P=0.004) among older people aged 60 and older, whereas poor near VA had a higher risk for cognitive decline after adjustment for demographic,socioeconomic factors, general health condition and behavior.However, there was no significant association between poor near VA and poor DS scores after further adjustment for self‐reported hearing impairment and physical limitations. Clayet al[38]suggested that ageing was associated with a decline in visual function that could subsequently lead to slower visual processing speed. This in turn could result in a greater decline in memory span and general intellectual abilities.It is also notable that our study had a low response rate from the older age group (≥75) due to morbidity and disability issues as data collection was done at specific community centres. However, an advantage was that the mean age of the subjects who participated in this study was close to the average life expectancy in Malaysia. Poor vision was found to be significantly associated with information processing, however,may not be able to generalize the global cognitive functioning of Malaysian older adults.
In summary, we are able to determine the association between vision and cognitive function using M‐MSE and M‐MoCA tests that have been translated and validated into the Malay language. The findings of this study can be generalized to the Malaysian population since the sample population was chosen from one of the states in Malaysia that has the highest prevalence of the older population. The analysis was adjusted for education level, which is an important covariate because the older population as generally Malaysian had a lower level of education compared to the other developed countries.Nevertheless, the outcome of this can be utilized by eye health professionals to promote the preservation of good vision in maintaining cognitive function throughout life. Additional research would be necessary for a better understanding of longitudinal and fundamental relationships between visual and cognitive decline.
ACKNOWLEDGEMENTS
We acknowledge the contributions of the co‐researchers,research assistants, enumerators, participants, their family members, community leaders and the local authorities for their cooperation throughout the recruitment and data collection processes.
Foundations:Supported by the Ministry of Higher Education Malaysia Long‐Term Research Grant Scheme (LRGS/BU/2012/UKM‐UKM/K/01); Cabaran Perdana Grant Scheme(DCP‐2017‐002/1).
Conflicts of Interest: Mohammed Z,None;Kee QT,None;Fadzil NM,None;Abd Rahman MH,None;Din NC,None;Mariappan V,None;Shahar S,None.
杂志排行

International Journal of Ophthalmology的其它文章
- Visual perception alterations in COVID-19: a preliminary study
- COVID-19 pandemic impact on ocular trauma in a tertiary hospital
- Apolipoprotein A1 suppresses the hypoxia-induced angiogenesis of human retinal endothelial cells by targeting PlGF
- Comparison of vegetable oils on the uptake of lutein and zeaxanthin by ARPE-19 cells
- Identifying a novel frameshift pathogenic variant in a Chinese family with neurofibromatosis type 1 and review of literature
- Recurrence risk factors of intravitreal ranibizumab monotherapy in retinopathy of prematurity: a retrospective study at one center