Solid–gas interface thermal conductance for the thermal barrier coating with surface roughness: The confinement effect
2022-12-28XueZhao赵雪andJinWuJiang江进武
Xue Zhao(赵雪) and Jin-Wu Jiang(江进武)
1Shanghai Key Laboratory of Mechanics in Energy Engineering,Shanghai Institute of Applied Mathematics and Mechanics,School of Mechanics and Engineering Science,Shanghai University,Shanghai 200072,China
2Zhejiang Laboratory,Hangzhou 311100,China
Keywords: interface thermal conductance,thermal barrier coating,solid–gas interface,confinement effect
1. Introduction
Thermal barrier coating (TBC) is widely used in gas turbine engines.[1]TBC can reduce surface temperature of metal alloy substrates.[2]Higher operating temperature can increase the engine efficiency and extend the service time of the components.[3,4]There are two usual methods for spraying TBC on gas turbine components, i.e., air plasma spray(APS)[5]and electron beam physical vapor deposition (EBPVD).[6]There are plenty of intercolumnar pore structures in TBC layers prepared by EB-PVD,[7]and this intercolumnar pore structure is perpendicular to the coating plane.[8,9]
This intercolumnar pore can influence the TBC interface. It is found that the elongated intercolumnar pore created by the EB-PVD enhances the flexibility of the coating on the substrate plane and improves the lifetime of the TBC.[7]Zhaoet al.studied the effect of the pore volume fraction on the silicate melt infiltration in yttria-stabilized zirconia(YSZ)TBC.[10]Zhanget al.found that the infiltrated calcium magnesium aluminosilicate melt can solidify and occupy the internal space in the EB-PVD coated columnar, which causes significant deterioration in the strain tolerance and the insulation performance.[11]The pore’s microstructure not only affects the mechanical properties but also has strong effects on the interface heat transfer of TBC.[12–14]The YSZ coating is usually exposed to high-temperature and high-pressure gases,so the heat transfer at the interface between the TBC and the hot gas is important.
Kapitza discovered the temperature jump at the interface between solid and liquid,resulting in the temperature discontinuity at the interface.[15]Chenet al.comparatively measured the heat transport of graphene monolayers suspended in vacuum and air by Raman experiments, and they obtained the interface thermal conductance between graphene and air.[16]Chenget al.studied the heat loss rate at the nanowire-air interface by laser thermography and illustrated a general scaling relationship for gaseous heat dissipation from nanostructures.[17]The molecular dynamic (MD) simulation has been widely used to study the heat transfer of microstructures.[18–20]Markvoortet al.performed MD simulations to study the wetting effect on the heat transfer properties of the solid–gas interface.[21]Several works found that a better mass matching between the solid and gas can improve the efficiency of the heat exchange at the solid–gas interface.[22,23]Zhanget al.investigated the temperature jump at rough solid–gas interfaces, and the results show that the surface roughness is beneficial for the energy exchange at the solid–gas interface.[24]Some other effects on the solid–gas interface thermal conductance have also been studied, including the interface bonding strength[25,26]and the organic selfassembled monolayer.[27,28]
It has been proved that the porous structure of the YSZ has important effects on thermal conductivity of solid YSZ coating.[29]However, porous structure of the YSZ has limited effects on the interface thermal conductance between YSZ and gas, because the interface thermal conductance is dominated by the properties of the interface,especially the coupling strength between the solid and the gas.[28]
In this paper, we study the effect of surface roughness on the thermal conductance of the YSZ–gas interface, where the surface roughness is represented by rectangular pores. We focus on the pore’s geometry effect on the interface thermal conductance. The interface thermal conductance is determined by two major effects: the actual contact area effect and the confinement effect. More specifically,the increase of the pore depth will increase the actual contact area of the interface between the YSZ and gas, resulting in the enhancement of the interface thermal conductance. In contrast, the geometry-induced confinement effect can greatly reduce the thermal conductance for the YSZ–gas interface with narrower pores.
2. Structure and simulation details
The schematic structure of the simulation model is shown in Fig. 1. We consider the zirconia stabilized by 8 wt%yttria. The lattice constants of the YSZ area= 7.187 ˚A,b=12.448 ˚A, andc=8.802 ˚A. The size of the YSZ is denoted by three integers (nx,ny,nz), which are the number of the unit cell along thex,yandzdirections. The structure in our simulation has(nx,ny,nz)=(14,2,17).The similar size is used in the MD simulation for the heat transfer process across the solid–gas or solid-liquid interface.[22,30]Then the shape of the surface roughness can be sinusoidal function,triangle and rectangle.[31–33]To mimic the experimental sample,[34]we use a rectangular pore on the surface of the YSZ to represent the surface roughness. The pore is described by the depthdand the widthw. Here the rectangular pore is used to mimic the roughness of the YSZ surface. The top of the YSZ is filled with gas molecules,which contain 80%N2and 20%O2. The height of the gas region is 110 ˚A.which includes the Coulomb electrostatic interaction, the short-range repulsion between ions, and the long-range van der Waals interaction. Here,qiandqjare the charges of ionsiandj,andrijis the distance between ionsiandj. The potential parametersAi j,ρ,andCijare listed in Table 1,which are from Ref.[36].
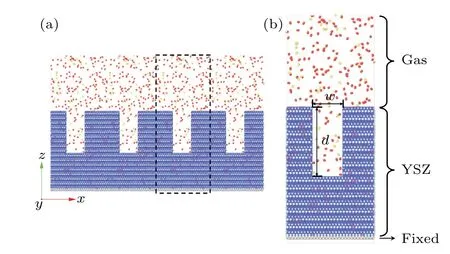
Fig.1. Structure of the TBC-gas interface: (a)surface roughness of the TBC,(b)model for the molecular dynamics simulation.

The intermolecular interaction of gas molecules in this paper is described by the 12–6 Lennard–Jones(LJ)potential
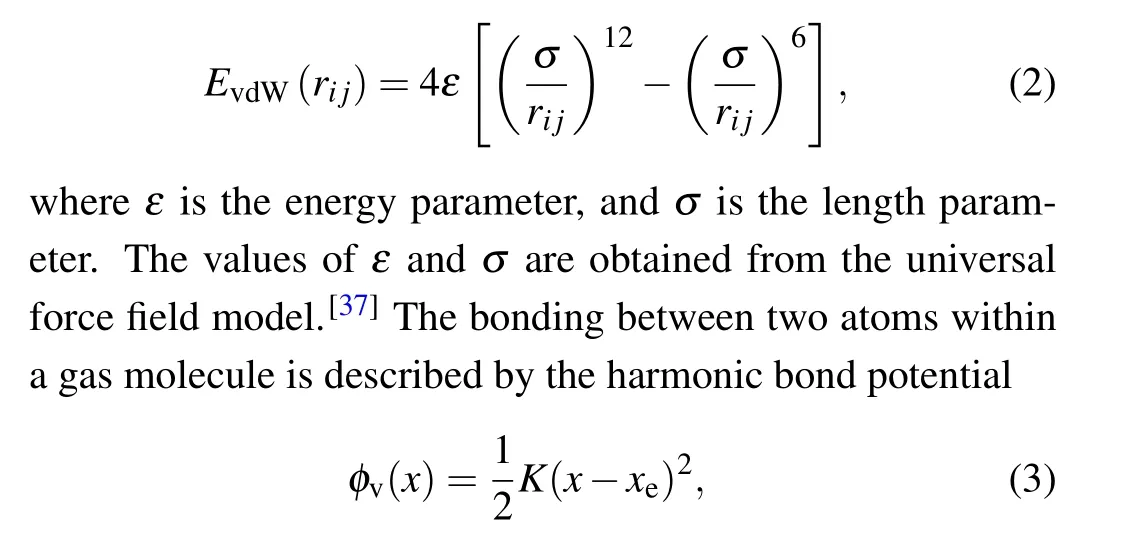
whereKis the force constant, andxeis the equilibrium bond length of N2or O2. The values ofKandxeare obtained from the universal force field model.[37]The potential parameters of the gas are listed in Table 2. The Lorentz–Berthelot combining rule is used to calculate the potential parameters for the interaction between elements.[38,39]The potential parameters of the interface between the YSZ and gas are listed in Table 3.The cutoff distance for all LJ interactions is 10 ˚A in this work.

Table 1. Buckingham potential parameters for YSZ.
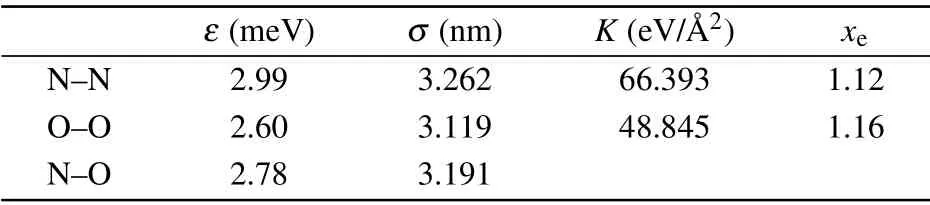
Table 2. Potential parameters for nitrogen(N)and oxygen(O).

Table 3. Lennard–Jones potential parameters for the YSZ–gas interface.
The simulation is performed in two steps. Firstly, the solid is thermalized at 300 K within the NPT ensemble,while the gas is thermalized at 600 K within the NVT ensemble for 0.4 ns. The Nose–Hoover thermostat is used to realize constant temperature and pressure.[40,41]Secondly,the solid is allowed to evolve within the NVT ensemble at a constant temperature of 300 K.The gas evolves within the NVE ensemble and the thermal energy of the gas will dissipate into the YSZ during the simulation. The temperature of the gas will decrease gradually. The time dependence of the gas temperature is recorded to extract the interface thermal conductance.
Periodic boundary conditions are used in MD simulations. The bottom region of the YSZ is fixed to avoid the shift of the solid during the simulation. All simulations are performed with LAMMPS,[42]and visualized by OVITO.[43]The equation of motion is integrated by the velocity Verlet algorithm with time steps of 1.0 fs.
3. Results and discussion
3.1. MD simulation results
The thermal conductance is calculated by the heat dissipation method.[44]The solid is set to a constant low temperatureTc. The high temperature of the gas(Th)will decrease and approach to the solid’s temperature,as a result of the heat dissipation process.According to Fourier’s law and the definition of heat capacity,the gas temperatureThis governed by[44]

whereCis the specific heat capacity,ρis the mass density,dis the thickness of solid,andGis the Kapitza conductance.From Eq.(4), the temperature difference between the solid and gas can be obtained as follows:

where ∆T0=Th(0)−Tc(0)is the initial temperature difference.The characteristic timeτis[44]
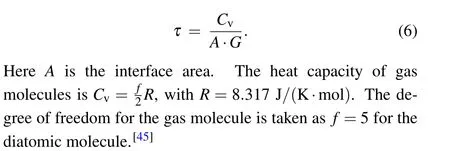
In this work,the characteristic timeτis obtained by fitting MD simulation results to Eq. (5). Then the interface thermal conductance is calculated from Eq.(6). Figure 2(a)shows the MD results of the time-dependent temperature for the gas and YSZ without pore defect. Figure 2(b)shows that the numerical results can be well fitted to the exponential function for the temperature difference. The structure of the YSZ has(nx,ny,nz)=(41,24,3)in this figure. The height of the gas region is 100 ˚A.The fitted characteristic time isτ=290.1 ps. The resultant interface thermal conductance is 0.0161 MW/(m2·K),which is comparable with the values of other solid–gas interfaces as listed in Table 4. We have used the gas density of 0.647 kg/m3, which corresponds to the ambient pressure. To reduce the statistical error,we have repeated five independent MD simulations for each model. The averaged value is used as the predicted result. The maximum value of the error is less than 10%.
It should be noted that thermal radiation is an important factor for the thermal conductance, especially in a high temperature background.[46,47]In this work,we consider the contribution of the lattice heat transfer to the interface thermal conductance of the solid–gas interface.

Table 4. The value of the interface thermal conductance of the YSZ–gas interface compared with other solid–gas interfaces.

Fig.2. The heat dissipation process: (a)the time-dependent temperature of the YSZ and gas,(b)the temperature difference between the YSZ and gas.
3.2. Initial temperature difference
We first study the effect of the initial temperature difference ∆T0on the thermal conductance of the YSZ–gas interface. For this set of simulations, the structure of the YSZ is(nx,ny,nz)=(27,16,2).The height of the gas region is 100 ˚A.The gas density is 233.390 kg/m3. The initial temperature of the gas takes 400, 500, 600, 700 and 800 K.The relation between the initial temperature and the interface thermal conductance is shown in Fig.3. The results indicate that the interface thermal conductance increases gradually with increasing initial temperature difference. Because the increase in temperature results in higher kinetic energy of gas molecules,the collision frequency between the gas molecules and the solid wall is increased, which can promote the heat exchange. Hence,the interface thermal conductivity is increased. The nonlinear scattering among gas molecules is also one possible reason for the initial temperature dependence of the interface thermal conductance. We thus choose a proper value of ∆T0=300 K in the following calculations.

Fig.3. The relation between the interface thermal conductance and the initial temperature differences.
3.3. Density effect
We study the effect of density on the interface thermal conductance of the YSZ–gas interface. For this set of MD simulations,we have(nx,ny,nz)=(27,16,2). The height of the gas region is 100 ˚A.The gas density takes 64.64,129.29,161.63,193.93,and 233.39 kg/m3. The value of the interface thermal conductance is shown in Fig.4.

Fig.4. The relation between the interface thermal conductance and the gas density.
We find that the interface thermal conductance increases with the increase of the gas density,because there are more gas molecules colliding with the YSZ surface for larger gas density, leading to stronger interface thermal transport. Furthermore,the collision among the gas molecules becomes stronger for larger gas density due to the nonlinear effect.
3.4. Effect of pore size
Figure 5(a) shows the thermal conductance of the YSZ–gas interface with pores of different depths. For this set of simulations, the depth of the pore isd=NdcwithNd=1, 2,3, 6, 9, 12, and 15. The widths of the pore isw=NwawithNw=1, 3, and 7. We note thataandcare the lattice constants as presented in the above section. The density of the gas is 233.511 kg/m3for these simulations. This density value is much larger than the gas density under the ambient condition,which saves the simulation cost.
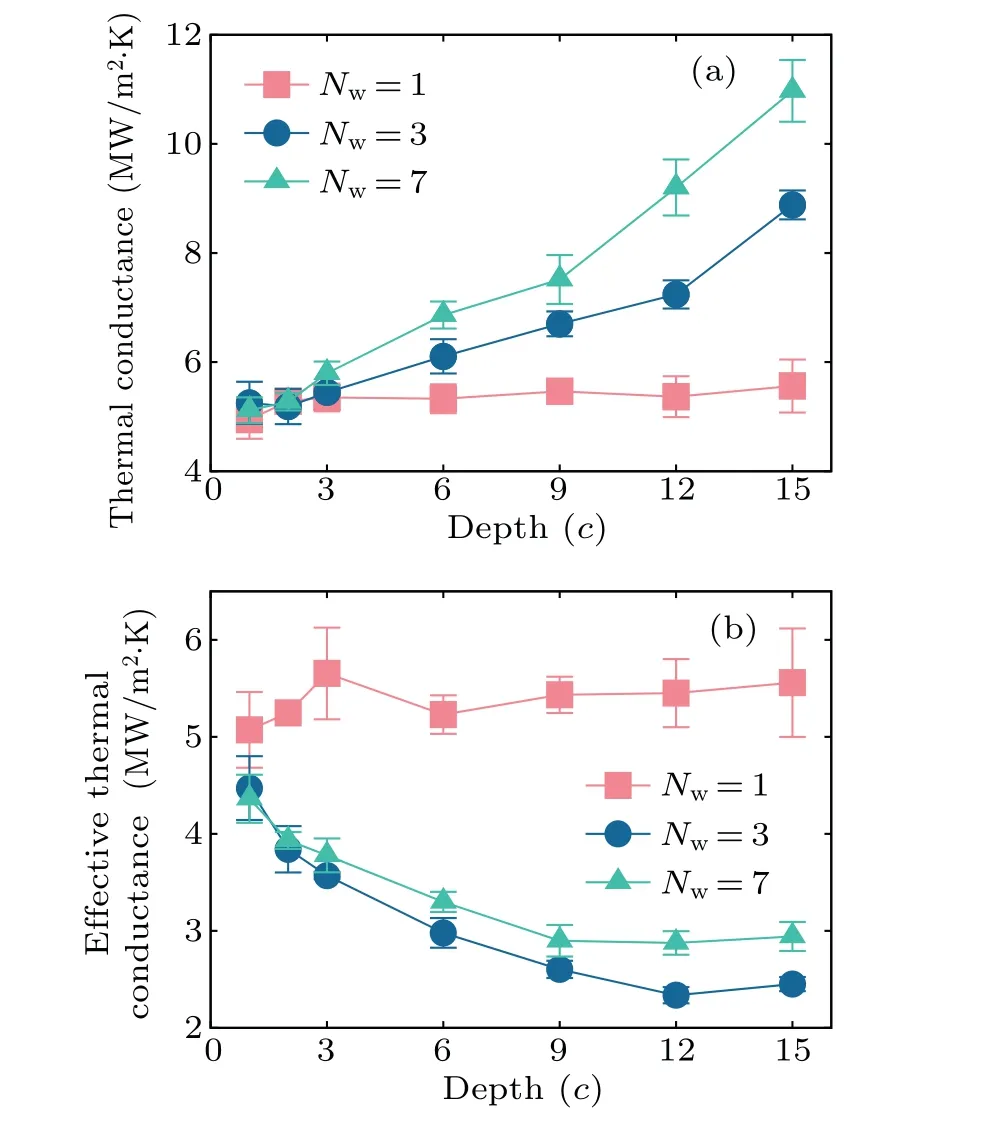
Fig.5. The depth dependence for(a)the thermal conductance and(b)the effective thermal conductance.

Figure 6 shows the interface thermal conductance of the YSZ–gas interface of different pore widths. For this set of simulations, the width isw=NwawithNw=1, 2, 3, 5, 7,and 10. The depth isd=NdcwithNd=2, 9, and 15. We find that the interface thermal conductance remains almost unchanged with increasing width when the depth is a small value ofNd=2. This is because the actual contact area keeps the same for the surface with different pore depths. However,for larger pore depth ofNd=9 and 15,the interface thermal conductance increases considerably with the increase of the pore width, though the actual contact area is not changed. This is due to the confinement effect, which is discussed in the next section.

Fig.6. Effect of the pore width on the interface thermal conductance.
3.5. Confinement effect
From the above discussions,we have understood that the interface thermal conductance can be enhanced by increasing the actual contact area,especially for larger pore depths.However, we have also found that the interface thermal conductance can be affected by different pore widths, although the actual contact area is the same for pores with different widths.Besides the actual contact area effect, the geometry-induced confinement effect is also important for the heat dissipation through the interface between the solid and gas.
To explain the confinement effect, we monitor the motion of the gas molecules inside the pore. At timet=0, all molecules in the pore are marked. These marked molecules will exchange with other molecules outside the pore, so the ratio of the marked molecules inside the pore will decrease with time evolution. Figure 7(a) shows the time dependence for the ratio of the marked molecules,which decreases gradually with time.The decrease of the ratio is slower for narrower pores, because the gas molecules in narrower pores are more difficult to exchange with external molecules. This is a direct result from the confinement effect. The time history of the ratio of the marked molecules can be fitted to the exponential functiony=c1+c2exp(−t/τcon),withc1,c2,andτconas fitting parameters. The parameterτconis the characteristic time for the confinement effect, which represents the typical time for the gas molecule to stay in the pore. A larger value ofτconindicates that the gas molecule is confined in the pore for a longer time, which means that the confinement effect is stronger. Figure 7(b)shows that the confinement time is larger for pores with smaller widths. The confinement time is also sensitive to the pore depth. We thus introduce the width to depth ratio,γ=w/d, to estimate the degree of confinement for the pore. Figure 7(c)shows that the confinement time decreases exponentially with the structural ratioγ.

Fig.7. Confinement effect on the interface thermal conductance: (a)time dependence for the ratio of the marked gas molecules left inside the pore,(b)the pore width dependence for the confinement characteristic time, (c)the confinement characteristic time versus the width-to-depth ratio.
A longer confinement time implies that the gas molecules confined in the pore exchange their thermal energy with external molecules more slowly.As a result,the inner surface of the pore makes less contribution to the heat dissipation process.This is the origin for the reduction of the interface thermal conductance by the confinement effect.According to Fig.7(c),the interface thermal conductance is larger for the pore with a larger structural ratioγ.
As a result of the confinement effect, the temperature is not uniform for the molecules confined inside the pore. To describe this temperature nonuniform phenomenon,we divide the pore into the top region and the bottom region, and calculate the temperature for these two regions. Figure 8 shows that the temperature of the top region is obviously higher than that of the bottom region, which further confirms the above confinement effect.
4. Conclusions
In summary, we have studied the heat transfer on the YSZ–gas interface with the heat dissipation method by MD simulations. We examine the effect of the microstructure of the pore at the interface on the interface thermal conductance.It is found that the interface thermal conductance increases gradually with increasing initial temperature difference and gas density. We explore two important mechanisms for the interface thermal conductance: (i) The increase of the actual contact area at the YSZ–gas interface can enhance the interface thermal conductance.As a result,the interface with a pore of larger depth has larger interface thermal conductance,while the pore width is less important. (ii) The geometry-induced confinement effect will greatly reduce the interface thermal conductance. We disclose that the confinement strength decreases exponentially with the width-to-depth ratio of the pore.
Acknowledgements
Project supported by the National Natural Science Foundation of China(Grant Nos.11822206 and 12072182),the Innovation Program of the Shanghai Municipal Education Commission (Grant No. 2017-01-07-00-09-E00019), the Key Research Project of Zhejiang Laboratory,and the National Supercomputing Center in Zhengzhou(Grant No.2021PE0AC02).
杂志排行

Chinese Physics B的其它文章
- Editorial:Celebrating the 30 Wonderful Year Journey of Chinese Physics B
- Attosecond spectroscopy for filming the ultrafast movies of atoms,molecules and solids
- Advances of phononics in 20122022
- A sport and a pastime: Model design and computation in quantum many-body systems
- Molecular beam epitaxy growth of quantum devices
- Single-molecular methodologies for the physical biology of protein machines