Label-free trace detection of bio-molecules by liquid-interface assisted surface-enhanced Raman scattering using a microfluidic chip
2022-12-12ShiBaiXueliRenKotaroObataYoshihiroItoandKojiSugioka
Shi Bai, Xueli Ren, Kotaro Obata, Yoshihiro Ito and Koji Sugioka*
Keywords: femtosecond laser processing; LI-SERS; microfluidic chip; DNA; β-Amyloid
Introduction
Surface-enhanced Raman scattering (SERS), based on an optical near-field effect induced by the surface plasmon of noble metal nanoparticles or nanostructures excited by laser radiation, amplifies the Raman signals up to 1014times compared to regular Raman1-3. Owing to this much enhanced intensity, the SERS technique continues to attract growing interest for trace level detection and analysis of biomaterials such as imaging of organelles in a single cell, cancer cell tracking, and bio-marker identification1-4. Moreover, the SERS technique may be applied to the bio-medical field for disease diagnosis at an early stage and also in tumor therapy5-6. Although the enhancement factor of SERS typically ranges from 106-1010as a result of the use of novel SERS substrates and methods, single molecule detection by label-free SERS is impracticable because of SERS-blinking, the origin of this phenomenon being due to the escape of analyte molecules from hotspots7-8. Moreover, bio-molecules including deoxyribonucleic acid (DNA) and proteins,which, typically, have large molecular masses and complex structures, are difficult to detect directly by SERS and additional treatments with a SERS substrate are required to bind the bio-molecules in the hotspots.
Recently, a novel method using a microfluidic chip,termed liquid-interface assisted SERS (LI-SERS), has been proposed by our group, the approach achieving a SERS enhancement factor greater than 1014and realizing attomolar sensitivity for Rhodamine 6G (R6G) as a test sample9. Consequently, the LI-SERS method provides an enhancement factor much higher than regular SERS method (~106-108on average)10-12. The microfluidic SERS chip featured an Ag-Cu SERS substrate integrated in an embedded glass microchannel, which was fabricated by hybrid femtosecond (fs) laser processing10.Briefly, hybrid fs laser processing is successive implementation of different types of fs laser processing including three-dimensional (3-D) waveguide writing, fs laser assisted chemical etching, selective metallization, and two-photon polymerization13-15. The hybrid fs laser processing enables creating more complicated 3-D structures with enhanced functionalities for biochips, sensors and micro-electronic devices. In the glass microchannel fabricated by hybrid fs laser processing, we found that when the interface between the analyte solution and air on the SERS substrate in the microfluidic channel was irradiated by the Raman excitation laser, the LI-SERS intensity was increased by six orders of magnitude as compared with regular SERS. The mechanism of LI-SERS was attributed to the synergetic effect of the Marangoni flow which was induced by the laser irradiation to direct the analyte molecules to the hot spots and optical trapping of the collected molecules16-19. Consequently, the analyte molecules were immobilized on the SERS substrate and strong Raman scattering was achieved.
This study highlights to demonstrate that LI-SERS method is applicable for more practical use, specifically,trace detection of label-free bio-molecules with large molecular masses, including DNA bases, DNA sequences and β-Amyloid (Aβ). Owing to the ultrahigh sensitivity and self-immobilization of LI-SERS, discrimination of DNA bases and DNA sequences with a detection limit of 1 fM was obtained without the need for additional treatments featuring coupling or cross-linking agents.Moreover, the LI-SERS technique can detect concentrations of label-free Aβ, a biomarker of Alzheimer's disease, at levels below 1 pM, and with a linear correlation between the Raman signal and the Aβ concentration in the range 1 nM-1 pM being achieved. The label-free biosensing capability of LI-SERS offers great potential for the early-stage diagnosis of diseases in clinics.
Methods
Fabrication of microfluidic SERS chip
The configuration of the laser system used for fabrication is given in the Fig. 1. The glass microfluidic SERS chip was fabricated by hybrid fs laser processing9. First step is fabrication of 3-D microfluidic structure in a glass substrate (Foturan, Schott Glass Corp) according to the designed structure by fs laser assisted chemical etching,for which an infrared laser (CB5-06, CARBIDE) with an operating wavelength of 1030 nm and a repetition rate of 100 kHz was used. The laser beam was focused by objective lens (M Plan Apo NIR, Mitutoyo, numerical aperture(NA)=0.4) to a spot size of 3 μm in diameter to induce multiphoton absorption only at the focal volume. The focused laser beam was then scanned inside the glass substrate in 3-D. After the laser irradiation, the glass substrate was subjected to first annealing (the temperature was increased to 500 °C at 5 °C/min, kept for 1 hour, and then raised to 605 °C at 3 °C/min, kept for another hour). After naturally cooling down the annealed samples, 10% hydrofluoric acid (HF) solution was used for selective etching of the laser irradiated regions to create a 3-D microfluidic structure. By the annealing, the laser irradiated region was modified from the amorphous phase to the crystalline phase to increase the etching rate in diluted HF solution by about 40 times as compared with the unirradiated regions. Consequently, the laser irradiated regions can be preferentially etched away to create the 3-D microfluidic structure. Subsequently,the glass substrate underwent the second annealing to smooth the etched surfaces (the temperature was first increased to 500 °C at 5 °C/min, then raised to 620 °C at 3°C/min and then maintained for 1 h). Second step is selective metallization, for which a 150 μm2region at the bottom surface of the fabricated microchannel was ablated by the same fs laser. Cu electroless plating at 50 °C for 8 h followed by Ag electroless plating at 40 °C for 20 min selectively deposited an Ag-Cu film on the ablated region. The thickness of the coated metal film was 400 nm (~160 nm Cu bottom layer and ~240 nm Ag top layer), which was controlled by the plating time. Deposition of thicker metal film will increase the surface roughness which will make it difficult to create the fine metal nanostructure for SERS sensing. The last step is surface nanostructuring of the deposited metal thin film,for which the second harmonic of the linearly polarized fs laser (515 nm) produced by a lithium triborate (LBO)crystal was used to generate the periodic nanostructure,in other words, fs laser-induced periodic surface structures (fs-LIPSS). The laser beam focused to a diameter of 6 μm using an objective lens (M Plan Apo, Mitutoyo,NA=0.14) was scanned on the metal thin film for fs-LIPSS formation. The pulse width for both 1030 nm and 515 nm wavelengths was 233 fs.
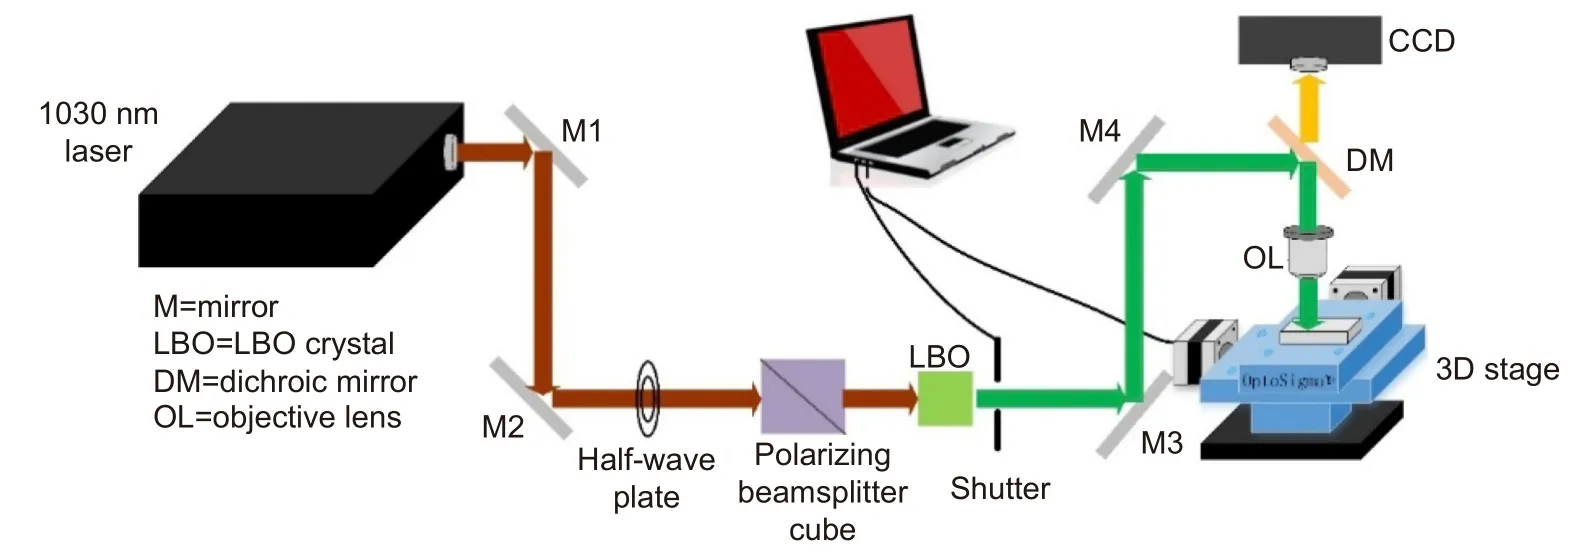
Fig. 1 | Schematic of laser fabrication system for microfluidic SERS chips. For generation of a second harmonic of 515 nm wavelength from 1030 nm and 233 fs laser, LBO was used. A half-wave plate and a polarizing beamsplitter cube are used to control laser energy. 3D precision motorized stage and an automatic shutter are controlled by the PC.
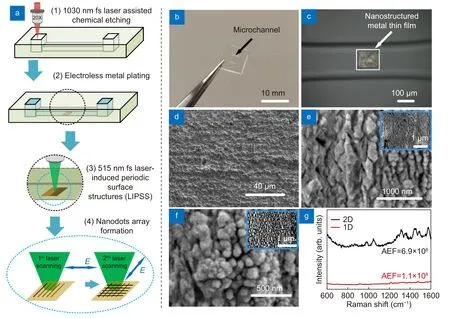
Fig. 2 | (a) Schematic of the fabrication procedure for the microfluidic SERS chip using hybrid fs laser processing. (1. Glass microfluidic chip fabricated by fs laser assisted chemical etching. 2. Femtosecond laser selective ablation at the bottom surface of the microchannel. 3. Selective metallization on the laser ablated region by electroless metal plating. 4. Nanostructuring on the metal film by fs LIPSS.) (b) Photograph of microfluidic SERS chip fabricated by hybrid fs laser processing. (c) Optical microscope image showing the SERS substrate formed at the bottom surface of the microchannel embedded in the glass substrate. SEM images of (d) original metal film, (e) ripples generated by 1st laser scanning and(f) nanodots generated by 2nd laser scanning (Insert: low magnification of SEM image). (g) Raman spectra of 10-9 M Rhodamine 6G (R6G) on 2-D(black) and 1-D (red) nanostructured SERS substrates.
Simulation of laser induced Marangoni flow
For simulation of Marangoni flow, fluid dynamics with laminar flow in conjugation with the heat transfer in fluids were adopted in the model. The model is also coupled of the nonisothermal flow and the Marangoni effect functions in COMSOL Multiphysics®. The boundary conditions for the heat transfer consisted of a boundary heat source as the laser heating source. The temperature at other contour boundaries was set to room temperature.
Instrumentation and characterization
Optical photographs of the metal film in the glass microchannel were acquired by a 3-D profiler (Zeta-20,KLA). The morphologies of the LIPSS structures were analyzed using field emission scanning electron microscopy (SEM) (Quattro, Thermo Scientific). The Raman spectra were collected by a customized Raman spectrometer (NRS-4500, JASCO) equipped with a microscope,a grating spectrometer (1800 grooves/mm), and laser excitation at 633 nm. The continuous wave laser of power 3 mW was focused by a 50× objective lens (NA=0.5) for an exposure time of 5 s.
For Raman measurements, we prepared the fresh biomolecules and conducted measurements immediately without any incubation in order to minimize the damage of the molecular structures. The deionized water was used as the solvent, because the accuracy of Raman spectrum will not be influenced by the buffer solution. More importantly, this arrangement is beneficial to directly compare the results with previous works which also used water as the solvent for the label-free SERS sensing of DNA and Aβ20-22.
Results and discussion
The glass microfluidic chip was fabricated by hybrid fs laser processing as shown in Fig. 2(a). The glass substrate is 10 × 10 × 2 mm3and the size of each microchannel is 2000 × 300 × 100 μm3, the microchannels being embedded 200 μm below the glass surface and connected to two open micro-reservoirs of size 500 × 500 × 350 μm3(Fig. 2(b)). Then, an Ag-Cu film (150 × 150 μm2)was formed selectively on the laser ablated region in the microchannel by Cu electroless metal plating and successive Ag electroless metal plating (Fig. 2(c) and 2(d)).On the metal film, 1-D and 2-D nanostructures were generated by the fs LIPSS method (Fig. 2(e) and 2(f)).Energy-dispersive X-ray spectroscopy analysis revealed that the nanostructured metal films maintained Ag-Cu structures (Fig. S1). The fs laser was converted to the second harmonic with a wavelength of 515 nm by an LBO crystal with linear polarization, the laser then being scanned on the metal film. The morphology of the original metal film is shown in Fig. 2(d), and Fig. 2(e) shows the morphology after the 1stlaser scanning with a laser fluence of 77.42 mJ/cm2and a scanning speed of 10 m/s.Due to the interference of surface plasmon polaritons induced by fs laser irradiation and the incident laser beam,a 1-D periodic nanostructure can be generated with a period of ~ 140 nm and a nanogroove width of ~ 40 nm23. Given that the period of the laser light is much smaller than half of the incident wavelength, the created nanostructure can be attributed to the high-spatial frequency LIPSS. The orientation of LIPSS is perpendicular to polarization direction of the incident beam. To increase the density of the nanostructures, a 2-D periodic nanostructure was generated by two-step laser scanning; after the formation of the 1-D nanostructures, the substrate was rotated by 90° and a second round of laser scanning was performed under the same processing conditions. Consequently, a 2-D nanostructure, in other words, a nanodot structure, was created, as shown in Fig.2(f). The mean size of nanodots was 104 nm with a standard deviation of 29 nm (see Supplementary information, Fig. S2). More importantly, the average width of the nanogap between the adjacent nanodots was ~ 40 nm, which could efficiently create hotspots in the nanogaps as a result of laser excitation. It can, therefore,be anticipated that when the analyte molecules enter the nanogaps, these molecules will be effectively excited because of the localized surface plasmon resonance and the electromagnetic coupling of the neighboring nanodots,thus providing high intensity SERS signals24,25. In Fig.2(g), experiments were performed to compare the relative performance of 2-D and 1-D SERS substrates. R6G(10-9M) was selected as a model analyte molecule to evaluate the SERS performance due to its large scattering cross-section. Based on the Raman results, the analytical enhancement factors (AEFs) of microfluidic SERS chips integrated with 2-D and 1-D periodic metal nanostructures were calculated. The AEFs may be obtained using the expressionAEF= (ISERS/IOR)/(CSERS/COR),whereISERSandIORcorrespond to the Raman intensities of R6G on the SERS substrate and on the glass, respectively, andCSERSandCORdenote the molar concentration of the R6G solution in the microfluidic SERS chip and on the glass surface, respectively4. Then, the AEF for the 2-D SERS substrate was calculated to be 6.9 × 10⁸,which was six times higher than the AEF for the 1-D SERS substrate. The reproducibility of this technique was evaluated by 1 μM R6G solution for ten microfluidic SERS chips. Raman spectra from ten chips shown in Fig.S3 give the relative standard deviation (RSD) of AEF as low as 10.1 for the peak at 604 cm-1. RSD of other main peaks ranges from 8.9% to 16.2% with the average of 11.7% (see Table S1 in Supplementary information). In addition, the relative standard deviation on a single SERS substrate was evaluated to be 8.88% by measuring the Raman spectra at 15 randomly selected acquisition points on the SERS substrate10. Meanwhile, the lifetime of the microfluidic SERS chip was estimated to be ~1 month in ambient conditions since the silver will be oxidized over time9. The oxidation can be inhibited to increase the lifetime by replacing Ag by Au, or using a protection layer (such as Pd layer) on silver nanostructure26.Therefore, the microfluidic SERS chip with a 2-D periodical metal nanostructure was used in subsequent experiments.
Next, we used the microfluidic SERS chips to measure the DNA bases by regular SERS and LI-SERS methods and compared their performances. Figure 3(a) and 3(c)show the schematics of regular SERS and LI-SERS measurements, respectively. For the SERS measurements, the analyte solution was injected into the microchannel so as to fill the microchannel with the analyte solution. The Raman excitation laser was focused on the SERS substrate to collect the Raman signals by the spectrometer.The regular SERS measurements were performed while the SERS substrate was covered with the solution. The liquid interface in the microchannel gradually moved towards the SERS substrate due to the spontaneous evaporation of liquid. When the liquid interface entered the spot of Raman excitation laser, the LI-SERS measurements started. The LI-SERS method can detect 1 fM(10-15M) of DNA bases as shown in Fig. 3(d), which is 9 orders of magnitude lower than ~ 1 μM for regular SERS(Fig. 3(b)). Although the detection limit of DNA bases is 100 times higher than 10 aM (10-17M) of R6G, the reduction rate of detection limit of the DNA bases compared with the regular SERS is 3 orders of magnitude higher than that of R6G. Importantly, the detection limit will be further improved by optimizing the metal nanostructures, specifically, decreasing the distance between each metal nanodots. In addition, the Raman peaks of each base can be labeled to be readily discriminated. It is worth mentioning that the Raman peaks of bases labeled in Fig. 3(b) and 3(d) are slightly shifted since the SERS spectrum is highly related to the orientation of molecules on the substrate27,28. In the regular SERS measurement, the molecules are self-assembled on the substrate,while for LI-SERS, the molecules are aggregated on the substrate by Marangoni flow. Therefore, the orientation and distribution of molecules in SERS and LI-SERS are different, resulting in a shift of Raman peaks as well as selective enhancement of specific peaks. In particular, the shift and selective enhancement become more obvious when the concentration of analyte is very close to the detection limit, which is the case of Fig. 3(b) and 3(d). Such huge improvement of detection limit is attributed to the local aggregation of analyte molecules induced by the Marangoni flow associated with laser heating. Specifically, in the LI-SERS method, the analyte molecules are first collected to the hotspots by the Marangoni flow generated by the Raman excitation laser heating. The collected molecules are then immobilized on the metal nanostructure due to the optical trapping19. The simultaneous collection and optical trapping enable label-free DNA sensing with high sensitivity without pretreatment using coupling or cross-linking agents.
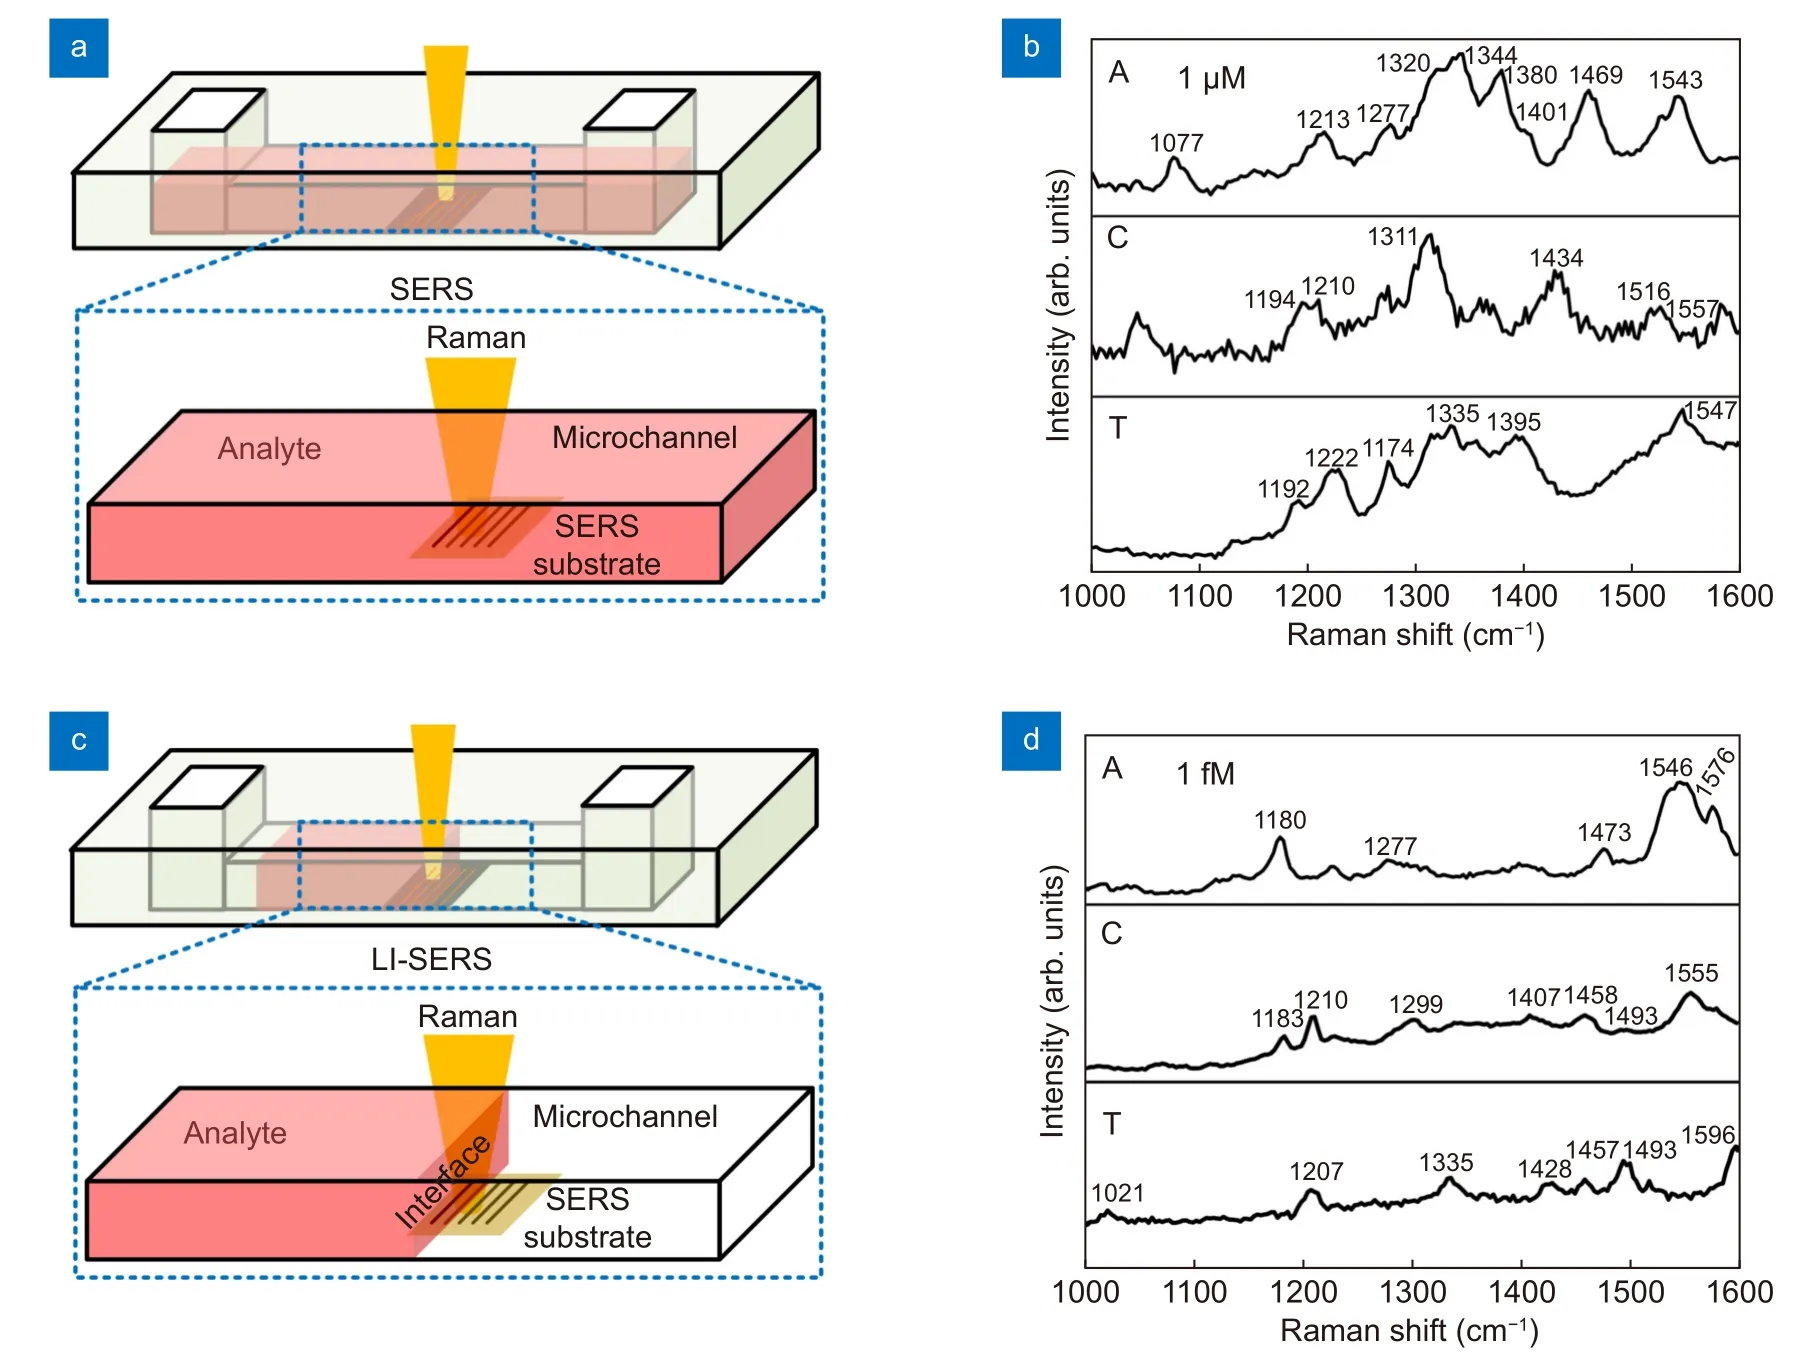
Fig. 3 | (a, c) Schematics for regular SERS and LI-SERS measurements of analyte solutions in the microchannel, respectively. (b, d) Raman spectra of DNA bases, adenine (A) and cytosine, (C) and thymine (T), measured using microfluidic SERS chips with 2-D nanostructured SERS substrates by regular SERS for 1 μM concentration and LI-SERS for 1 fM concentration, respectively.
In Fig. 4(a), we simulated the Marangoni flow induced by laser localized heating in anx-yplane (plane perpendicular to the incident laser axis) near the liquid interface to illustrate the extraordinary enhancement by LI-SERS. The laser beam is focused on the SERS substrate at the interface (in Fig. 4(b), the interface is labeled by cyan dash, which is located at the center of laser spot.If the interface is even a little away from the laser spot,Raman signal intensities drastically decrease due to rapid disappearance of the Marangoni effect). When the liquid interface is irradiated by laser beam at the current SERS condition (laser power of 3 mW, exposure time of 5 s, 50× objective lens (NA= 0.5)) (pointed with a black arrow in Fig. 4(a)), the temperature is increased to 70 °C at the laser spot, producing a temperature gradient (ΔT)of about 50 °C near the liquid interface. This temperature gradient induces the Marangoni flow around the laser spot, which creates two vortexes on the SERS substrate to redistribute the pressure at the liquid interface.Thus, it drives the mass flow from high to low pressure regions, which accelerate the transport of solute material to the laser spot for collection of analyte molecules at the laser focal point (illustrates by white arrows in Fig. 4(a)).Marangoni number (Ma) which indicates the intension of Marangoni effect can be calculated by29

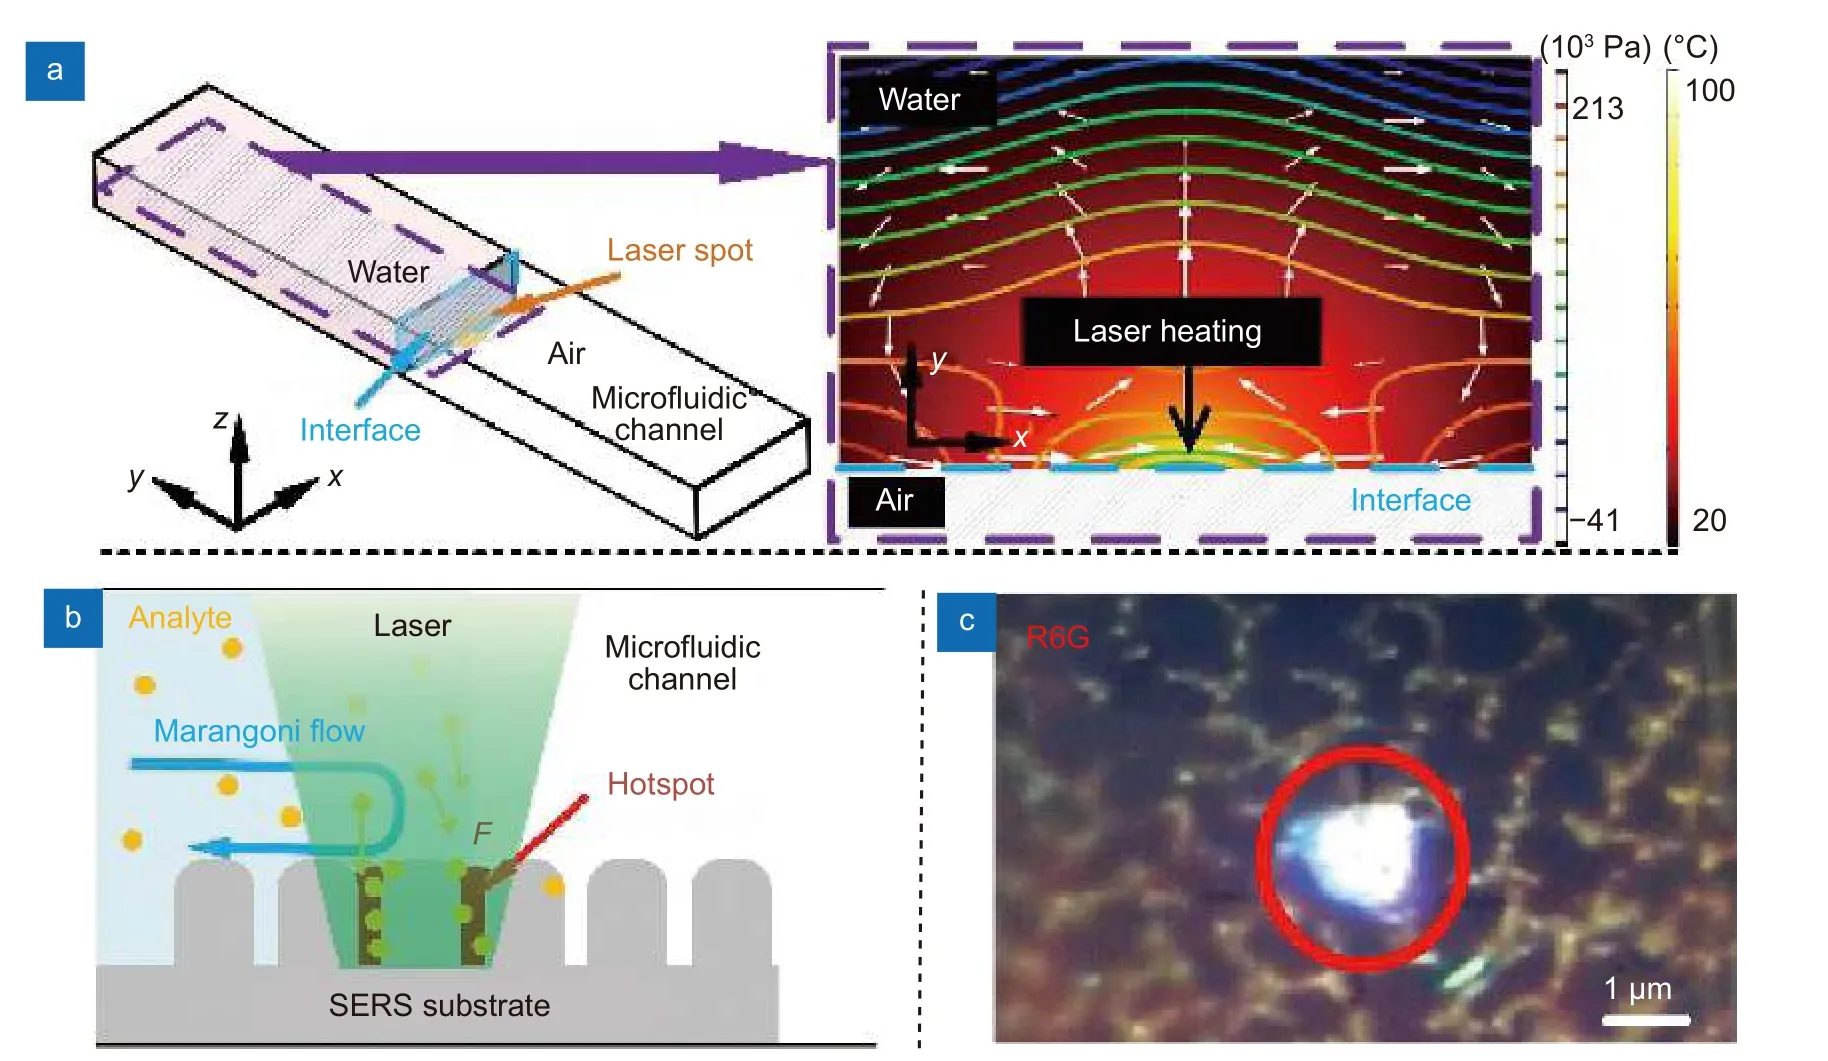
Fig. 4 | (a) Simulation of the fluid temperature and the pressure distributions in the liquid on the SERS substrate near the liquid-interface induced by laser heating. (b) The diagram of local aggregation of analyte molecules governed by Marangoni flow and optical trapping. (c) Immobilized R6G molecules on substrate by LI-SERS measurements.
whereσTis the surface tension,dis the distance to center of laser spot, andμis dynamic viscosity of the liquid. Eq.(1) using parameters adapted from ref.29gives Ma of 96,implying the strong Marangoni flow induced by laser. It is worth to mention that for the situation of regular SERS(laser irradiation in liquid), the temperature gradient ΔTwas calculated to be less than 5 °C. (Supplementary information, Fig. S4). Such low ΔTis not sufficient to induce strong Marangoni flow. Once the analyte molecules enter the laser spot, they will be immobilized by laser due to optical force. Considering the molecules are much smaller than wavelength, the scattering force is given by17

whereIis the intensity of the light,σis the scattering cross section of molecule,nis the refractive index, andcis the speed of light in vacuum. From Eq. (2), the scattering force is proportional to the intensity of electric field.In addition, the gradient force is given by
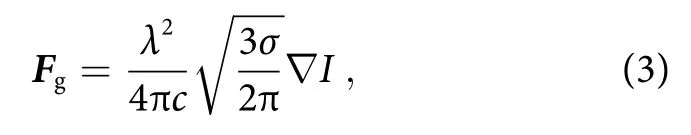
whereλis incident laser wavelength17. Due to localized surface plasmon resonance of the metal nanodot array,the electric field of incident laser beam is highly amplified to induce localized electric fieldEloc. Since the laser intensity is proportional to square of the electric field(I ∝|Eloc|2), the intensity of incident laser beamI0is further enhanced. Therefore, although theσof bio-molecules is small (σ ~10-28- 10-30cm2sr-1), the optical forces induced (F~ aN - fN) are sufficiently high to immobilize the molecules collected by Marangoni flow on the metal nanostructure. The schematic of self-immobilization of analyte molecules on the SERS substrate by Marangoni flow and optical trapping is illustrated in Fig.4(b). The analyte molecules are dynamically collected and accumulated in the hotspots. Figure 4(c) shows immobilized analyte molecules at the laser spot on the substrate when using R6G as analyte for LI-SERS, as we suspected. Therefore, it is understandable that the simultaneous collection and optical trapping generate extraordinary enhancement of Raman signals.
Figure 5(a) shows a DNA sequence analysis with different component concentrations. It is understandable that the Raman intensity decreases with decreasing concentration of the DNA sequence, and reveals a detection limit of approximately 1 fM. Full details of the DNA sequence are given in the Supplementary information (Table S2). A similar detection limit for DNA sequence analysis may be achieved using other SERS techniques, but these methods usually depend on the use of coupling agents and linkers and the need to immobilize the DNA sequence on the metal substrate30-32. Also, the pre-treatments of SERS substrates increase the unit and time costs. Moreover, the linkers need to be selected carefully and attached on the SERS substrates, because the bonding scheme may impact on the DNA capture. Thus, it can be concluded that the LI-SERS method simplifies the DNA analysis due to the elimination of the pre-treatment of the substrates. Moreover, LI-SERS can achieve lower detection limits if SERS substrates with higher AEFs are selected. As shown in Fig. 5(b), the ultra-high sensitivity of the LI-SERS method permitted the discrimination of the DNA sequence (10 fM). Two DNA sequences consisting of different ratios of bases were used for demonstration purposes. The components of each sequence are described in the Supplementary information(Table S3). Sequence 1 (S1) contained 23% A and 33% T,while sequence 2 (S2) contained 49% A and 11% T. The amounts of G and C were similar in both sequences.Since two sequences have a similar percentage of Cand G, we can distinguish the two sequences by comparing the ratios of two specific Raman intensities originated from each A and T. The Raman spectra of two sequences were calibrated to minimize the noise from background, and the Raman intensities were obtained as counts per second measured by Raman spectrometer.Specifically, taking advantage of the C=O stretching at 1640 cm-1for measurement of T and the C=N stretching at 1474 cm-1for measurement of A33, the normalizedas highlighted with the gray bars in Fig. 5(d), provided a measure of the two DNA sequences. Although LI-SERS cannot perform DNA sequencing, the different intensity ratios at two specific Raman peaks illustrate how the DNA sequences with different ratios of DNA bases can be readily discriminated. Such discrimination may be applied to rapid virus detection without the need for amplification such as polymerase chain reaction, and achieve higher sensitivity compared with recent SERS methods28,34. Discrimination methods for DNA have been reported using several different SERS methods, but additional procedures have to be implemented in the methods such as nanoparticle manipulation18, single SERS hotspot35,36, and modification of metal nanoparticles6,37, which restricts the practical utility of these approaches. Moreover, the aforementioned methods are conducted using confocal Raman spectrometers linked to other sophisticated instrumentation. Such requirements clearly limit or restrict the operation of DNA discrimination studies in most laboratories. In contrast, due to the simplicity of LI-SERS and the closed environment of a glass microfluidic channel, it is anticipated that in the near future LI-SERS research and development studies can be implemented on site using portable Raman spectrometers,which will promote the application of DNA discrimination methods.

Fig. 5 | (a) Raman spectra for DNA sequences at different concentrations measured by the LI-SERS method. (b) Raman spectra for two DNA sequences (10 fM) consisting of different ratios of bases. The C=O stretching at 1640 cm-1 and the C=N stretching at 1474 cm-1 are highlighted with gray bars. (c) Raman spectra of Aβ (29-40) at different concentrations as measured by the LI-SERS method. (d) Variation of Raman intensity,which is averages from ten measurements at each concentration at 1271 cm-1 with the error less than ~10% as a function of concentration. The red line is the linear fitting of Aβ (29-40) concentrations and Raman intensity at 1271 cm-1.
In a further application, the LI-SERS technique was used to detect Aβ at ultralow concentrations. It is well known that the concentration of Aβ in the human brain is implicated in Alzheimer’s disease and Aβ serves as a bio-marker for the disease38,39. Diagnosis in the early stage of the disease is very challenging because at the asymptomatic stage medical imaging methods, such as magnetic resonance imaging and computed tomography,lack the necessary sensitivity to detect the ultralow concentrations of Aβ. However, monitoring the concentration of Aβ in body fluids, such as cerebrospinal fluid,may reveal the early stage onset and the progression of Alzheimer’s disease and hence justify early therapeutic interventions. As shown in Fig. 5(c), Aβ (29-40) solutions of ultralow concentrations (1 pM - 1 nM) were successfully measured by the LI-SERS method. In contrast, the detection limit by regular SERS was estimated to be higher than 1 μM, and the Raman spectroscopy on a glass substrate was not able to detect Aβ of 100 μM (see Supplementary information, Fig. S5), indicating high ability of LI-SERS for trace detection of Aβ. In the Raman spectra, a broad peak centered on 1271 cm-1reflects the amide III band, the peak at 1389 cm-1is attributed to the amide S band, the peak at 1159 cm-1is attributed to the C-C-N deformation, and the broad peak centered on 910 cm-1refers to the protein α-helices21,40. It is worth mentioning, as indicated in Fig. 5(d), that the Raman intensity at 1271 cm-1shows high linearity for the concentration range 1 pM - 1 nM and the detection limit for Aβ (29-40) was estimated to be less than 1 pM,which is appropriate for quantitative monitoring of Aβ at ultralow concentrations. The analytical performance for recent studies on the measurement of Aβ using SERS platforms is detailed in Supplementary information, Table S4. Typically, the detection limit is determined by the lowest concentration of analytes at which the Raman peaks of the analyte molecules can be identified from the Raman spectrum, as also adopted in this work. For labelfree SERS measurement, the detection limits are in the 10 pM - nM range. To achieve fM detection of Aβ, capping agents or linkers are required. In comparison, the LISERS method afforded label-free measurement of Aβ with a sub-pM detection limit. Of course, the detection limit may be further lowered by using SERS substrates which offer a higher AEF. Thus, in this study it has been verified that the LI-SERS afforded ultrahigh sensitivity and versatility for label-free detection of bio-molecules of large molecular weight such as DNA bases, DNA sequences and proteins.
Conclusions
In conclusion, an overview of the scope of the LI-SERS method for trace detection of bio-molecules in microfluidic SERS chips with particular reference to ultratrace detection of DNA bases and Aβ has been given. The microfluidic SERS chips were fabricated by hybrid fs laser processing, and a liquid interface was allowed to form in the microchannel where the LI-SERS measurement took place. Owing to the Marangoni flow and optical trapping effects induced by LI-SERS, a detection limit of 1 fM for label-free DNA bases was demonstrated. Additionally, without the use of coupling agents, two DNA sequences consisting of different amounts of bases were successfully discriminated by comparing the intensity ratios at specific Raman peaks. Furthermore, Aβ (29-40)was determined in test solutions with excellent linear correlation between the Raman signal intensity and Aβ over the concentration range 1 pM-1 nM. Notable features of the LI-SERS method, which include the ultrahigh sensitivity and versatility associated with collection and self-immobilization of analyte molecules on the hot spots, will be beneficial for the early-stage diagnosis of disease such as viral infections and Alzheimer's disease.
Acknowledgements
The authors would like to thank Daishi Inoue and Mari Kikuya from the Materials Characterization Support Team at RIKEN for their assistance in performing SEM analyses. This research was funded by the Special Postdoctoral Researcher Program and Incentive Research Project of RIKEN.
Author contributions
S. Bai, Y. Ito and K. Sugioka designed the research; S. Bai, X. L. Ren, and K.Obata conducted experimental research; and S. Bai and K. Sugioka wrote the paper.
Competing interests
The authors declare no competing financial interests.
Supplementary information
Supplementary information for this paper is available at https://doi.org/10.29026/oea.2022.210121