Simulation and Analysis of Back Siltation in a Navigation Channel Using MIKE 21
2022-08-17ZHANGKunchengLIQingjieZHANGJingSHIHongyuanYUJingGUOXinchangandDUYonggang
ZHANG Kuncheng, LI Qingjie, ZHANG Jing, SHI Hongyuan, YU Jing, GUO Xinchang, and DU Yonggang
Simulation and Analysis of Back Siltation in a Navigation Channel Using MIKE 21
ZHANG Kuncheng1), 2), LI Qingjie3), *, ZHANG Jing4), SHI Hongyuan5), YU Jing6), GUO Xinchang1), and DU Yonggang5)
1) School of Marxism/Institute of Marine Development, Ocean University of China, Qingdao 266100, China 2) Guangxi Key Laboratory of Marine Environmental Science, Guangxi Academy of Sciences, Guangxi 530007, China 3) Yantai Marine Environment Monitoring Center Station, State Oceanic Administration, Yantai 264006, China 4) Qingdao Ocean Shipping Mariners College, Teaching and Research Department of Mathematics and Computer Science,Qingdao 266100, China 5) Civil Engineering College, Ludong University, Yantai 264025, China 6) College of Oceanic and Atmospheric Sciences/Institute of Marine Development, Ocean University of China, Qingdao 266100, China
The channel back-siltation problem has been restricting the development of channels, and its monitoring is limited by funds and natural conditions. Moreover, predicting the channel back-siltation situation in a timely and accurate manner is difficult. Hence, a numerical simulation of the back-siltation problem in the sea area near the channel is of great significance to the maintenance of a channel. In this study, the back siltation of a deep-water channel in the Lanshan Port area of the Port of Rizhao after dredging is predicted. This paper relies on the MIKE 21 software to establish the wave, tidal current, and sediment numerical models and uses measured data from two observation stations in the study area for verification. On this basis, taking one month as an example, the entire project channel was divided into five sections, and three observation points were set on each section. The results show that the area with offshore siltation is located in the northerly direction of the artificial anti-wave building. Siltation occurred on the northern seabed in the sea a little farther from the shore. Siltation occurred on the seabed surface far away from the shoreline, and with the increase in the distance from the shoreline, the amount of siltation in the south, center, and north became gradually closed, and the results can be used to guide actual engineering practices.This study will play a positive role in promoting the dredging project of Rizhao Lanshan Port.
channel back siltation; numerical simulation; back silting analysis and prediction
1 Introduction
As China’s ninth-largest port with a throughput of 100 million tons, the Port of Rizhao has a unique location advantage and is one of the major hub ports for key coastal development as proposed by China’s government. As a part of the Port of Rizhao, Lanshan Port has natural deep-waterconditions. However, with daily use and due to various fac- tors, such as storm surges and the large flow of rivers into the sea during the summer flood season, a large amount of sediment is carried by the water into the channel and silt, causing siltation. In addition, the impact of human activities has an effect on the channel siltation, so the dredging of channels is a maintenance project that ports must be equipped with.
As a consequence of the worldwide increase in the demand for commodities and goods, the dependency of so-ciety on large seaports is growing. In the wake of this trend, increasing pressure on seaports has led to the up-scaling of existing and new ports. At the beginning of the 20th century, many scholars at home and abroad have performed a certain amount of research on the siltation of port channels and basins. The main research methods are field observations and indoor physical model tests. Studies have obtained good research results and formed a relatively complete theory system. The growth of vessels and, consequently, navigation channel dimensions has led to increasing annual siltation rates, which leads to increased maintenance dredging (Berends, 2019). At many ports around the world, costs associated with maintenance dredging play a significant role in port expenses. In large port systems, annual siltation rates may well exceed tens of millions m3per year (Maren, 2015). The complex hydrodynamics (HD) and morphodynamic processes in estuaries can be modeled using sophisticated numerical models (, Delft3D, CCHE2D, and TELEMAC). Such models are applied in research and engineering practices to design and optimize port approach channels. Despite recent advances in and proliferation of various models and codes, morphodynamic modeling still encounters many challenges (Mosselman and Le, 2016). One of these challenges is selecting appropriate input and parameter values, which are often case specific. For example, the significant wave height exhibits high natural variability, which can be described by extreme value distributions (Menendez, 2009). For short- to medium-term predictions and in the absence of major system changes, measurements can be used to estimate the total predictive uncertainty of numerical models (Fortunato, 2009; Wegen and Jaffe, 2013).
Berends.(2019) presented a multifidelity method to efficiently quantify the uncertainty of siltation rates predicted by a high-resolution morphodynamic model of a port approach channel. Sediment characteristics play a dominant role in the sediment transport process. The development of a sediment transport prediction technique in the coastal environment has, in many instances, taken place as an extension of the sediment transport process of steady flow conditions. Sediment transport under steady flow con- ditions has been dealt with in detail by various authors (Bijker, 1967; Engelund and Hansen, 1967; Swart, 1976;Swart and Fleming, 1980; Rijn, 1984; Rijn and Leo, 1985). Ghosh. (2001)’s study on sedimentation in dredged channels has two aspects: i) computation of the sediment transport rate and ii) computation of the trapping of sediments in the channel. Bijker (1967, 1968, 1971), through a series of published papers, developed a method for the computation of longshore sediment transport at any specific location in the coastal environment, which constituted a major breakthrough in the technology of the sediment process in coastal engineering. Rijn (1986, 1987, 1993) performed extensive works in sediment transport under the action of waves and currents.
In this development, Rijn separately dealt with bedload and suspended load transport. Li. (2019a) used MIKE21 to simulate sediment transport and predict sediment deposition on channels, so proper measures can be taken to prevent siltation under extreme weather conditions and guarantee normal navigation and port operation. Lee. (2019) determined the dominant mechanisms for siltation, studied the sedimentation rate, and then determined the dominant mechanisms for siltation. Li. (2019b) presented an incorporation and application of a two-dimensional, unstructured-grid HD model with a suspended sedi- ment transport module. According to the sediment calculation, the dock project is feasible. However, the designed width of the fairway should be increased to ensure the nav- igation safety of ships according to the variation characteristics of cross-flow velocity in channels. Martelo(2019)used the finite element technique to model 1005 days of hydro- and morphodynamics of the Patos Lagoon estuary. Accordingly, an HD model, TELEMAC-3D, and a morphodynamic model, Sisyphe, were applied to acquire the bed evolution and sediment distribution of the area using different data sources for the oceanic, atmospherical, and continental boundary conditions. Sedimentation rates were also calculated based on the bed evolution results. Chaichitehrani(2019) used the Delft-3D modeling package to enhance our understanding of the combined effect of waves and currents.
The present study performed a numerical simulation on the sediment back-siltation problem of the passageway of Lanshan Port. This research used wave, tidal current, and sediment mathematical models to analyze and predict the back-siltation intensity of the passageway one month after dredging. This study mainly conducted a waterway back-siltation prediction experiment under the combined action of waves and currents and innovatively took one month as an example to divide the waterway prediction into five node times. The results show that the intensity of back siltation varies with time, which can save a large amount of capital investment by the owner in an actual project. At the same time, the results also provide a clear dredging direction for port operators, which has important guiding significance.
2 Study Area
The location map of the Lanshan Port area of the Port of Rizhao is shown in Fig.1.
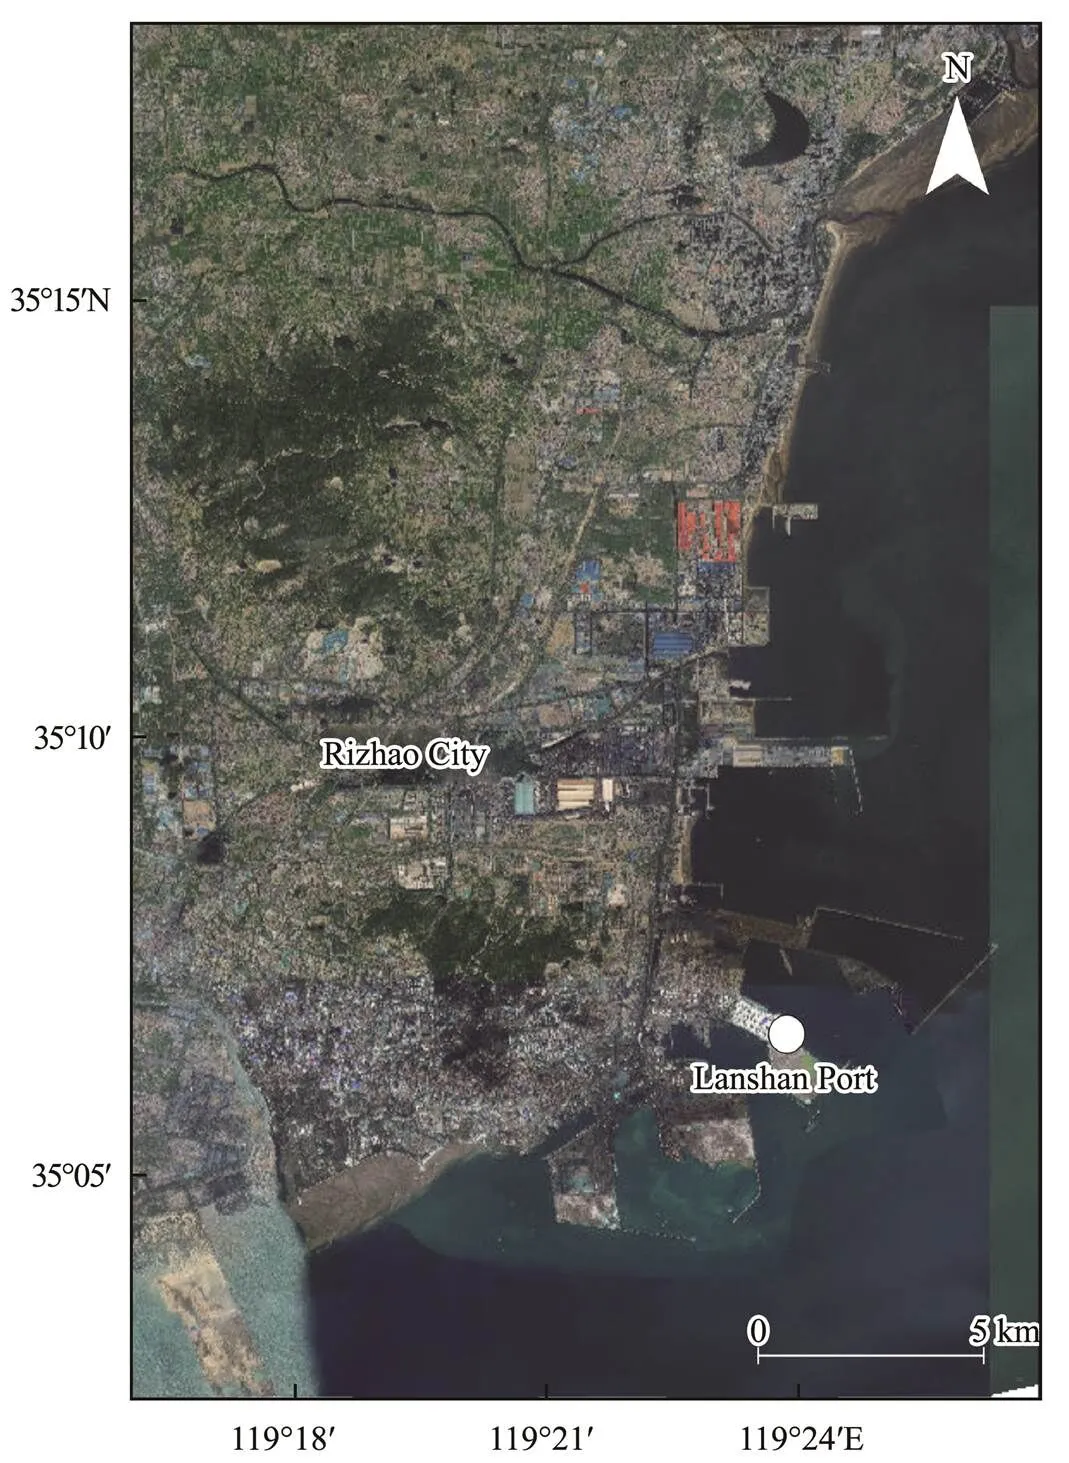
Fig.1 Channel layout in the study area.
The study area is located in the southern part of the Ri- zhao sea area, with the Lianyungang sea area to the south and the Weihai sea area to the north. This simulation adopts the nesting method of large and small models to ensure the accuracy of the calculation area affected by the tide of the open sea. The range of the large model is from Lianyungang sea area to the entire sea area of Weihai northward, ranging from 118˚25΄ to 122˚5΄E, and the latitude is 34˚30΄ to 37˚N. The range of the small model is the sea area near the channel. The range of the latitude and longitude is relatively small, approximately 119˚40΄E to 35˚15΄N.
In this study, the natural conditions, hydrological conditions, and seabed characteristics of the studied sea area were sorted and analyzed. First, the temperature and precipitation should be examined in the sea area. Precipitation can affect the runoff of the river, which in turn affects the sedimentation of the channel in the port area when the river carries the sediment into the sea. Second, the wind conditions in the sea area are analyzed. The wind is a source of power for the movement of sediment. The wind can form waves, make the sediment suspended, and drop silt near or inside the channel under the action of a certain tidal current. The study is driven by wind field data from the European Centre for Medium-Range Weather Forecasts. Third, the information about sediment size50is 0.25mm. Fourth, the tide in the sea area of Lanshan Port is a regular half-diurnal tide, which means that there are two high tides and two low tides in one day. The rising tide lasts between 4h15min and 11h. The ebb tide lasts between 4h15min and 9h. The average flow velocity of the ebb tide is lower than the average velocity of the rising tide.
The main flow’s orientation of the high tide is SSW-WSW, and the main flow’s orientation of the low tide is NNE-ENE. One hour after the low tide, the tide turns to the direction of the rising tide. Meanwhile, the flow rate of the rising tide reaches its maximum after approximately 3h. One hour after the high tide, the tide turns to the direction of the ebb tide, and the flow velocity of the ebb tide reaches the maximum after approximately 3h. The meas-ured maximum rising tidal velocity is 0.97ms−1, and the flow direction is 248˚. The maximum falling tide speed is 1.10ms−1, and the flow direction is 38˚. Finally, the hydrological conditions of the study area mainly analyze tides and tidal currents, which are the main sources of power for sediment movements in the research area.
3 Model Settings
The numerical model test in this study mainly used MIKE 21 for simulation. MIKE 21 is widely used to simulate the wave, water flow, and sediment environments of lakes, riv- ers, bays, estuaries, coasts, and oceans. It provides an ef- fective and complete design environment for coastal man- agement, engineering application, and planning. The MIKE 21 model theory was used in the number value simulation experiment, and the wave model, HD model, and sediment model are mainly used in the experimental research process.
The open boundary conditions of the small model were selected according to the results of the large model calculation, and the specific extraction location is shown in Fig.2(b). In the calculation range of the small model, to obtain accurate test data, the grid near the channel was partially encrypted, as shown in Fig.2(a). The terrain data near the channel was measured during the construction of the project. The measurement time was 2019, and use the latest terrain data. In the calculation area of the small model, the grid size outside the channel was 1200m2, and the calculation grid inside the channel was 200m2. At the same time, to ensure the accuracy of the nested model calculation, the calculation time step of the large model was set to 60s, and the calculation time step of the small model was set to 30s.
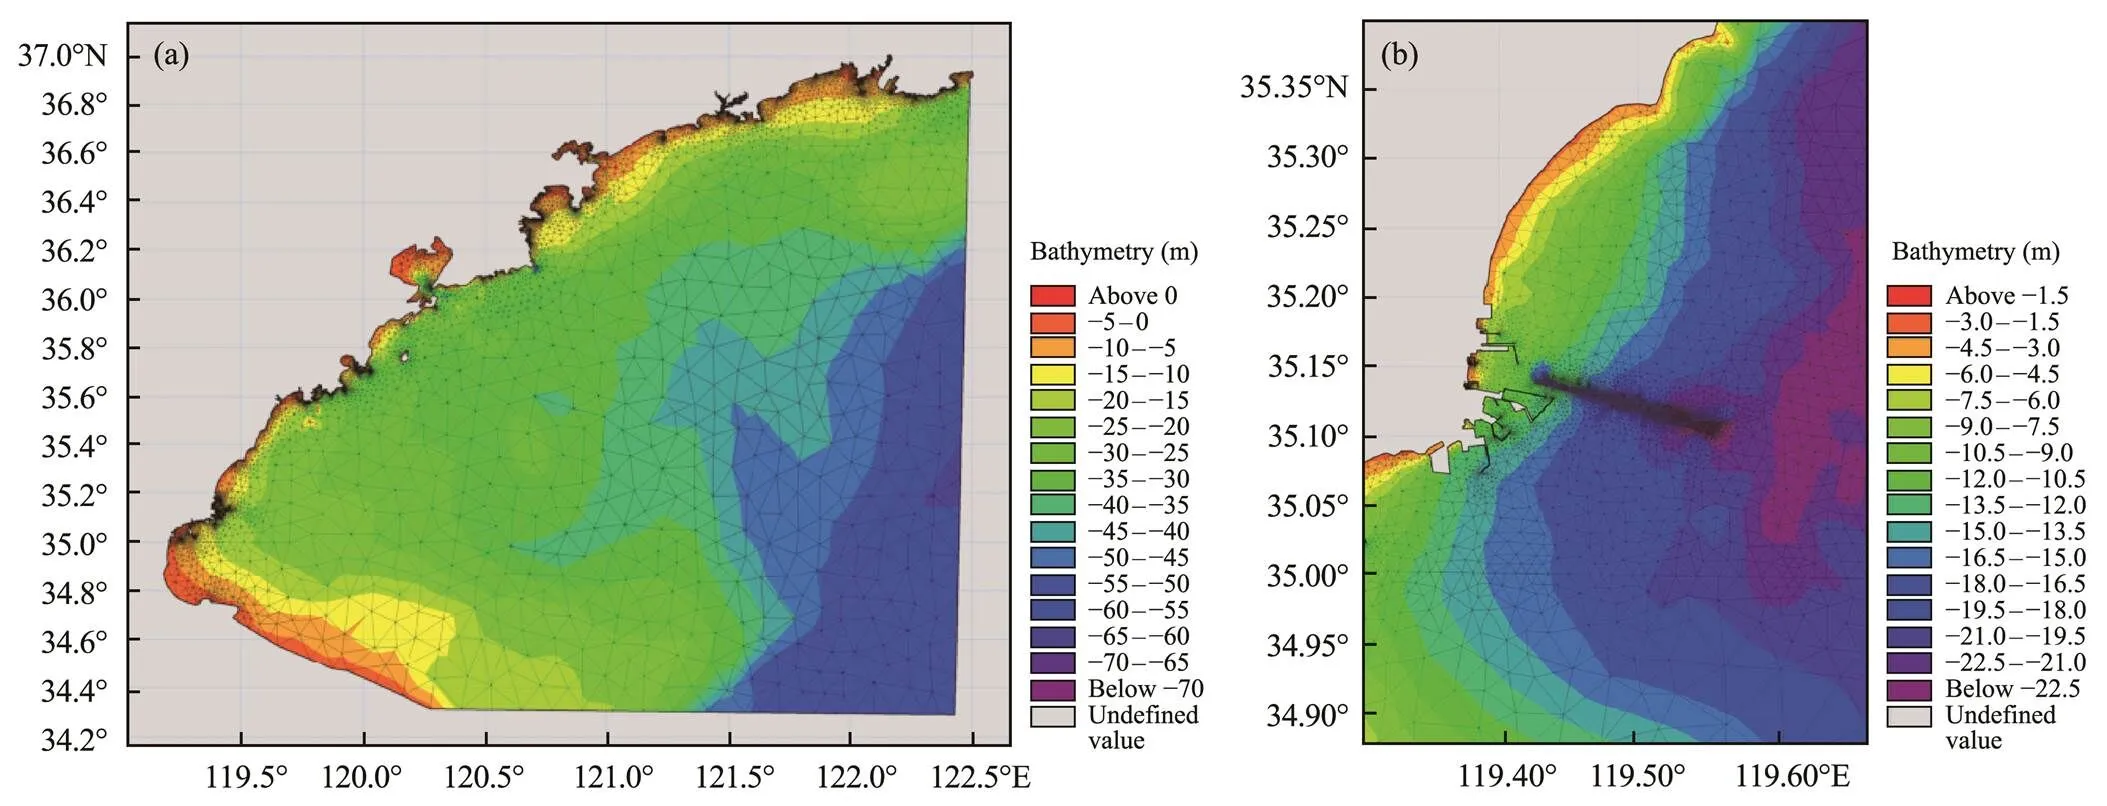
Fig.2 Calculating the area grid division and water depth.
4 Model Validation
The specific location of the station and channel locationis shown in Fig.3. The research content of this article needs to be verified separately from the tidal current module, wave module, and sediment module. When modules are calibrated to a credible level, the final numerical test results should be guided by actual engineering. The model verification in this study is to compare the data collected by two measuring stations not far from the study area by calculating the sea area, calibrate the three models, and modify the parameters.
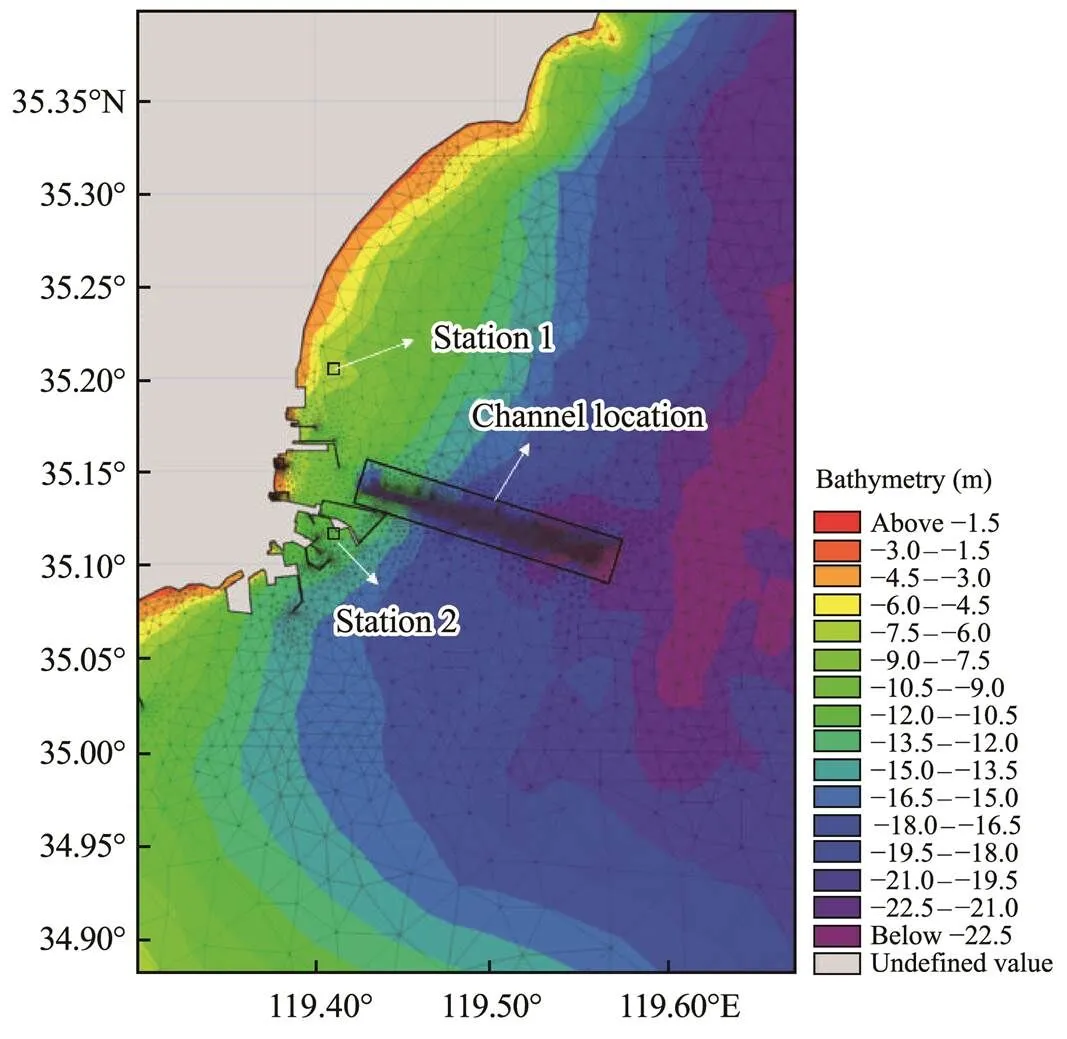
Fig.3 Schematic diagram of the location of the channel and observation station.
4.1 Establishment and Verification of the Wave Mathematical Model
A wave mathematical model was established by MIKE 21 SW to numerically simulate a small range of waves in the Rizhao sea area. The model uses quasi-stationary formulas and complete spectral equations and selects the finite volume method for discretization. The breakage factor in the model was selected as 0.8, and the bottom friction factor was set as 0.04; the soft start interval of the wind field data was 7200s. In the later HD and sediment research, the numerical simulation time is one year, so the wave module also verifies the effective wave height and spectral peak period of the waves in the four seasons of a year. Fig.4 shows the fitting results of the actual data measured by the observatory and numerical simulation results.
Figs.4 and 5 show that the data observed at stations 1 and 2 in the spring are somewhat different from the results of the digital simulation, which is mainly manifested in the time lag of the numerical simulation results. The main reason may be in the process of the numerical simulation. The effect of swell is not considered, but the result of the whole fitting cannot meet the test requirements. During summer and winter, the results of the numerical simulation and actual observations have reached a very good fitting result in the numerical simulation and trend. In general, the wave module in the numerical model can provide a reliable guarantee for subsequent numerical simulation tests and result analyses.
4.2 Establishment and Verification of the Mathematical Model of Power Flow
The MIKE 21 HD flexible mesh (FM) model was used to numerically simulate the tidal current in the study area, and an unstructured triangular grid was used to locally densify the study area. The southern and eastern boundaries are open boundaries, and the open boundary adopts water-level boundary conditions. The total number of simulation steps in the model is 263520 steps, the time is from 2018-1-1 to 2018-12-31, the time step is set to 120s, the minimum simulation time interval is 0.01s, and the maximum simulation time interval is 120s. The CFL number is 0.8, the wet and dry grids are used, the Manning coefficient is 32, and the rest are set by default. Fig.6 shows the comparison of the tidal current data and numerical simulation results obtained from two observation stations in the study area to verify the feasibility of the HD model.
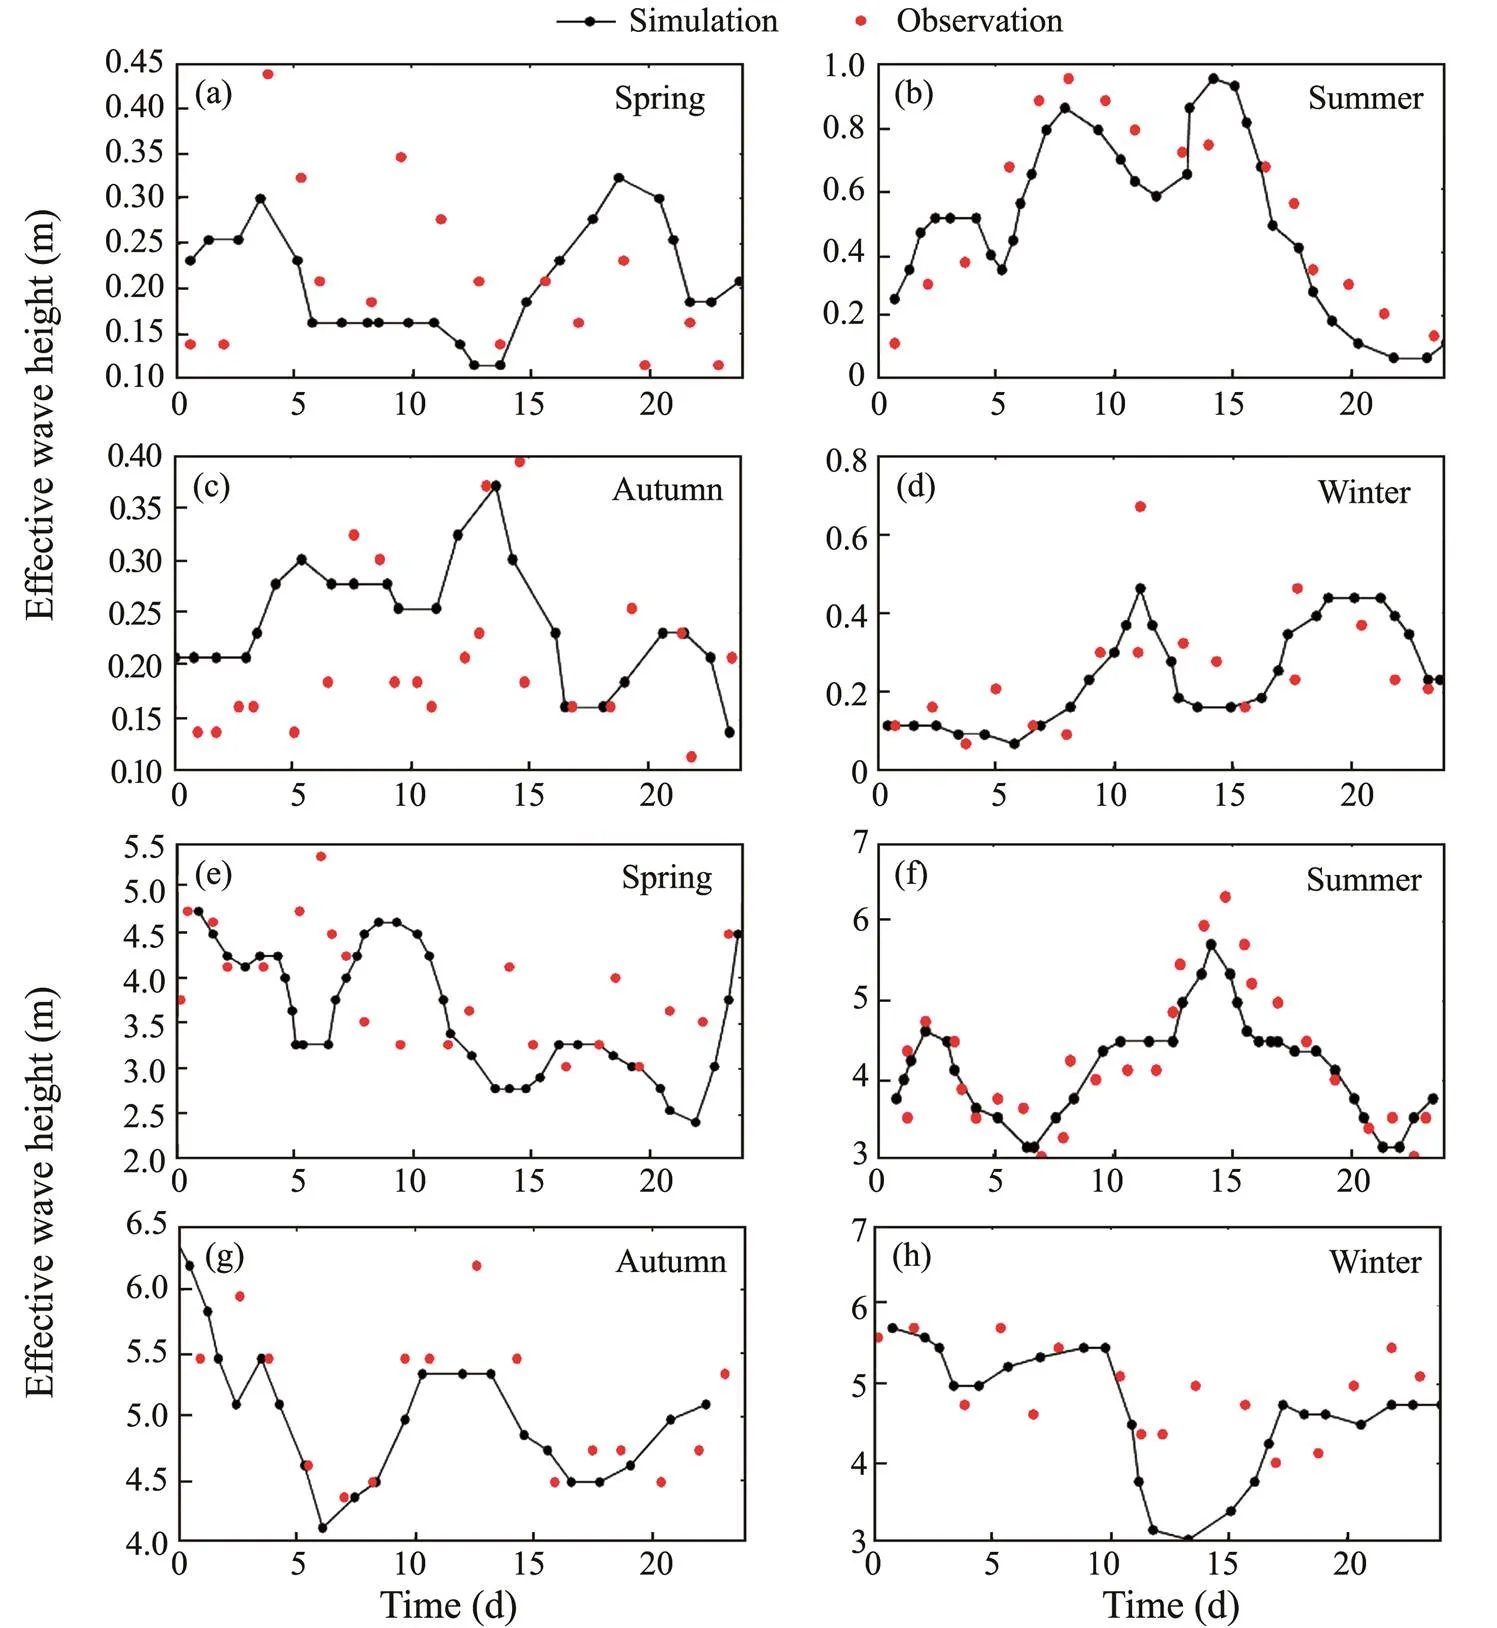
Fig.4 Effective wave height and crest spectrum at station 1.
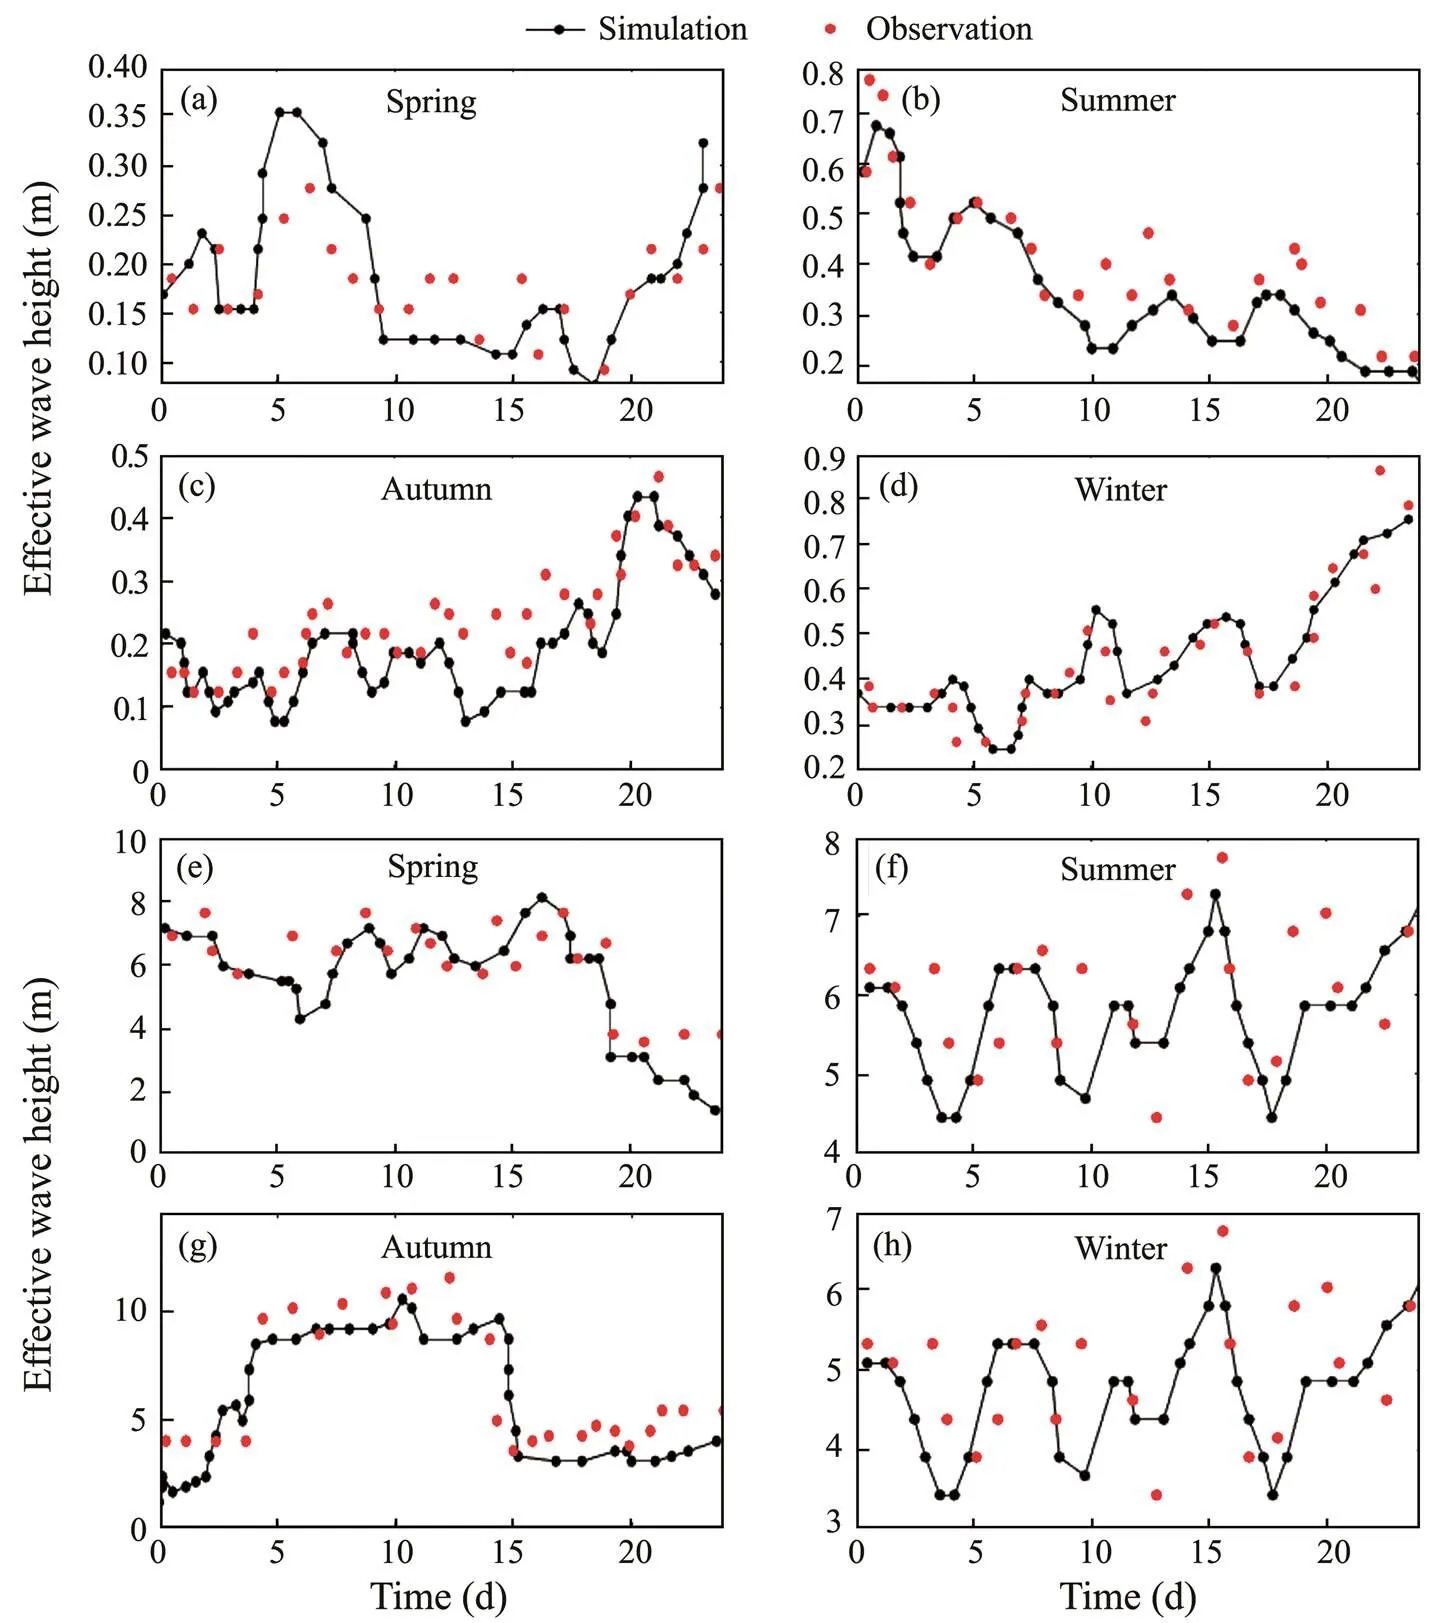
Fig.5 Effective wave height and wave crest spectrum at station 2.
The velocity and direction of the tidal current and water-level change of the measurement point were selected. The time of the numerical simulation is one year, and the time of verification is selected in May. The observation data of one month near the two stations were used to compare with the tidal current data of the numerical model. The results show that the positive value of the flow velocity fits well with the observation results of the two measuring stations. For the negative value of the flow velocity, although the numerical simulation result is slightly larger, the simulation meets the requirements in terms of the change trend. When the flow direction of the water changes, the numerical experiment can sensitively capture the change of the flow direction.
4.3 Establishment and Verification of the Mathematical Model of Cohesive Sediment
The sediment transport model was established using theMIKE 21 HD MT FM module, which takes waves and cur- rents into consideration together. In the sediment module of the HD module, there are a total of two sets of bottom beds and one set of sediment stratification. The flocculation parameter was set to 0.01kgm−3, and the sediment den- sity was set to 2650kgm−3. Because only one sediment component was set in this model, the selection of the sedi-mentation velocity coefficient must include the entire range of the sediment particle size. The format of the sedimentation velocity coefficient was selected as a constant,, 5ms−1. The Teeter profile was used for the profile, and the critical siltation shear stress was taken as a constant and set to 0.07Nm−2. The first bed was selected as the soft mud layer, the scour index was set to 8.3, the scour coefficient was set to 0.00005kgm−2s−1, the critical scour shear stress was set to a constant 0.1Nm−2, the second bed was set to the hard mud layer, the scour index was set to 1, and the scour coefficient was set to 1kgm−2s−1. The density of the first bed in the sediment model was set to 180kgm−3and the density of the second bed was set to 300kgm−3. The wind and wave forces were considered in the model, and the soft start time was set to 7200s. The setting of the diffusion properties selects the eddy viscosity coefficient analogy formula, and the proportional coefficient takes thevalue of 1. The boundary concentration of suspended sand was set to 0.005kgm−3,and the soft start time was set to 7200s. Fig.7 verifies the concentration of suspended sediment in the water body at the two moments of high tide and low tide in the study area. The verification time was 24h.
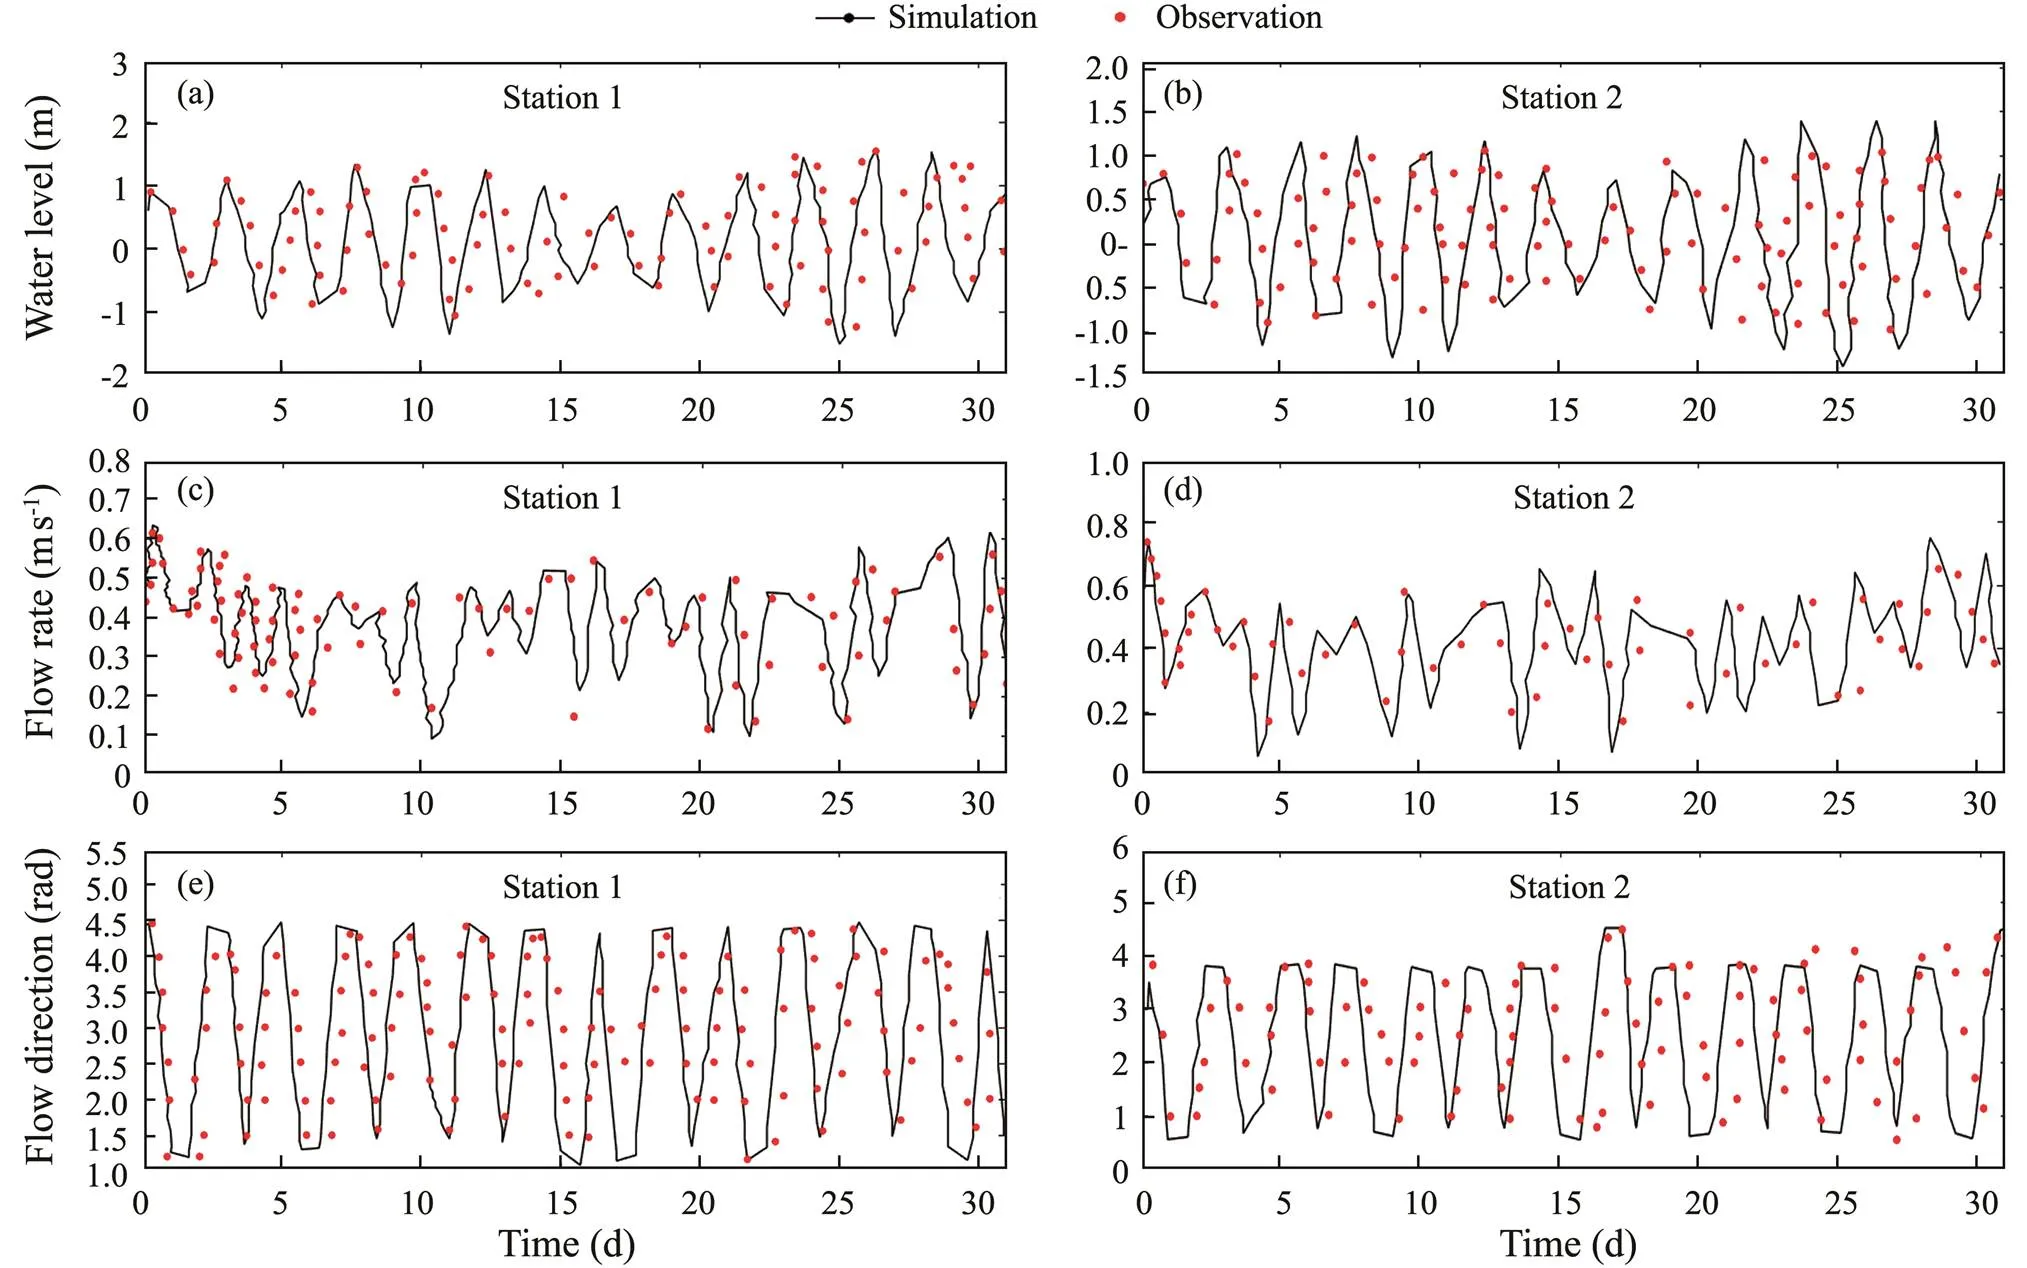
Fig.6 Examination results of the water level, flow velocity, and flow direction at stations 1 and 2.
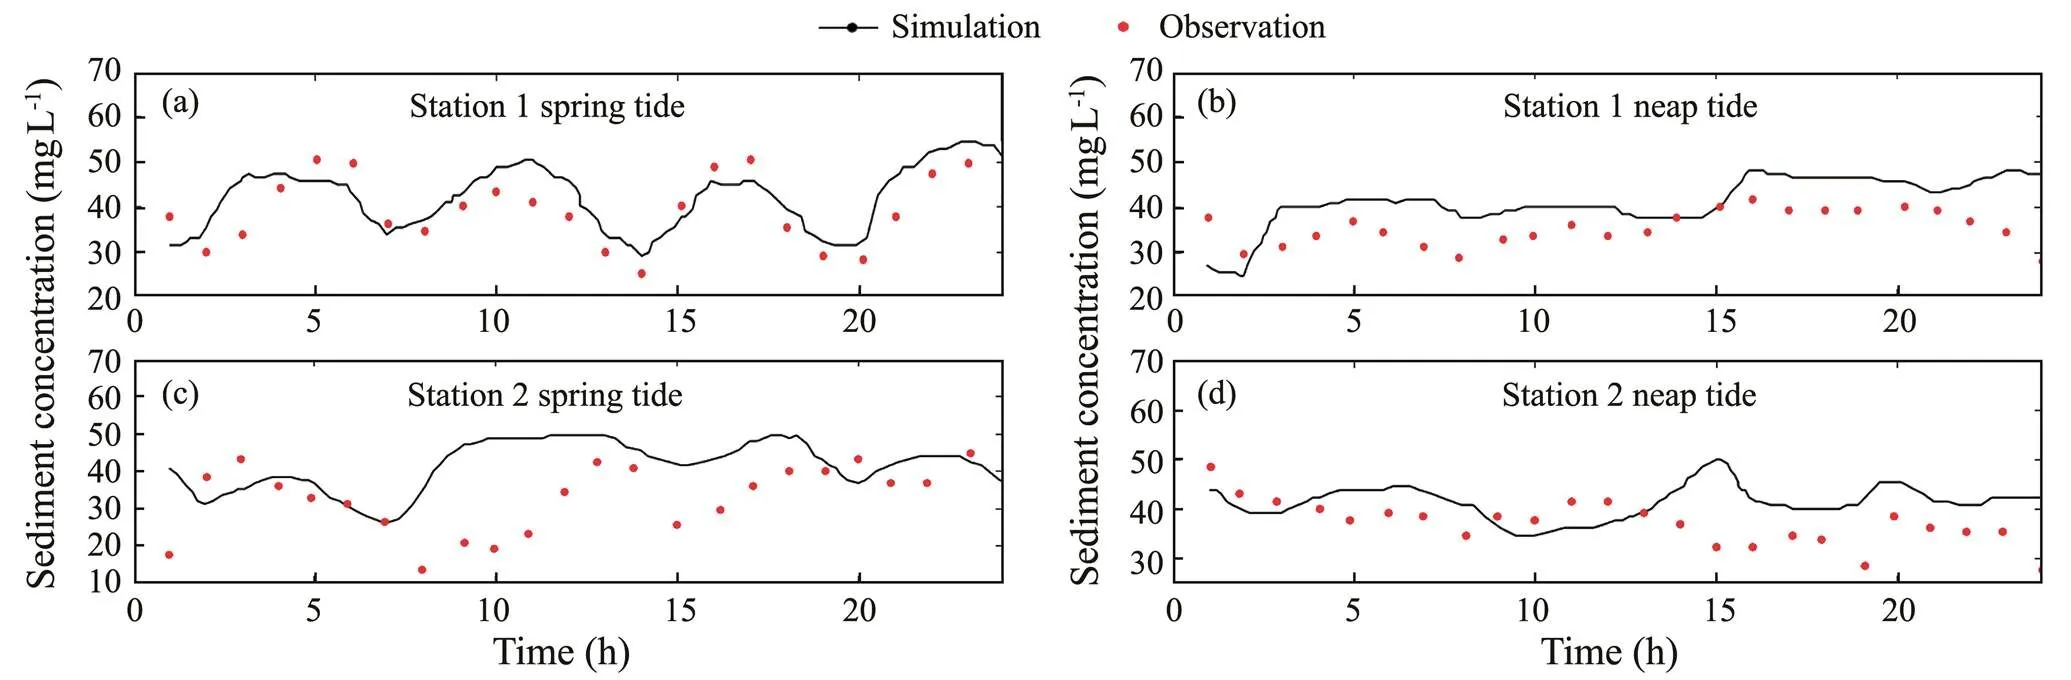
Fig.7 Verification of the sand content in spring tide and neap tide at stations 1 and 2.
The figure shows that the fitting effect of the large and small tide levels at station 1 is good, and the trend of change and the numerical value of the sand content have good results. There is a certain error between the sediment concentration data collected by station 2 and the numerical simulation results. The reason for the error is that there is a river near station 2 that is injected into the ocean, and there is no specific suspended sediment concentration data in the river water body. In the model calculation process, the safest value of the analysis was taken into account. The constant data selected at the time of setting was relatively large, and the impact of engineering mud dumping in this sea area was considered in the calculation process. The location of the mud dumping point is at station 2. Moreover, there is a certain gap between the calculated result and the actual observation value.
5 Numerical Experiment and Result Analysis
After the channel is excavated, dredging works are required to regularly maintain the water depth of the channel. Due to the effect of ocean currents and the implementation of some large-scale projects near the channel, it is easier to cause back siltation of the channel in and out of the port, which affects the safe navigation of the merchant ships in and out of the port. This study collected hydrological data from October 1, 2013, to October 31, 2013, simulated the erosion and siltation changes of sediment in the water body by ocean current movement and siltation in the sea area near the channel and predicted the erosion and deposition changes of the channel.
5.1 Experimental Design of the Channel Back-Siltation Intensity
To facilitate the analysis, the channel considered in this study was divided into five sections along the length, with an interval of approximately 2km between each section. The position of the section is shown in Fig.8. The width of the channel in the engineering sea area was 390m, and three observation points were set up at the center and 100m from the center to analyze the erosion and deposition changes of the sections connected by the observation points. Then, the results of the channel back-siltation intensity were determined.
5.2 Analysis of the Experimental Results of the Back-Siltation Intensity of the Channel
Fig.9 shows the seabed erosion and deposition changes in the calculated sea area in the numerical simulation experiment results. The calculation results selected the seabed erosion and deposition changes at 5, 10, 15, 20, and 25 days. The figure shows that the seabed erosion and siltation changes in the offshore area are mainly dominated by silt. This is because the water flow in the off shore area meets the shoreline reflection, the velocity decreases when it meets the reverse current, and the sediment carried by the water flow is silted. Moreover, the offshore area has serious erosion at the corners of the coastline and near the built offshore structures. The increase in the water flow in this part of the area has intensified the erosion of the seabed. The eastern coastal areas of the country are affected by the southeast monsoon, and currents and waves flow from the southeast to the shore. The areas with serious siltation are located in the northerly direction of the artificial anti-wave buildings. The artificial breakwater blocks the tidal current from the southeast, so the flow velocity becomes smaller after the tidal current flows here, the energy of the waves is attenuated, and the sediment carried by the water flows here to silt, causing serious siltation near the artificial buildings in the offshore area.
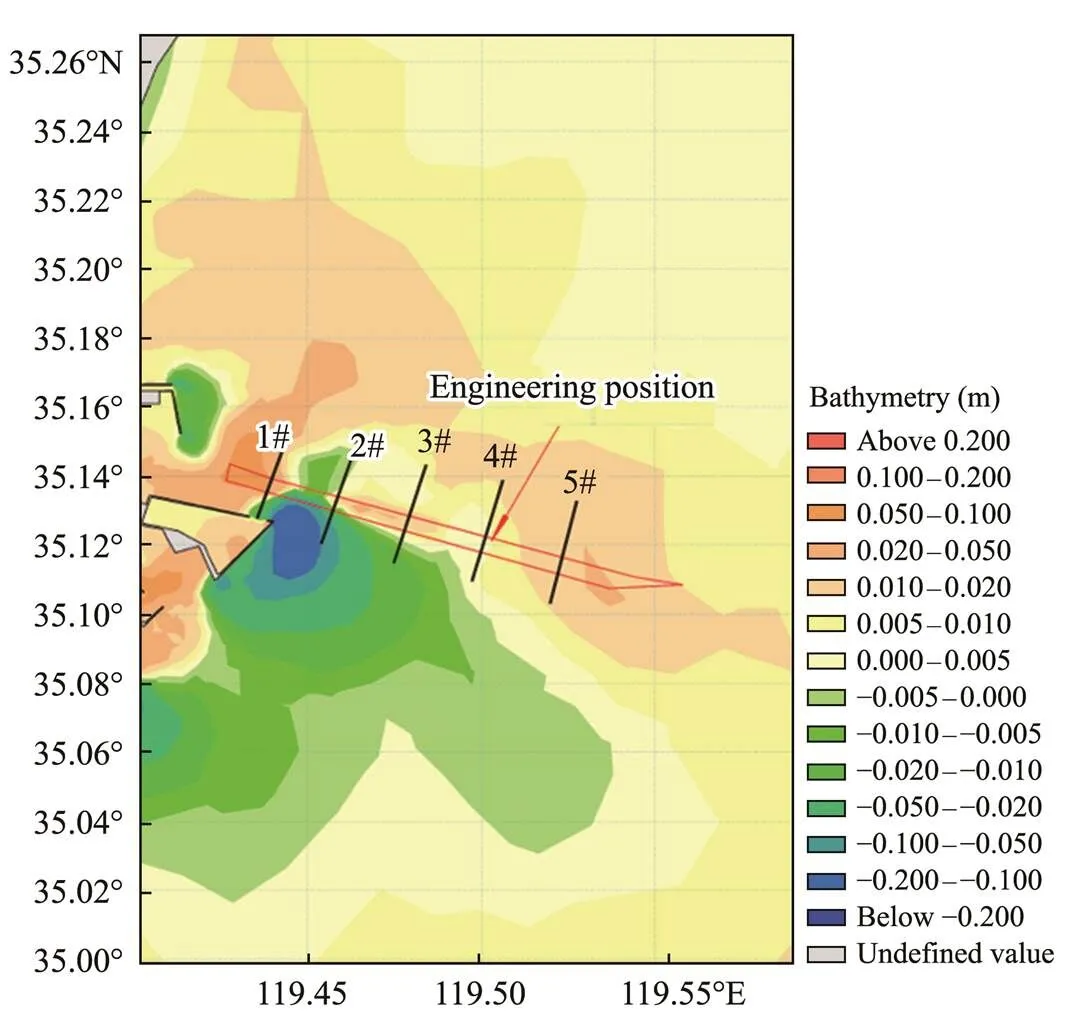
Fig.8 Schematic diagram of the analysis of the position of the channel section.
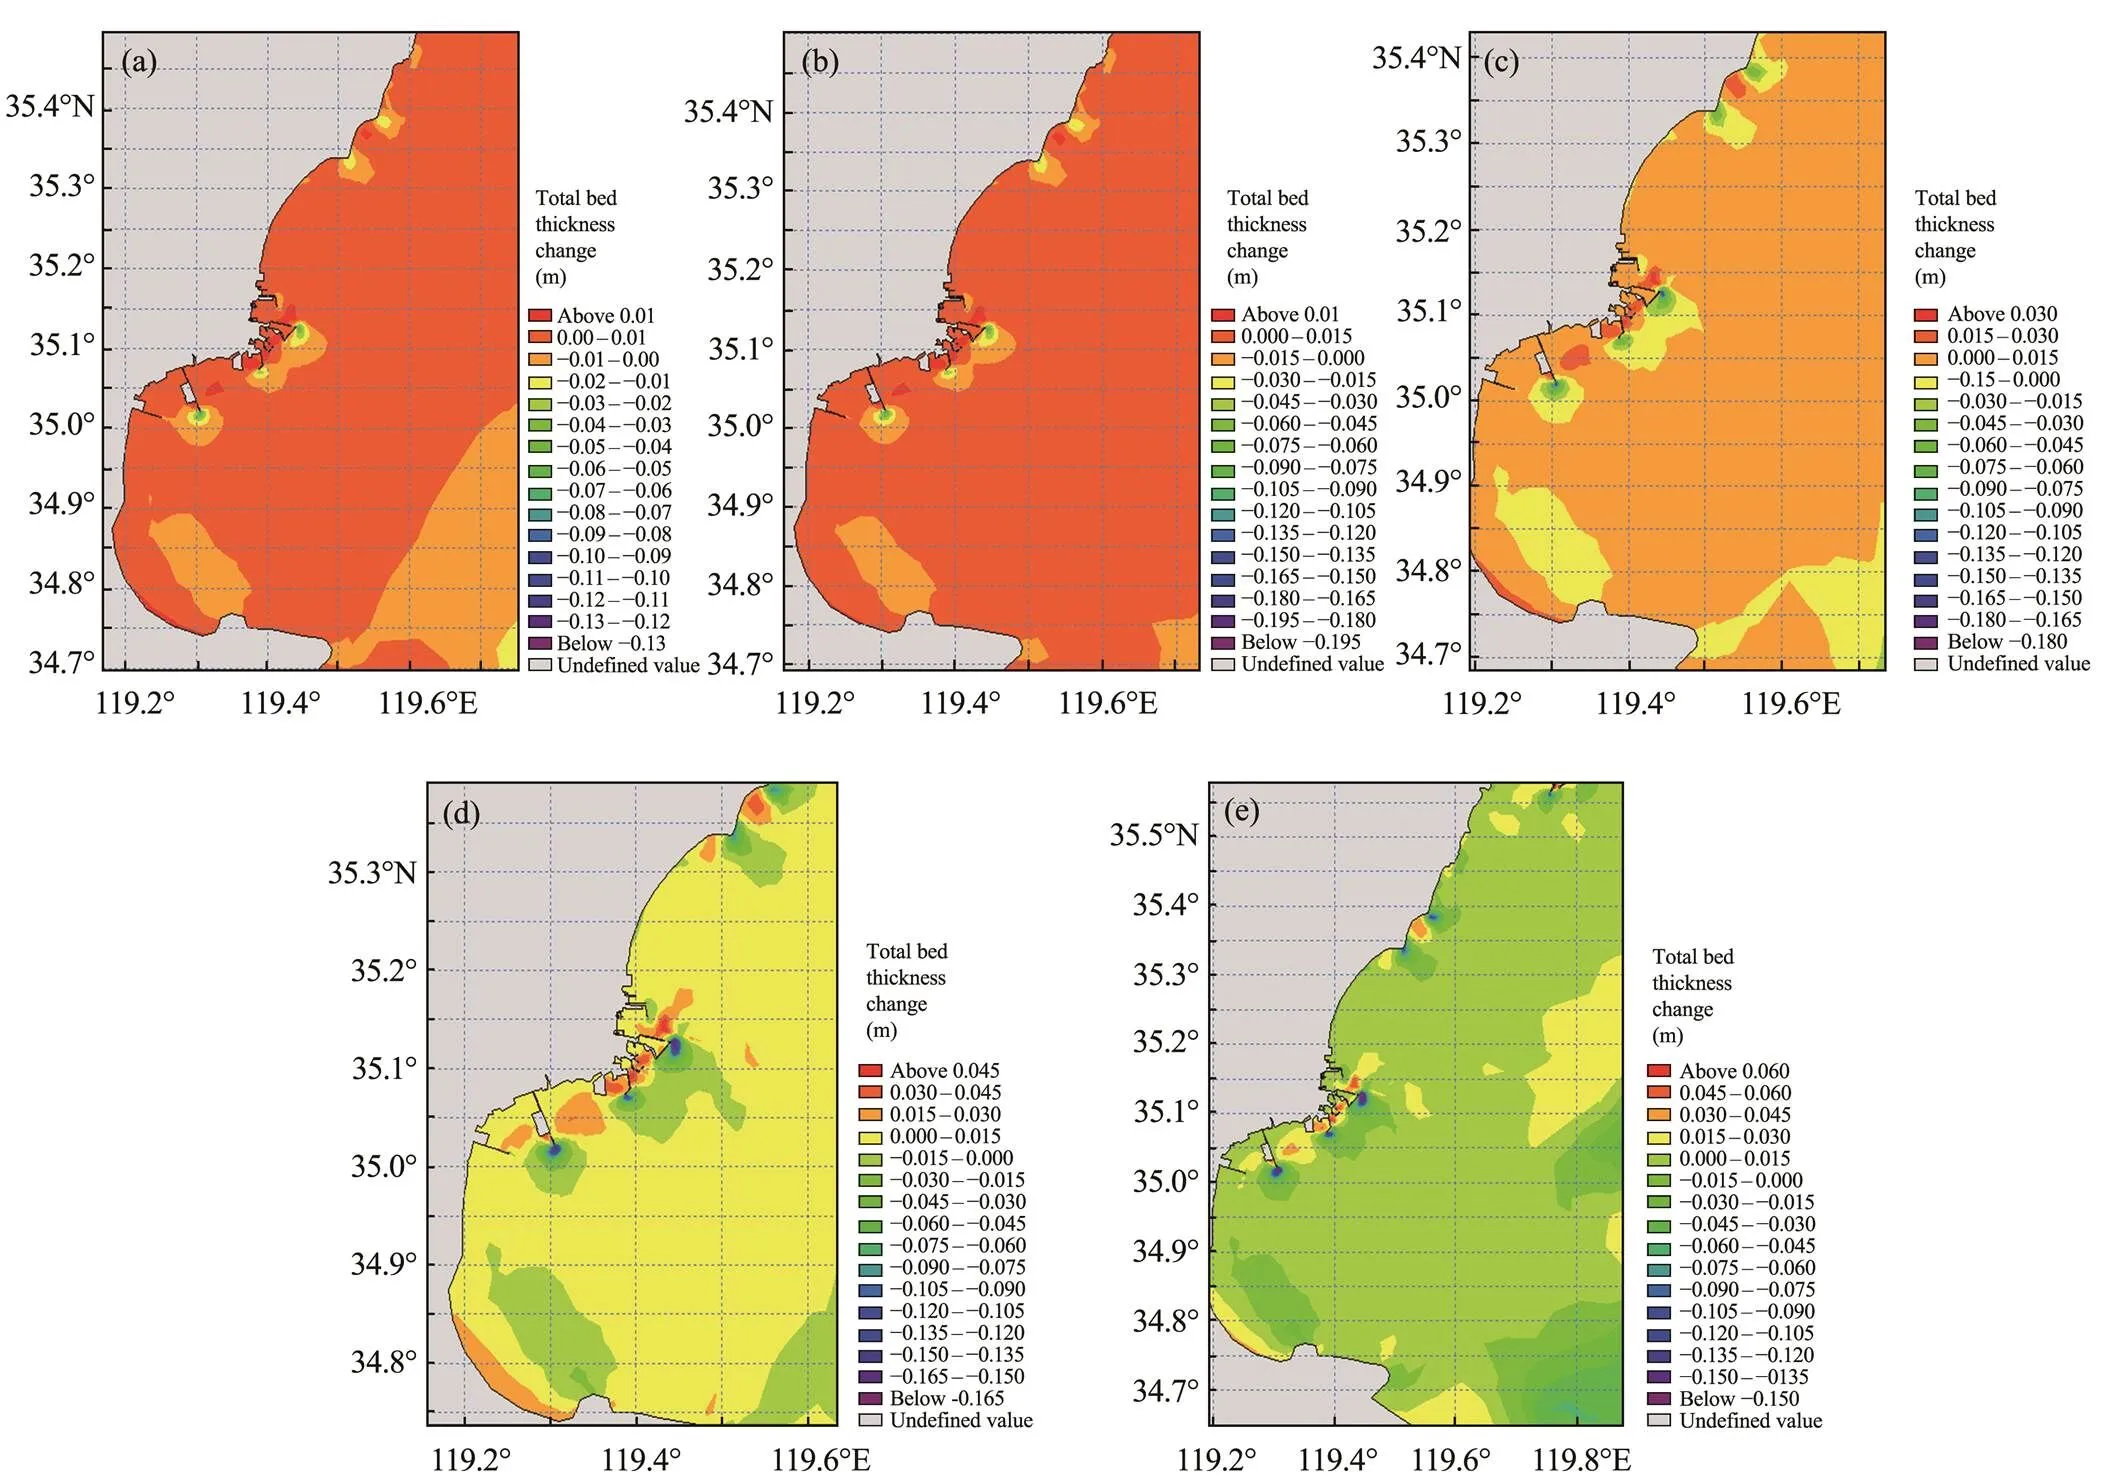
Fig.9 (a) 5 days of erosion and silting change intensity; (b) 10 days of erosion and silting change intensity; (c) 15 days of erosion and silting change intensity; (d) 20 days of erosion and silting change intensity; (e) 25 days of erosion and silting change intensity.
Fig.10(a) shows the erosion and deposition changes of Section 1 in 25 days. The abscissa indicates the position of the section. 1 is the observation point at the northerly position of Section 1, 2 is the observation point at the middle position of Section 1, 3 is the observation point at the south position of Section 1, and the settings of each section are the same.
The figure shows that the seabed was silted in the first five days under the action of the marine environment. Section 1 was caused by sediment redistribution, the currentbecame high due to breakwater, and high concentrations of sediment settled on both sides of the breakwater. The channel is at Section 1, and the amount of siltation gradually decreased from the north to the south of the channel. By the 10th day, the most serious position was near the breakwater in the southern part of the channel, and the erosion position was at the top of the breakwater. The turbulence of the water flow here was strong, so the disturbing effect on the bed surface was most evident. When the tide acted for 15 days, except for the slight siltation in the northern part of the channel, the breakwater consumed the force of the tide, and the sediment carried by the current settled here, causing slight siltation. In the middle and southern parts of the channel, scouring occurred because the turbulent kinetic energy of the water flow here increased, and the sediment on the seabed surface reached the starting flow rate. When the tidal action lasted for 25 days, the seabed surface in the middle of the channel was severely scoured. The southern part of the channel was near the breakwater, and the scouring was reduced. The previously washed seabed surface was back silted, which caused this phenomenon. It may be because the direction of waves and currents in the ocean has changed, causing the flow velocity of the water near the breakwater to decrease, and the sediment was settled here.
Fig.10(b) shows that Section 2 is in a state of silting most of the time, the amount of siltation in the northern part of the channel is similar to that in the middle of the channel; and at both positions, the amount of siltation is larger than in the southern part of the channel. There was also no breakwater here. The tide moved toward the shore in the direction of the deep sea. The energy of the water decreased during the course of the movement. When the water moved to the middle and northern parts of the channel, the turbulent kinetic energy of the water was not enough to support a large amount of sediment suspension. In the water, the sediment would also fall off.
Fig.10(c) shows that the seabed surface of Section 3 mainly experiences siltation, and the amount of siltation gradually increases with the passage of time. At 15 days, the seabed showed slight erosion under the tidal action of the previous 10 days. Combined with the action of the marine environment in Fig.10(c), when the ocean environment acted on 15 days, Section 2 had obvious erosion. When it was applied for 15 days, there was a relatively big wind and waves. Section 2 was close to the breakwater, which caused a relatively large erosion due to the effects of reflection and diffraction. The location of Section 3 was far away from the breakwater and was not affected by the breakwater. There was also a slight scouring. Moreover, in Section 3, the seabed surface was silted from the beginning of the marine environment. The position of Section 3 is far from the coastline, and the water depth is large. The waves at the sea surface have an impact on the seabed surface of the seabed, and several silts are deposited here.
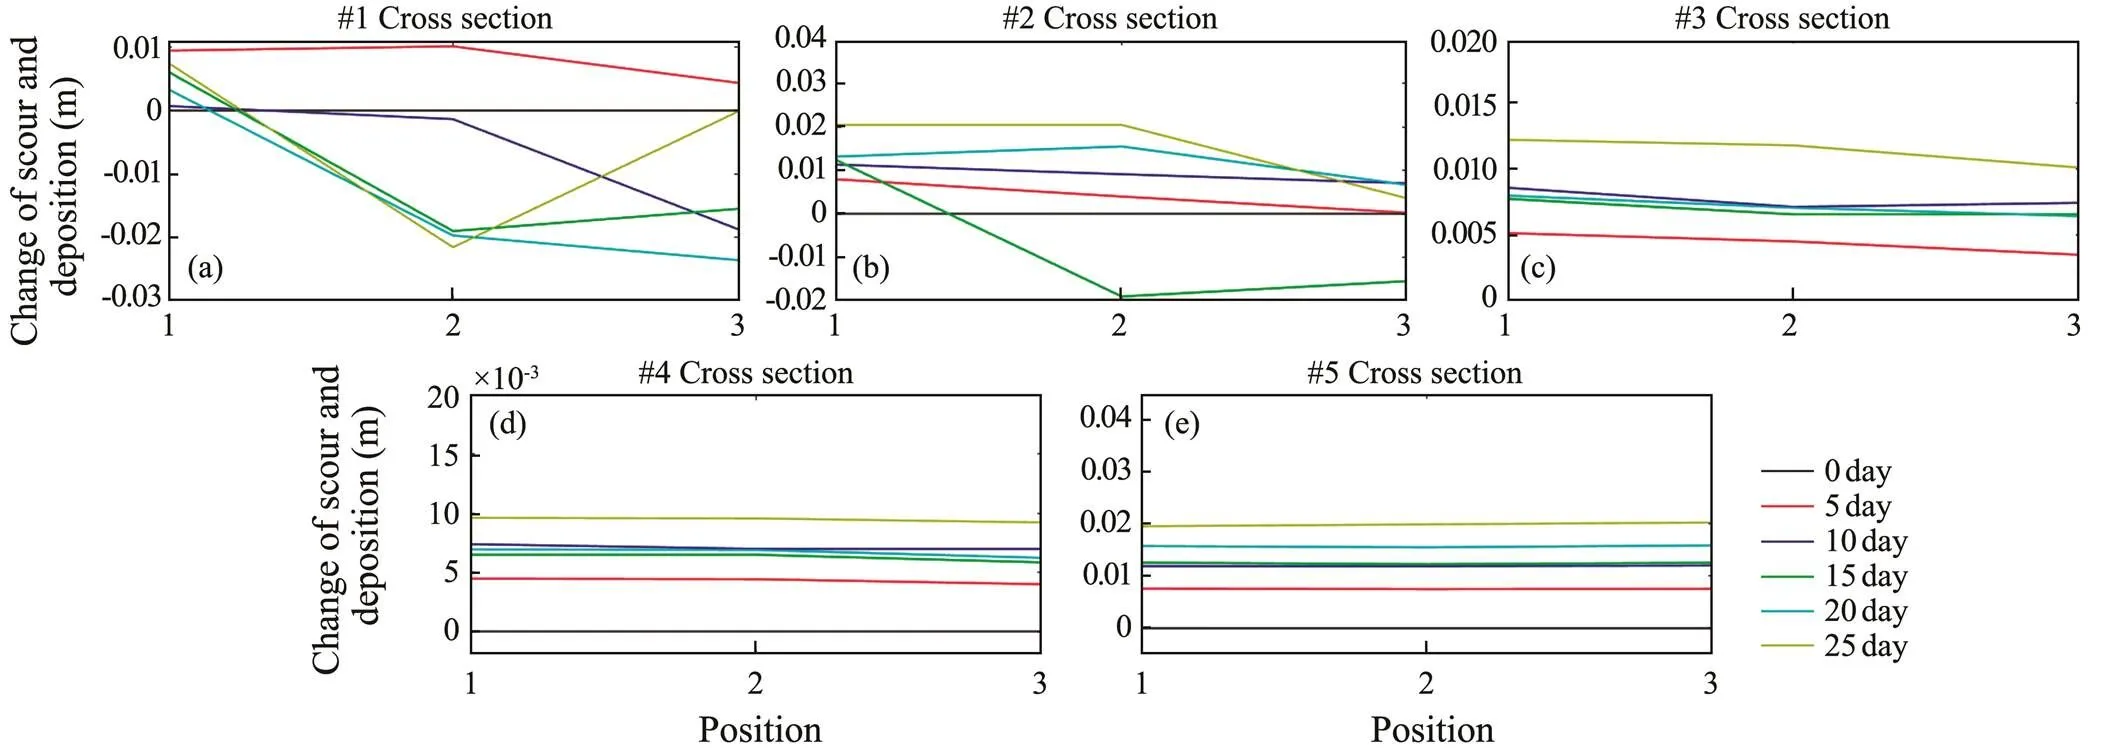
Fig.10 Changes in erosion and deposition.
Fig.10(d) shows that the seabed surface at the location of Section 4 changes relatively smoothly, and the sedimentation amount of the seabed gradually increases with the increase in the action time. However, compared to Section 3, the sedimentation amount of Section 4 is more stable. This is because Section 4 is farther away from the shoreline, the water depth is greater, and the sediment on the seabed is less affected by currents and waves. When Section 4 was applied for 15 days, the seabed surface was also scourged. The reason here is the same as the one mentioned in the previous article. The encounter of large winds and waves increases water movements, which makes more silts suspended in the seabed.
Fig.10(e) shows that Section 5 is the section farthest from the shoreline. It has very good natural water depth conditions. The seabed at this location was the least affected by currents, and in the three observation points, the changes in erosion and deposition were the same. At this location, the water flow of the channel was no longer affected by the offshore structures, and the water depth conditions made the effect of waves and currents on the sea surface on the seabed greatly weakened, so the siltation amount of each observation point in the above picture is the same.
Fig.10 shows that as the distance from the shoreline increases, the channel mainly undergoes siltation under theaction of the marine environment, and the amount of sedimentation on the seabed gradually increases. The seabed erosion of the sea area of the channel mainly occurred in the offshore area. The evident erosion was attributed to the water currents and waves that met the breakwaters, which caused the water flow to reflect and diffract. The water currents generated vortices at the channel position, which increased the turbulent kinetic energy of the water flow. A large amount of sediment on the seabed surface started to suspend, which caused the seabed surface to scour.
Through data sorting, we can observe the erosion and deposition changes of the channel along with the distance from the shore to the seabed. Abscissa 1 represents the northern observation point of Section 1, 2 represents the observation point of the northern section of Section 2, 3 represents the observation point of the northern section of Section 3, 4 represents the observation point of the northern section of Section 4, and 5 represents the observation point of the northern section of Section 5. Fig.11(a) shows that the seabed surface on the north side of the channel mainly undergoes siltation, and the amount of siltation increases with the increase in the action time.
The setting of the abscissa in Fig.11(b) is the same as the setting above. The middle position of the channel was only scourged at Section 1, and the seabed here was silted up in the first 5 days of action. With the increase in time, the seabed surface at Section 1 began to scour and gradually increased. From Section 2 to the direction away from the shore, siltation occurred in the middle of the channel. This is because there are no external condition changes in the ocean current flowing through here. Under the condition that the water depth and water flow energy gradually attenuate toward the shore, the seabed surface in the chan- nel is silted.
As shown in Fig.11(c), the amount of siltation in the southern part of the channel is less than the amount of siltation in the middle and northern parts of the channel at the corresponding section. The waves moved toward the shore along the southeast direction, and the ocean currents gradually moved in the process, so the amount of siltation here was less. Because the southern location was closer to the breakwater, the current flow here was changed by the breakwater from the previous flow state, so erosion occurred at position 1.

Fig.11 Erosion and deposition changes in the north, middle, and southern sections of the channel.
6 Conclusions
Based on the dredging project of the entrance and exit channel of Lanshan Port, this study performed a numerical simulation experiment on the back-siltation problem of thechannel and predicted the back-siltation change of the channel after the completion of the dredging. The experimental study took one month as a duration to simulate the back-siltation problem of the channel over time. The main research conclusions are as follows:
1) The scouring and silting changes of the seabed in the offshore area are mainly dominated by silt. This is because the water flow in the offshore area meets the shoreline reflection, the velocity of the reverse current decreases and the sediment carried by the water flow is silted. The offshore area is scoured more severely at the corners of the coastline and near the built offshore structures because the flow velocity in this part of the area increases, which intensifies the scour of the seabed. The area with more serious siltation occurs in the northerly direction of the artificial wave-breaking building. The artificial breakwater blocks the tide from the southeast, so the velocity of the tide decreases after it flows here, the energy of the waves is attenuated, and the sediment carried by the water flows. The siltation here has caused serious siltation near the artificial buildings in the offshore area.
2) In the part of the channel near the shore, due to the influence of the artificially constructed offshore structures, the state of the current and waves flowing through it has changed, causing the seabed at the southern and middle positions of this part of the channel to be scoured. In the northern part of the channel, due to the weakening of the reflection and diffraction of the marine structures on the water flow, siltation occurs on the seabed in the northern part of the channel, and the sediment carried in the seawater is deposited here.
3) Sedimentation mainly occurs on the seabed surface of the channel far away from the shoreline, and as the distance from the shoreline increases, the amount of siltation at the southern, middle, and northern locations of the channel gradually becomes the same. This is because as the dis- tance increases, the water depth of the sea area surrounding the channel increases, and the impact of water currents and waves on the ocean floor bed surface is less.
Acknowledgements
The study is supported by the Guangxi Key Laboratory of Marine Environmental Science, Guangxi Academy of Sciences(No.GXKLHY21-04),theSpecialFundsforFun- damental Scientific Research Operation of Central Universities (No. 202113011), the Shandong Provincial Social Science Planning Research Youth Project (No. 21DSHJ2), NSFC-Shandong Joint Fund (No. U1706215), and the Tian- jin Philosophy and Social Science Planning Project of China (No. TJKS20XSX-015).
Berends, K.D.,Scheel,F., Warmink,J.J.,De Boer,W.P., Ranasinghe,R.,and Hulscher, S.J.M.H., 2019. Towards efficient uncertainty quantification with high-resolution morphodynamic models: A multifidelity approach applied to channel sedimentation.,152: 103520.
Bijker, E. W., 1967.. Delft Hydraulics Laboratory Publication. The Netherlands, No. 50.
Bijker, E. W., 1968. Littoraldriftasfunctionofwavesandcurrent., 1 (11): 26.
Bijker, E. W.,1971. Longshore transport computations., 97 (4): 687-701.
Chaichitehrani, N., Li, C., and Xu, K., 2019. A numerical study of sediment dynamics over sandy point dredge pit, west flank of the Mississippi River, during a cold front event., 183: 38-50.
Engelund, F. A., and Hansen, E., 1967. A monograph on sediment transport in alluvial streams.. Denmarkpublication, Copenhagen, 1-62.
Fortunato, A. B., Bertin, X., and Oliveira, A., 2009. Space and time variability of uncertainty in morphodynamic simulations., 56 (8): 886-894.
Ghosh, L. K., Prasad, N., and Joshi, V. B., 2001. A study on siltation in access channel to a port., 43 (1): 59-74.
Lee, G. H., Shin, H. J., and Kim, Y. T., 2019. Field investigation of siltation at a tidal harbor: North port of Incheon, Korea., 69 (9): 1101-1120.
Li, C., Yang, Z., and Chen, Y., 2019a. Influence of sediment transport on Nangang terminal at Shentou Harbor of Yangpu Port., 56 (5): 6-10.
Li, Y., Song, Z., Peng, G., Fang, X., Li, R., Chen, P.,, 2019b. Modeling hydro-dynamics in a harbor area in the Daishan Island, China., 11 (2): 1-22.
Maren, D., Kessel, T. V., and Cronin, K., 2015. The impact of channel deepening and dredging on estuarine sediment concentration–ScienceDirect., 95 (110): 1-14.
Martelo, A. F., Marques, W. C., and Moller Jr., O. O., 2019. Mid term simulation of suspended sediment transport and bed evolution for the patos lagoon estuary., 4 (2): 1-16, DOI: 10.21575/25254782rmetg2019vol4n2792.
Menendez, M., Mendez, F. J., and Izaguirre, C., 2009. The influence of seasonality on estimating return values of significant wave height., 56 (3): 211-219.
Mosselman, E., and Le, T. B.,2016. Five common mistakes influvial morphodynamic modeling., 93: 15-20.
Rijn, L., 1984. Sediment transport, part II: Suspended load transport., 110 (11): 1613-1641.
Rijn, L.,1986. Sedimentation of dredged channels by currents and waves., 112 (5): 541-559.
Rijn, L., 1987. Mathematical modelling of morphological pro- esses in the case of suspended sediment transport. PhD thesis. Delft University of Technology, The Netherlands.
Rijn, L., 1993. Handbook sediment transport by currents and waves.,18: 83-110.
Rijn, L., and Leo, C., 1985. Sediment transport, part I: Bed load transport., 110 (10): 1431-1456.
Swart, D. H., 1976. Predictive equations regarding coastal transports., 1 (15): 65, DOI: 10.9753/icce.v15.65.
Swart, D. H., and Fleming, C. A., 1980. Longshore water and sediment transport.. Sydney, 1275-1294.
Wegen, M., and Jaffe, B. E., 2013. Towards a probabilistic assessment of process-based, morphodynamic models., 75: 52-63.
May 8, 2021;
August 9, 2021;
September 15, 2021
© Ocean University of China, Science Press and Springer-Verlag GmbH Germany 2022
. E-mail: lqjwainxl@126.com
(Edited by Xie Jun)
杂志排行

Journal of Ocean University of China的其它文章
- The Role of Bottom Currents on the Morphological Development Around a Drowned Carbonate Platform, NW South China Sea
- Controls on the Gas Hydrate Occurrence in Lower Slope to Basin-Floor, Northeastern Bay of Bengal
- Effective Elastic Thickness of the Lithosphere in the Mariana Subduction Zone and Surrounding Regions and Its Implications for Their Tectonics
- Geophysical Evidence for Carbonate Platform Periphery Gravity Flows in the Xisha Islands, South China Sea
- Seismic Characteristics and Hydrocarbon Accumulation Associated with Mud Diapir Structures in a Superimposed Basin in the Southern South China Sea Margin
- Efficient Computational Approach for Predicting the 3D Acoustic Radiation of the Elastic Structure in Pekeris Waveguides