Effective Elastic Thickness of the Lithosphere in the Mariana Subduction Zone and Surrounding Regions and Its Implications for Their Tectonics
2022-08-17LINGZilongZHAOLihongWUZhaocaiZHIPengyaoandDINGRenwei
LING Zilong, ZHAO Lihong, WU Zhaocai, ZHI Pengyao, and DING Renwei
Effective Elastic Thickness of the Lithosphere in the Mariana Subduction Zone and Surrounding Regions and Its Implications for Their Tectonics
LING Zilong1), 2), ZHAO Lihong1), 3),*, WU Zhaocai2), ZHI Pengyao1), and DING Renwei1)
1),,266590,2),,310012,3),,266237,
To understand the rheology, structure, and tectonics of the lithosphere in the Mariana subduction zone and surrounding regions, we calculated the effective elastic thickness of the lithosphere () in these areas using the improved moving window admittance technique (MWAT) method. We find that smaller data grid spacing can better reflectvariations in the subduction zone. Theof the study region ranges from 0 to 47km. Theis reduced from 40km on the seaward side of the outer-rise region to 1–2km along the trench axis. The lithospheric breaking distance from the trench axis ranges from 0 to 250km. We suggest that the intermediatevalues in seamounts and highvalues on the seaward side of the outer-rise region respectively reflect the ‘fossil’ rheological state and current lithospheric strength of the Pacific plate. The faulting induced by the downward bending of subducting plate not only ruptures the lithosphere but also contributes to the mantle serpentinization, significantly reducing the lithospheric strength. The largest breaking distance of the Ogasawara Plateau may be due to the increase in the mass load of the subducting plate in the Ogasawara Plateau and the significant horizontal bending force in the plate caused by the resistance of seamounts to subduction. Furthermore, a good positive correlation exists between the breaking distance and subduction dip angle along the trench axis. We suggest that the subducting plate with a larger breaking distance is likely to form a larger subduction angle.
effective elastic thickness; moving window admittance technique; Mariana subduction zone; plate bending
1 Introduction
The mechanical strength of the lithosphere is one of the main factors governing lithospheric deformation (Burov and Diament, 1995; Tassara., 2007), usually described by the effective elastic thickness of the lithosphere (). As a proxy for the long-term strength and dynamic response of the lithosphere,is primarily related to the lithospheric temperature, the composition of the crust and mantle, and the state of stress (Burov and Diament, 1995; Lowry andSmith, 1995; Brown and Phillips, 2000; Lowry., 2000). Furthermore,not only provides important information on rheology and state of stress but also helps in understand- ing the relationship between lithospheric rheology and geo-dynamic evolution in various tectonic settings (Lowry and Smith, 1995; Tassara., 2007).
Subduction is a critical component of plate tectonics and facilitates heat and mass transfer between the exterior and interior of the Earth. During subduction, the subducting plate bends under the tectonic forces and sinks into the mantle, producing gentle seafloor uplift near the trench (Melosh, 1978; Hilde, 1983; Zhou., 2018). Plate bend- ing causes pervasive faulting, which could lead to mantle serpentinization, earthquakes, tsunamis, and intraplate fluid flow (Christensen and Ruff, 1983; Ranero., 2003, 2005;Lefeldt., 2012).
Meanwhile, the Mariana subduction zone in the western Pacific is an ideal region in which to study subduction zones. It is part of the Izu-Bonin-Mariana subduction zone, which has a complete magmatic record of subduction ini- tiation (Maunder., 2020). The trench depth, slope, sub-duction dip angle, and outer-rise bulge of the Mariana Trenchexhibit significant along-trench variability (Fryer, 1996; Zhang., 2014; Zhou and Lin, 2018). The subducting Pacific Plate is characterized by many seamounts, ridges, and plateaus, which make the tectonic setting more complex. Theof the Mariana subduction zone and the surrounding regions can help us understand its lithospheric structure and the tectonic processes as well as improve our understanding of the relationships between surface defor- mation, lithospheric rheology, and dynamic mechanisms of plate motion.
In the following sections, we first introduce the geotectonic setting of the Mariana subduction zone and surrounding regions. Subsequently, we describe the input data and improvements to the methodology, as well as analyze the sensitivity ofto the data grid spacing. Finally, we present theresults of the Mariana subduction zone and surrounding regions, after which we discuss the relationship between the spatial variation ofand plate subduction and tectonic-magmatic activity. We also discuss how the lithospheric structure interpreted fromanalysis relates to the subduction angle.
2 Geological Setting
The Mariana subduction zone, initiated 52Myr (Ishizuka., 2011, 2018), is mainly composed of the Mariana Trench, Mariana Arc, and Mariana Trough (Fig.1). The Pa- cific Plate is subducting under the Mariana micro-plate alonga mostly E-W direction with a convergence rate of 5–8 cmyr−1(Kato., 2003; Zhou and Lin, 2018). Due to the clockwise rotation and northward movement of the Philippine Sea Plate, the direction, shape, and position of the Mariana Trench changed during subduction (Hall., 1995; Sdrolias and Müller, 2006). From 50Myr to the present, the strike of the Izu-Bonin-Mariana subduction zone changed from almost E-W to nearly N-S (Stern and Bloomer, 1992; Sdrolias and Müller, 2006). The collisions between the Mariana Trench and oceanic plateaus (Ogasawara Plateau and Caroline Ridge) resisted subduction, which in turn stimulated back-arc spreading (Ribeiro., 2013). Meanwhile, the Challenger Deep, located in the southernmost Marianas, is the greatest trench depth on Earth (10994m) and is subject to the greatest bending (Zhang., 2014). A great number of large sea-mounts lie on the Pacific Plate and subduct with the plate motion, thereby significantly influencing the depth, shape, and sub-duction dip angle of the Mariana Trench (Zhang., 2016). A large number of normal faults have developed with- in 100km of the trench axis (Oakley., 2008; Gardner, 2010).
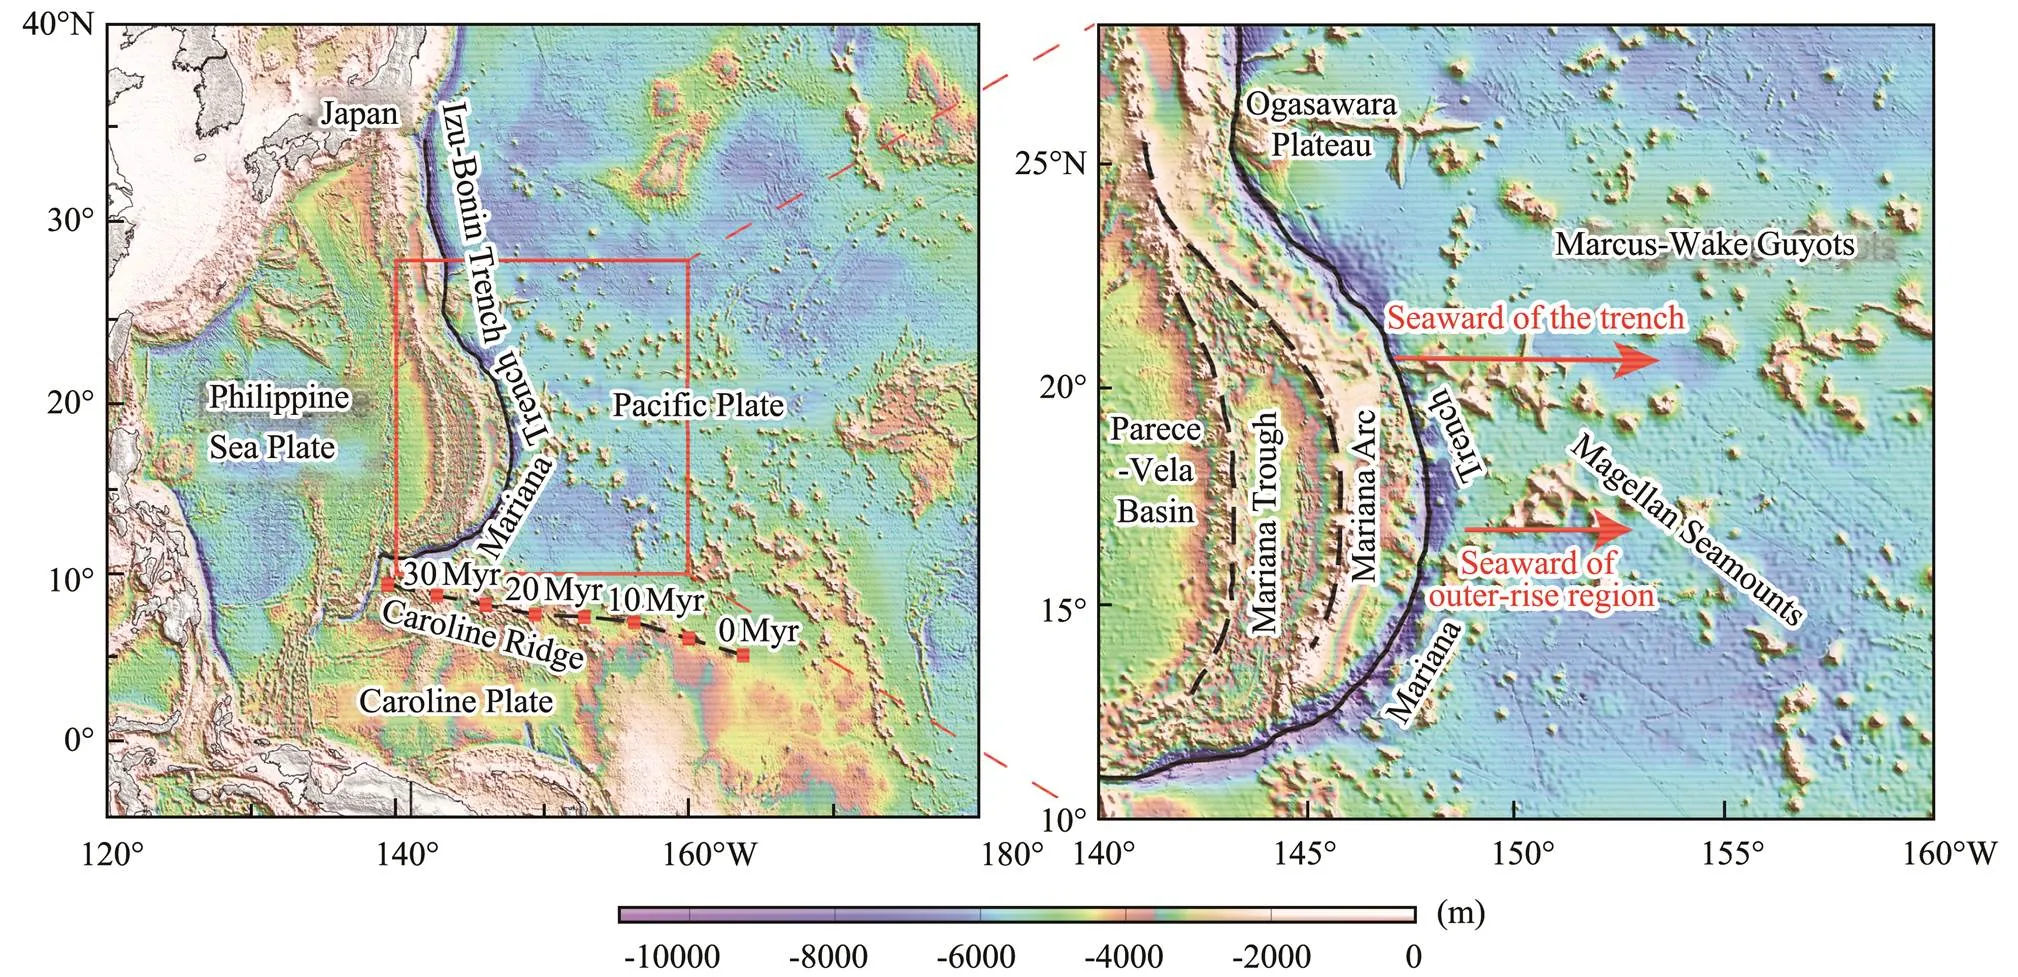
Fig.1 Bathymetry of the Mariana subduction zone and surrounding regions. The red rectangle and black dashed line indicate the Caroline hot spot track (Wu et al., 2016).
The Mariana Arc consists of about 40 active volcanoes. The Mariana arc-basin magmatic system experienced back- arc spreading twice during its evolution. In the Oligoene (30Myr), the arc experienced an initial rifting episode and then formed the Parece-Vela Basin by back-arc spreading,which lasted until 15Myr (Okino., 1994). In the late Miocene (8Myr), the arc experienced the second episode of back-arc spreading, thus creating the Mariana Trough (Asada., 2007). Mariana Trough is considered one of the youngest oceanic basins, intersecting with Mariana arcin the northernmost and southernmost areas and is farthest from the arc in the center (100km). The Mariana Trough has an asymmetric spreading rate. The spreading rate in the south is 20mmyr−1faster than that in the north (Sdrolias and Müller, 2006; Asada., 2007), which may re- sult in the curvature of the arc (Ribeiro., 2013).
3 Methods and Data
3.1 Input Data
Topography and bathymetry data of 30˝×30˝ were obtained from GEBCO_2014 of the General Bathymetric Chart of the Oceans (GEBCO) digital model. The free-air gravity anomaly data were derived from WGM2012, a 2ˊ ×2ˊ grid over both land and ocean. The information on the Moho depth and structure of the crust was derived from CRUST 1.0 (Laske., 2013), which included ice, water, three sediment layers, and three crustal layers. We assum- ed that the internal load occurs at the Moho following the assumption of Forsyth (1985).
To eliminate errors caused by the planar treatment of curvilinear coordinates, we used the Mercator projection to project all data to Cartesian coordinates. In addition, we selected grid data that were much wider than the study area to avoid edge effects.
3.2 Moving Window Admittance Technique (MWAT) Method
The estimation of theinvolves calculating the admit- tance between the observed free-air gravity anomaly and topography and modeling them. The thin-plate flexure mo- del is one of the simplest models that can be used for this purpose. For a given, the initial surface and internal loads can be obtained from the observed topography and free-air gravity anomaly, from which the predicted free- air gravity anomaly and topography can be reconstructed based on the flexure model of the lithosphere. Theva- lue was obtained by comparing the observed admittance curve with admittance curves predicted for a range ofvalues.
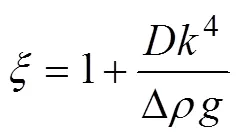
The deflection of the lithosphere under applied loads is given by:
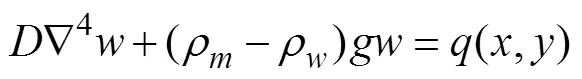
whereis the flexural rigidity;is the lithospheric flexure;andare the mantle density and water density, re- spectively;is the gravitational acceleration; and(,) is the applied loads. The values are given in Table 1.
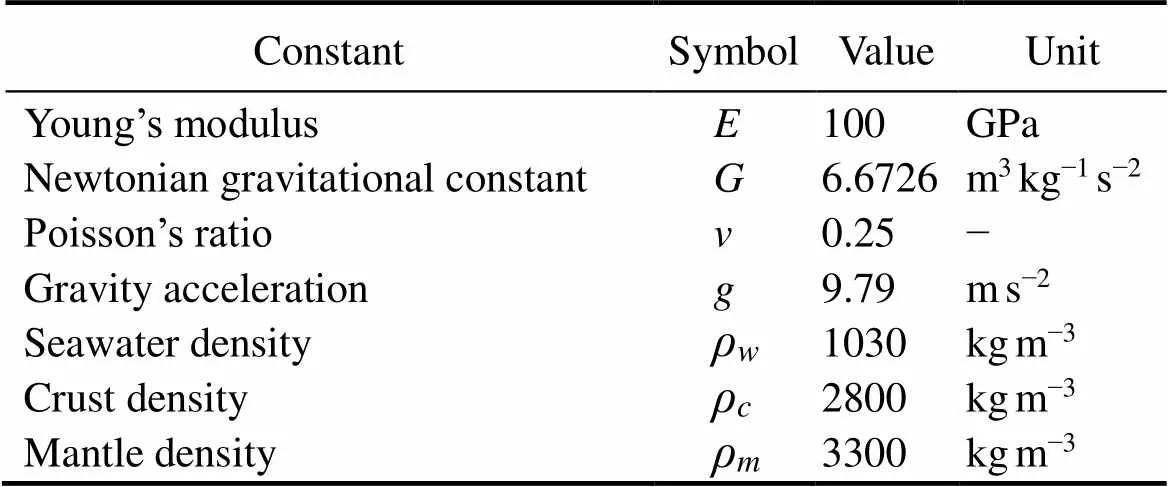
Table 1 Symbols and values of constants
The flexural rigidity is given by:
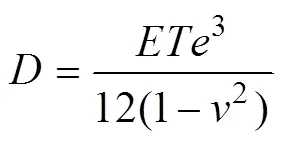
whereis Young’s modulus,is the Poisson’s ratio, andis the lithospheric effective elastic thickness. The va- lues are given in Table 1. Assuming thatandare constant,controls the lithospheric strength. A largereflects high lithospheric strength, indicating that the lithospheric bending degree is small, and the large part of loads is supported by elastic stress, and.
The observed admittanceobs() is given by:

whereis the 2D wavenumber,S()is the cross-power spectrum of topography and free-air gravity anomaly, andS() is the auto-power spectrum of topography. The angle bracket denotes averaging over annular wavenumber bins.
The predicted admittancepre() is given by:
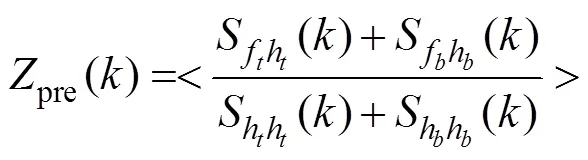
The best fitis the one with the minimal weighted root- mean-square error:
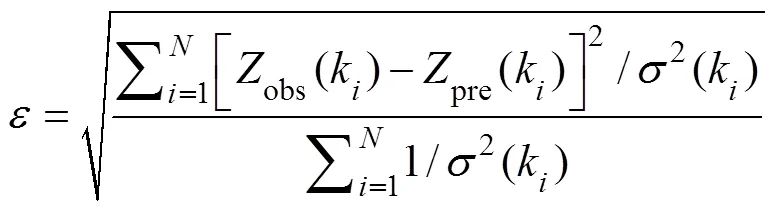
whereis the number of annular wavenumber bins,kis thewavenumber (=1, 2, …,), and2(k)is the varianceof the observed admittance calculated by the jackknife me- thod and averaged within annular bins.
We divided the study area into overlapping windows with a spacing of 40km in order to obtain spatial variations in. In each window, the observed admittance and predicted admittance are calculated assuming a spatially constant. The choice of window size is critical in the MWAT method because it limits the wavelength information of data (Pérez-Gussinyé., 2004; Audet., 2007; Jiménez-Díaz., 2014). Small windows can reflect the features of short wavelengths and have a high spatial re- solution; however, they cannot solve the long flexural wave- length; large windows have more accuratevalues but will smoothen the results, thus degrading the spatial re- solution (Jiménez-Díaz., 2014). To combine the advantages of windows of different sizes, we referred to the approach of Pérez-Gussinyé. (2009b) to improve the MWAT. First, we tested the influence of three windows (400km×400km, 600km×600km, and 800km×800km) on the recoveredusing synthetic topography and free- air gravity anomaly data. Then, we corrected the bias due to tapering and windowing. Finally, we merged the corrected results of the three windows.
3.3 Tests with Synthetic Topography and Free-Air Gravity Anomaly Data
We placed the uncorrelated surface (H()) and internal (W()) mass loads, generated by a random process, on a thin elastic plate of knownto obtain synthetic topo- graphy and gravity anomaly data (Kirby and Swain, 2008). To make the power spectra of surface and internal mass loads mimic that of the actual topography, we generated load surfaces with fractal dimensions of 2.5, following the ‘spectra synthesis’ method of Peitgen and Saupe (1988). We assumed that the ratio between the internal and surface load amplitudes()=(−)W()/(−)H()was constant and set()=0.5.
The final bathymetry () and Moho deflection () are respectively given by:
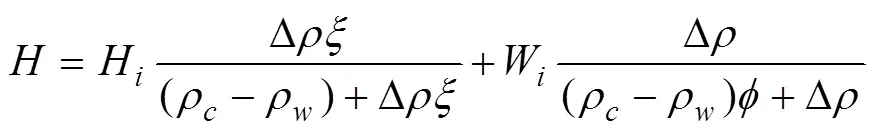
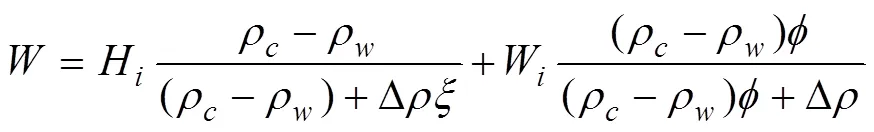
We used the fourth-order finite amplitude formula of Parker (1973) to generate the Bouguer gravity anomaly. Finally, we employed the first-order finite amplitude formula to obtain the free-air gravity anomaly:
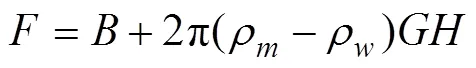
whereis the gravitational constant. The values are given in Table 1.
Fig.2 shows the mean and standard deviation of reco- veredresulting from the conduct of 100 experimentswith synthetic topography and free-air gravity anomaly data- sets, each generated from the sameconstant. Results showed that, for a given window, the standard deviation and downward bias increased with increasing input(Fig.2). In addition, for a given, a larger window produced more accurateestimates. To eliminate the bias error of the recovered, we constructed the functionwinbetween inputand recoveredusing cubic spline interpolation. The inverse function ofwinwas used as a correction factor to correct the recoveredof the three windows. For an elastic plate with a uniform, its flexural wavelength approximated the wavelength formula≈293/4(Swain and Kirby, 2003). According to the flexural wavelength formula, the maximum recoveredof the 400km×400km, 600km×600km, and 800km×800km windows were 33.08, 56.8, and 83.35km, respectively. Therefore, for<33.08km, 33.08km<<56.8km and>56.8km, we used the correctedresults of the 400km×400km, 600km×600km, and 800km×800km windows, respectively. The finalresults combine the high spatial resolution feature of small windows and the high accuracy feature of large windows.
3.4 Sensitivity to Data Grid Spacing
Spectral methods usually ignore the influence of data grid spacing onestimates, which might lead to significantbias in areas with high terrain variability. Meanwhile, the smaller data grid spacing can increase the amount of data on the annular wavenumber bins, which can improve the accuracy ofinversion (Yang., 2012). Yang. (2012) analyzed the influence of data grid spacing oninversion and found that the standard deviation ofinversion decreased with the decrease of data grid spacing. Although smaller data grid spacing can obtain betterresults, this can actually increase the calculating time. There-fore, the commonly used maximum and minimum grid spacing are 20 and 8km, respectively.
订货成本是指企业在决定购买某种或是某些产品后向供应商发出订单而发生的成本,主要包括内部人员费用和管理费用。企业订购成本主要特征是与采购次数有关,而与企业订货量大小无关。
To test the sensitivity to the data grid spacing ofin the study region, we used input data with grid spacings of 20 and 8km to calculate theresults of the Mariana sub- duction zone and surrounding regions, respectively. Fig.3 presents theresults using input data with grid spacings of 20 and 8km, which we call-20 and-8, respectively. As shown in the figure, although they have almost the sameresults in the Pacific plate, significant differences can be observed in the Mariana trench-arc-basin system, suggesting that data grid spacing has a large influence on the recoveredof the subduction zone.-8showed thatdecreases rapidly from the outer-rise region to the trench axis and that the trench and neighboring regions had lowvalues (Figs.3a–3c). However,-20 showed thatdid not decrease from the outer-rise region to the trench axis, although there was an obviously highband along the trench (Fig.3d–3f).
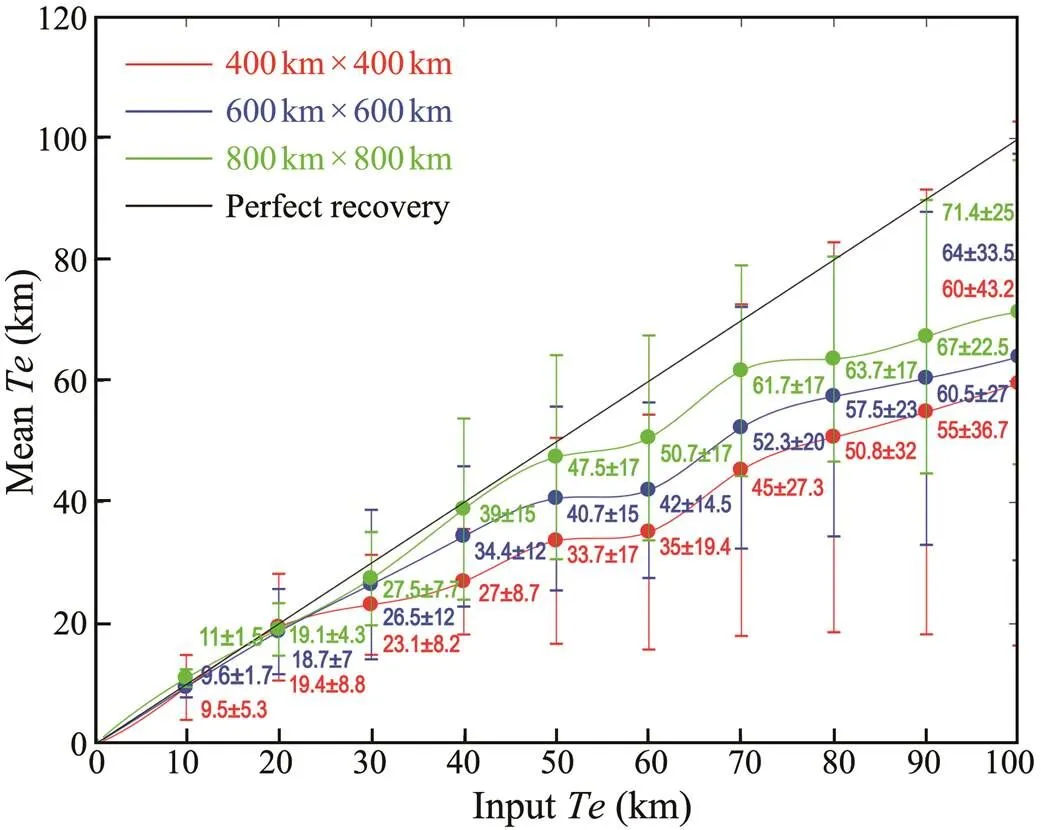
Fig.2 Mean recovered Te and its standard deviation versusinput Te from tests with 100 synthetic topography and free-air gravity anomaly datasets generated using a spatially con- stant input Te. The red line indicates the 400km×400kmwindow, the blue line indicates 600km×600km, the green line indicates 800km×800km, and the black line indicates perfect recovery.
According to the literature,is strongly related to the thermal structure of the lithosphere (Kalnins and Watts, 2009). Ebinger. (1989) proposed that magmatism caninduce the thermal softening of the lithosphere, thereby re-ducing the strength of the lithosphere. The presence of back-arc spreading and an active magmatic arc indicates the occurrence of considerable magmatism in the back-arc re- gion of the Mariana Trench (Bai., 2018). In addition, the downward bending of the subducting plate by subduction produces a large number of faults, which in turn, re- duce the strength of the subducting plate around the trench(Bry and White, 2007; Zhang., 2014; Bai., 2018). Therefore, the lithosphere of the trench and neighboring regions should be weak. The-8 results more accurately reflect the variation of lithospheric strength of the trench and neighboring regions. Thus, we used-8 results in the following analyses.
4 Results
Fig.4 shows theresults in the Mariana subduction zone and surrounding regions after applying the window correction. Although theestimates of the three windows vary in terms of their absolute values and at short wavelengths, they generally have similar variation patterns. The lowestvalue mainly occurs in the Mariana trench-arc- basin system. The maximumvalue occurs in the outer- rise region and decreases rapidly toward the trench axis.
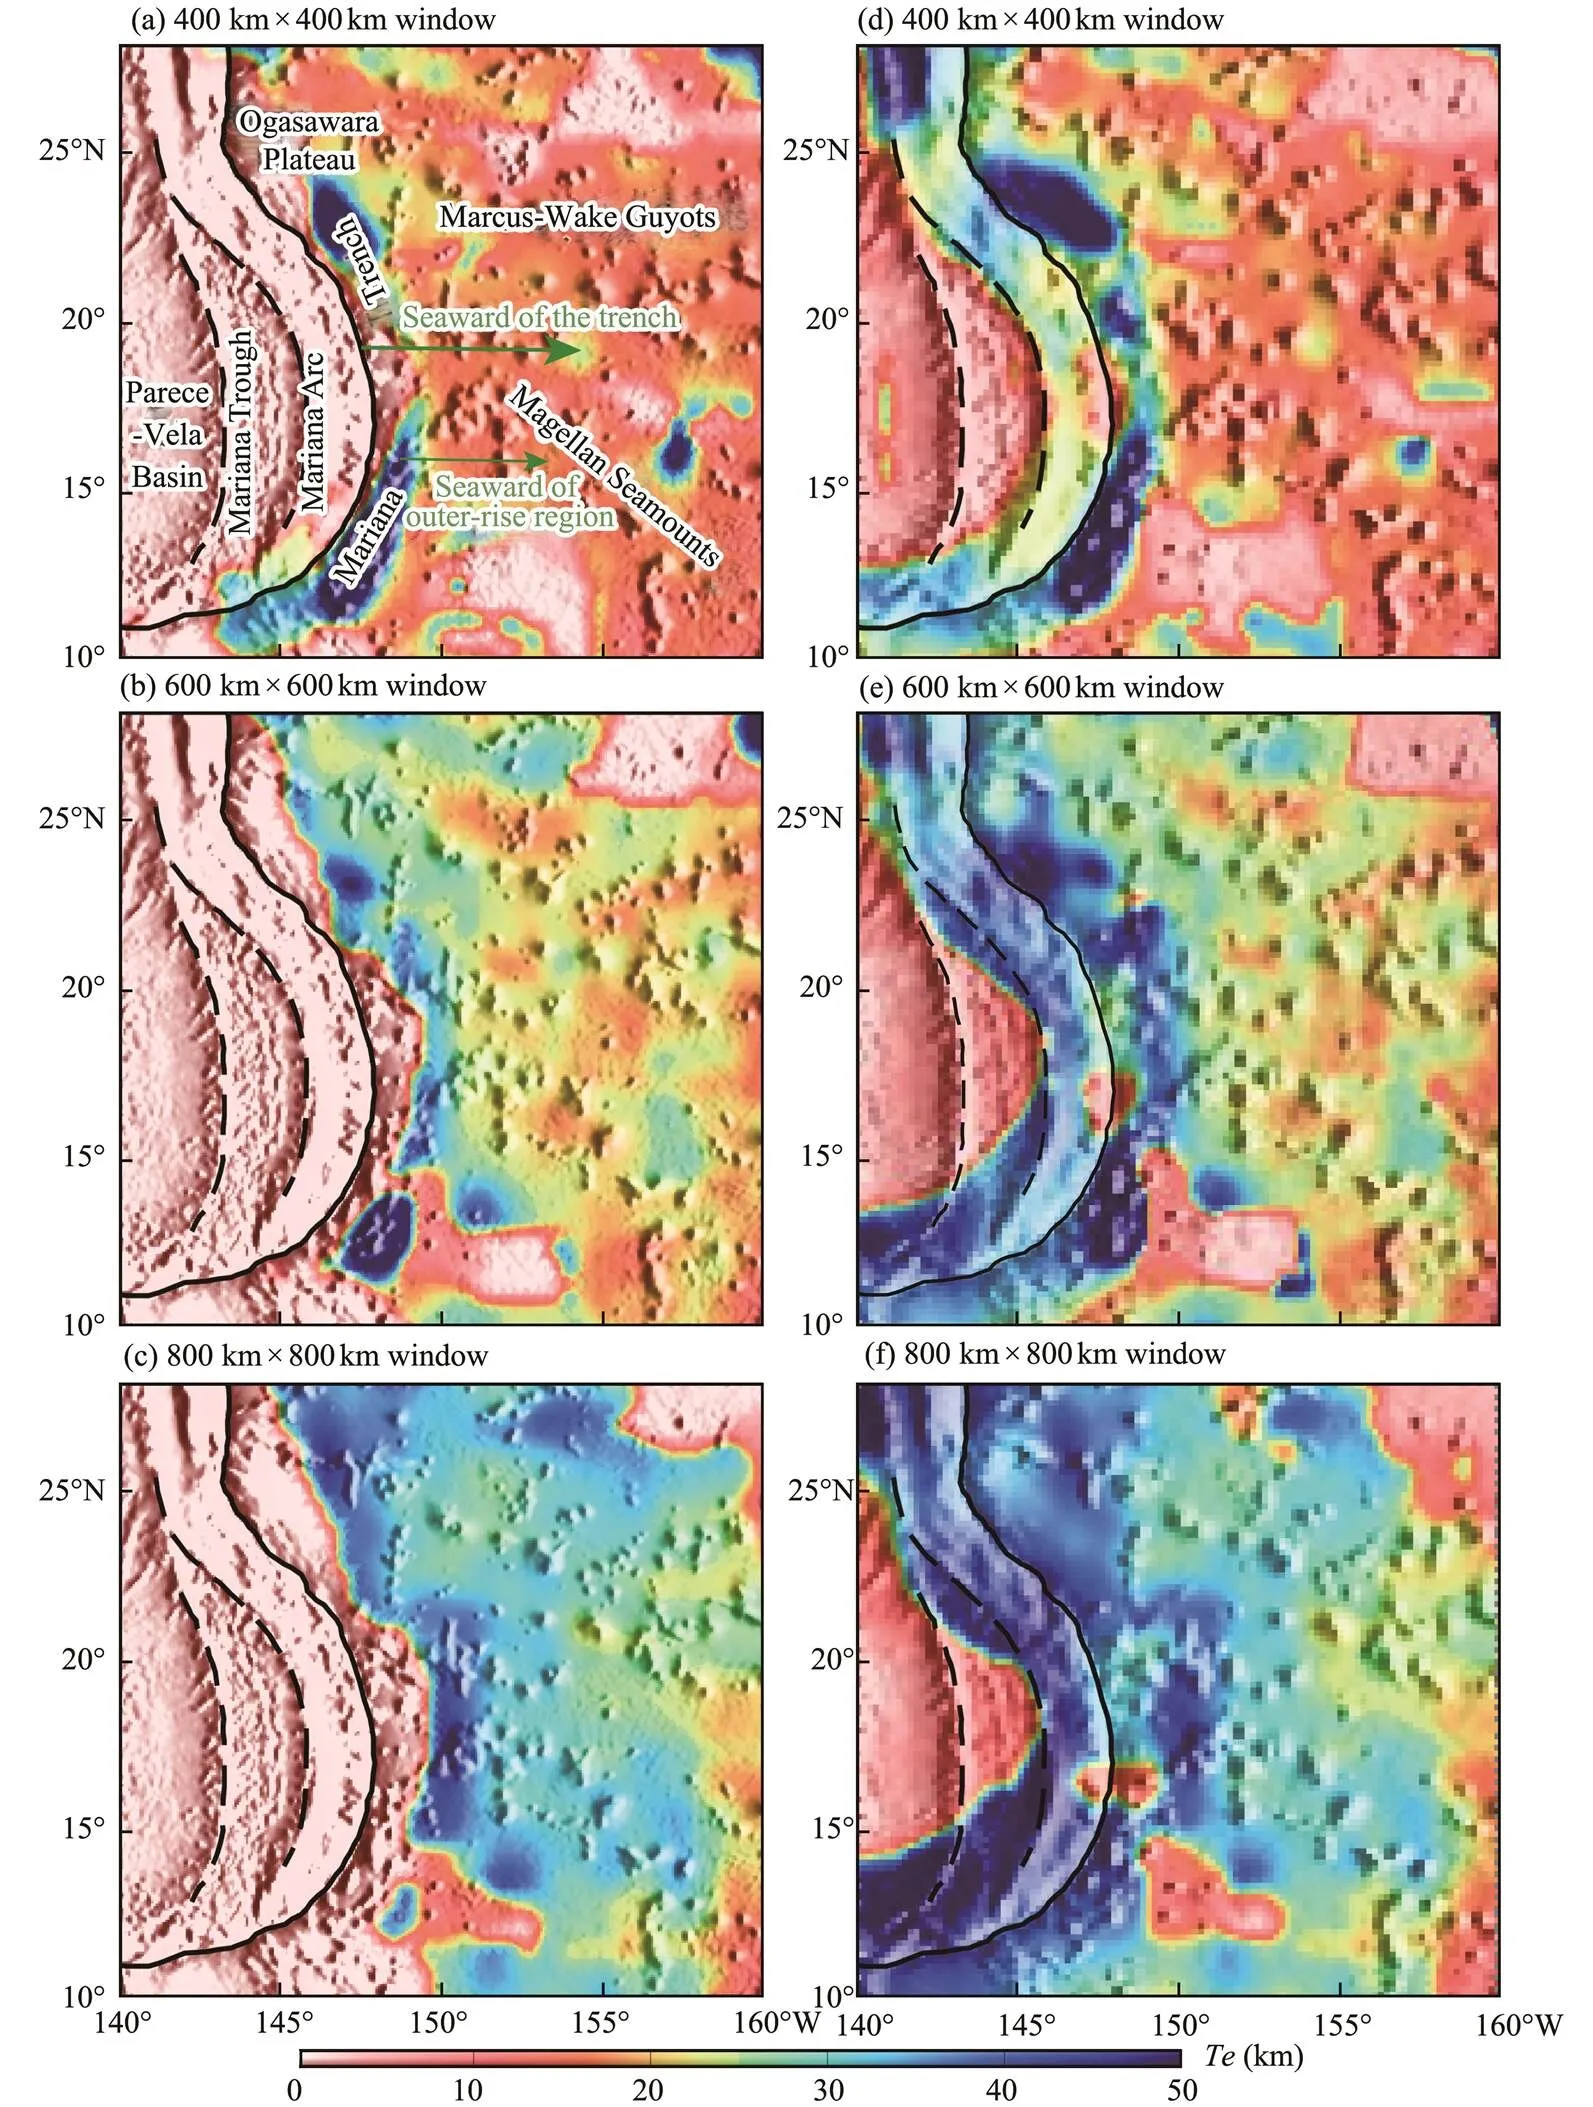
Fig.3 Panels (a) to (c) show Te-8 results of the study region for three different window sizes; panels (d) to (f) show Te-20 results of the study region for three different window size sizes.
Fig.5 presentsafter we merged the bias-correctedresults from the three windows. Although the finalre- sults retain the large-scale features of the large windows, they are better able to solve the short wavelength variations inthan theresults using only the 800km×800kmwindow. Thevalues of the Mariana subduction zone and surrounding regions range from 0 to 47km, and the pattern ofvariations coincides with tectonic provinces in the study area. Furthermore, the Pacific Plate and Ma- riana trench-arc-basin system obviously have high(mean of 23km) and low(2km), respectively.
Our results also show a moderateband (13–15km) along the Marcus-Wake Guyots (MWG) and Magellan Sea-mounts, consistent with theresults of Kalnins and Watts (2009). In the region without seamounts, the Pacific Plate is not characterized by relatively uniform highvalues (30km), and there are some lowvalue zones (2km), in- dicating that lithospheric rheology is heterogeneous. Thevalues decrease sharply from 40 to 2km near the trench- ward side of the outer-rise region, forming a narrowly steep gradient zone.
In the southern part of the Mariana Trench, there are two moderate to highvalue narrow circle zones (18 and 30km), which are the margins of hightraps in the 400km×400 and 600km×600km windows, respectively (Fig.4). Hereabruptly changes with a large anomalous gradient, which should be an artifact of the inversion.
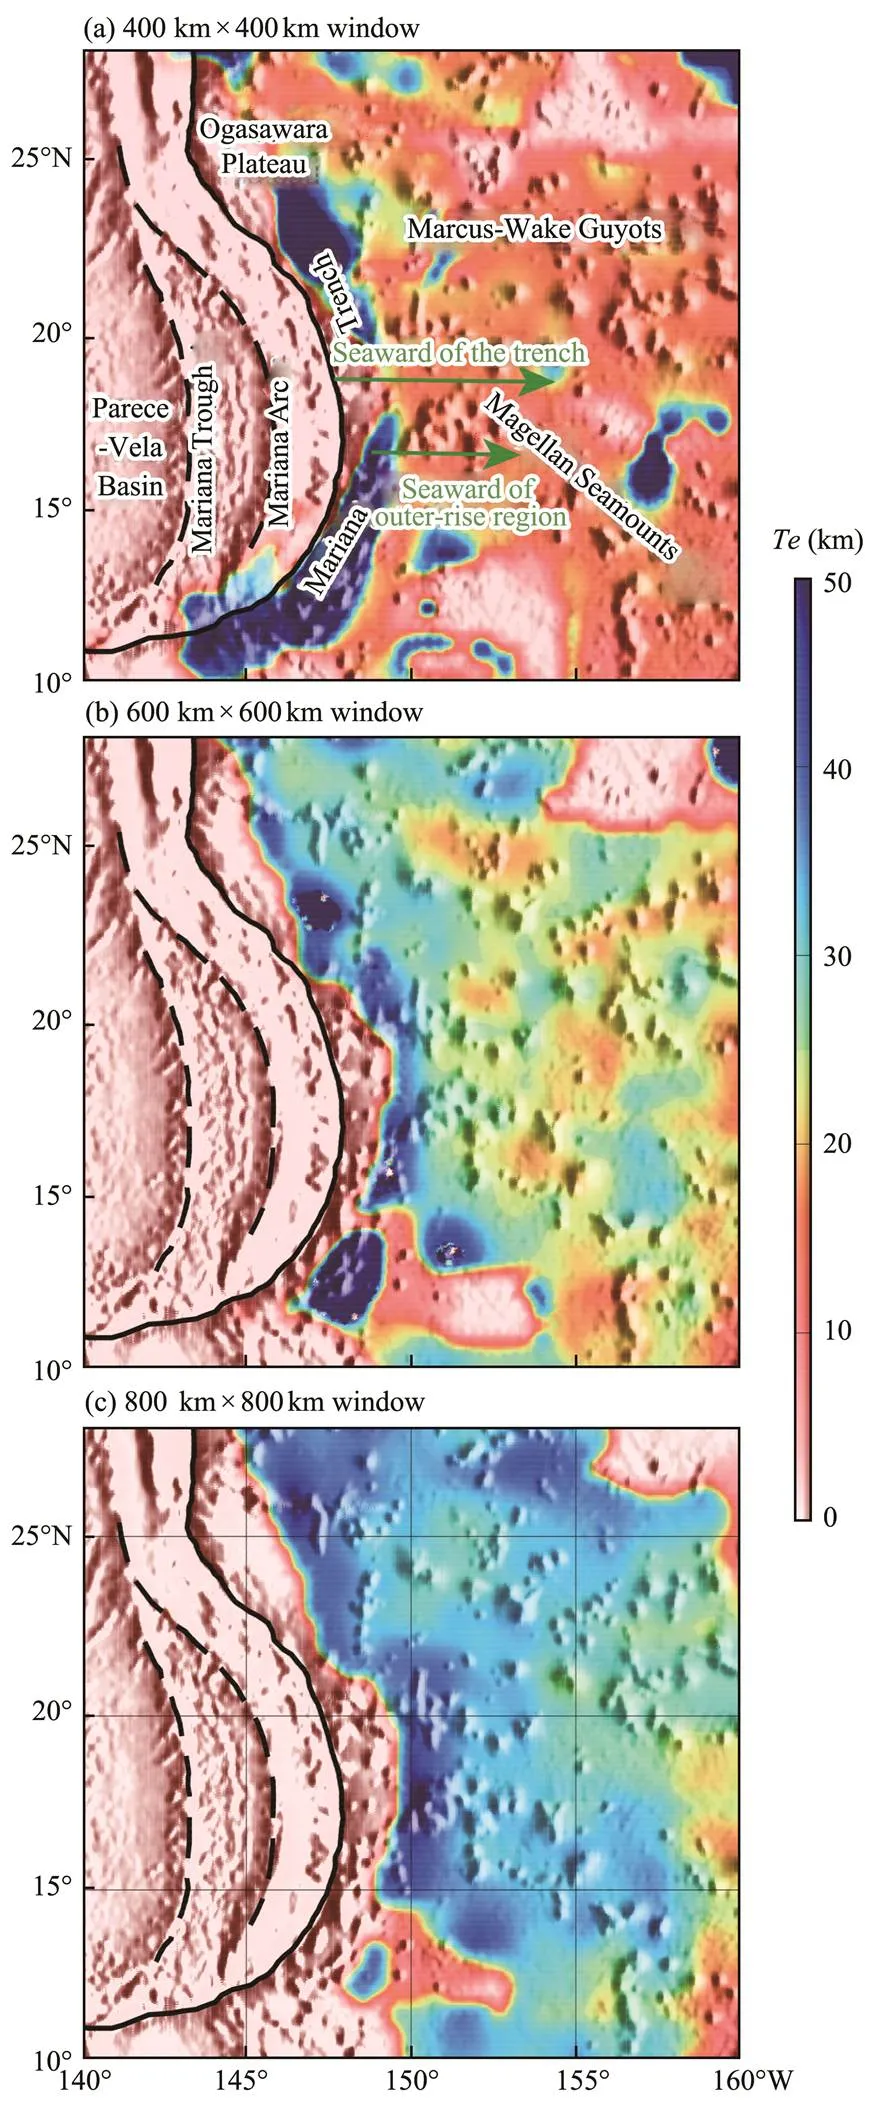
Fig.4 Panels (a) to (c) show Te-8 results of the study region for three different window sizes after correction for downward bias related to windowing.
5 Discussion
In contrast with the continental lithosphere, the oceanic lithosphere has a more homogeneous composition and thin-ner crust. Plate cooling is the main controlling factor of the oceanic lithosphere temperature. Therefore, the strength of the oceanic lithosphere is closely related to plate age: the lithosphere is expected to be colder and stronger with age (McNutt, 1984; Lowry and Smith, 1995). However, tec- tonic-magmatic activities likely lead to the thermal/me-cha- nical rejuvenation of the lithosphere, resulting in a reduc- tion in lithospheric strength (Pérez-Gussinyé., 2009a; Ratheesh Kumar and Windley, 2013; Ji., 2017; Ling., 2021). Therefore, the spatial variation incan re- flect the tectonic evolutionary processes of the tectonic pro- vince.

Fig.5 The final Te results of Mariana subduction and surrounding regions after merging bias-corrected Te from the three different window. The red line indicates the location of identified breaking distance in the study. The blue line indicates the location of breaking distance of Zhang et al. (2014). The green lines indicate the location of cross-sec- tions that calculate subduction dip angle (Xing et al., 2016).
5.1 Moderate Te in Seamounts and ‘Fossil’ Rheological State
The subducting Pacific plate is one of the oldest oceanic lithospheres (145–170Myr) in the world, but our results indicate that MWG and Magellan Seamounts are characterized by moderateof 13–15km. It is commonly accepted thatreflects the lithospheric equilibrium deve- loped at the time of loading, suggesting that it may reflect the ‘fossil’ rheological state of the lithosphere in some cases (Pérez-Gussinyé., 2009a). According to Ar/Ar dating (Koppers., 2000) and seafloor age (Müller., 2008), the MWG and Magellan Seamounts formed on the lithosphere are 30–90Myr old. Therefore, the Pacific Plate had relatively weak lithospheric strength during the formation of the seamounts. Kalnins and Watts (2009) analyzed the relationship betweenand lithosphere age at the time of loading and found thatin the MWG and Magellan Seamounts corresponds to a low-controlling iso- therm (200℃). They suggested that the MWG and Magellan Seamounts may have been affected by the South Pacific Isotopic and Thermal Anomaly (SOPITA). The strong magmatic activities of the SOPITA rejuvenated the lithosphere, which in turn, significantly weakened the streng- th of the lithosphere. The isostatic response of seamounts can only record the decrease in lithospheric strength, which means that if the new strength of the lithosphere is not weaker than that of the seamount, theof the seamount will reflect the initial lithospheric strength rather than the current lithospheric strength (Billen and Gurnis, 2005; Arredondo and Billen, 2012). Therefore, we suggestthat the moderatein the seamounts probably reflects the lithospheric properties at the time of seamount formation.
5.2 High Te on the Seaward Side of the Outer-Rise Region and Flexure of the Lithosphere
Previous studies on subduction zones have shown that subducting plates have a pattern of highon the seaward side of the outer-rise region (Kalnins and Watts, 2009; Zhang., 2014; Yang and Fu, 2018). Our results also reveal that the lithospheric strength of the Pacific Plate increases sharply from 20 to 40km near the seaward side of the outer-rise region, indicating that the Pacific Plate has high lithospheric strength. During subduction, sinking plates bend under various types of tectonic stresses and interact with overriding plates. Furthermore, flexural bending produces deep trenches and gentle seafloor uplift near the seaward side of the outer-rise region (Hanks, 1971; Bodine and Watts, 1979; Bry and White, 2007; Zhang., 2014). There is a need for stress to re-equilibrate the lithosphere when a new load occurs (Pérez-Gussinyé., 2009a). The seafloor bulging caused by flexural bending is equivalent to load exertion on the lithosphere, which does not break un- der bending force at this time. Therefore, we suggest that the highon the seaward side of the outer-rise region reflects the current lithospheric properties of the Pacific Plate.
5.3 Low Te, Faulting, and Magmatism
Arredondo and Billen (2012) studied the flexural rigi- dity of subduction zones using a spectral method and found that thein subduction zones decreased rapidly toward the trench axis, while thenear the trench axis is only 1–2km. The outer-rise region section of our results is consistent with that reported by Zhang. (2014), while thetrench axis section of our results is consistent with the finding of Arredondo and Billen (2012). With increasing bending degree, the bending stress could exceed the rock yield strength, causing a large number of faults. Zhou and Lin (2018) identified the normal faults near the Mariana Trench using multibeam bathymetry data and found that such faults were mostly initiated in the outer-rise region and developed toward the trench axis. Faulting not only weakens lithospheric strength but also produces a number of fractures that could carry massive amounts of seawater into the mantle, thus altering peridotite to mechanically weak serpentinite (Amiguet., 2012; Schwartz., 2013). The mantle serpentinite can significantly reduce lithosphe- ric strength (Escartín., 2001; Schlindwein and Schmid, 2016).
Meanwhile, Zhou and Lin (2018) showed that normal fault penetration to depth in the upper mantle at the Ma- riana Trench is more than 14km. Therefore, a large amount of seawater can enter the mantle through faults, resulting in significant serpentinization of the mantle. In turn, mantle serpentinization further weakens the lithospheric strength. Therefore, the lithospheric strength of the Pacific Plate weakens rapidly near the trench-ward side of the outer-rise region. These normal faults also ruptured the subducting seamounts.
Related to the above, Fryer and Smoot (1985) investigated seamounts approaching the Mariana Trench and found that seamounts with a diameter of less than 40km may have a higher degree of rupture than the surrounding seafloor, while seamounts with a diameter of more than 40 km are divided into multiple blocks by faults. The Ogasa- wara Plateau is subducting into the Mariana Trench. Our results show that the Ogasawara Plateau is characterized by a lowvalue. Thus, we suggest that faults caused by bending stress ruptured the Ogasawara Plateau reducing the lithospheric strength.
Furthermore, our results show that the Mariana trench- arc-basin system has abnormally weak lithospheric strength(2km), which is consistent with Bai. (2018). Bai. (2018) estimatedover the Izu-Bonin-Mariana subduction zone using topography and gravity anomaly data that remove the effects of dynamic topography and found that the Mariana trench-arc-basin system is characterized by a lowvalue. In addition, the subduction of the Pacific Plate resulted in the back-arc spreading and magmatism, significantly reducing the lithospheric strength. Therefore, the lithosphere of the back-arc region of the Mariana Trenchshould be weak. At the southern part of the Mariana Trench, the subducting plate has a weak lithosphere (2km), which may be attributed to the collision between the trench and the Caroline Plate, as well as the heating of the Caroline hot spot (Fig.1).
5.4 Te, Breaking Distance, and Subduction Dip
According to the model of plate flexural bending, the breaking distance is the distance from the position where thedecreases sharply near the out-rise region to the trench axis (Zhang., 2014; Zhou and Lin, 2018; Zhou., 2018). Thus, the reducedreflects the onset of pervasive normal faulting and mechanical weakening by faulting (Zhang., 2014). Zhang. (2014) have shown thatreduction occurs at a breaking distance of 60–125km from the Mariana Trench axis (Fig.5). Our re- sults reveal that the reduction in lithospheric strength occurs at a breaking distance of 0–250km from the trench axis (Fig.5). The maximum (200–250km) and minimum (0–40km) distance occur on the Ogasawara Plateau and in re- gions without seamounts (21˚–22.5˚N), respectively. At the central part of the Mariana Trench, the breaking distance ranges from 62 to 128km, consistent with Zhang. (2014). However, in the northern part of the Mariana Trench(north of 20˚N), our results are significantly different from those of Zhang. (2014). In particular, Zhang. (2014) lacked high-resolution multibeam bathymetric dataat the northern part of the trench axis (21˚–22.5˚N), which prevented the identification of the onset location of normal faults and was likely to affect their results to some extent. The northern part of the Mariana Trench is composed of a region with seamounts (Ogasawara Plateau) and a region without seamounts, whose breaking distances are 200–250km and 0–40km, respectively. The region with seamounts has a shallower trench relief, smaller axial vertical force, larger bending moment, and higher topographic bulger at the outer rise than the region without seamounts (Zhang., 2014). The Ogasawara Plateau is a large seamount with a diameter of over 150km. Thus, we suggest that the Ogasawara Plateau increasesthe mass load of the subducting plate. This causes the sub-ducting plate to be subjected to a larger bending moment, resulting in sig- nifi- cant deformation and breakage. In addition, the resistance of the Ogasawara Plateau to subduction might induce a sig- nificant horizontal bending force, which transfers through the plate and leads to more extensive lithospheric rupture.
Xing. (2016) used the distribution of earthquake sources to obtain the subducting dip angle of the Izu-Bo- nin-Mariana subduction zone (Fig.5). In the current study, we investigate the subduction tectonics of the Mariana subduction zone by analyzing the relationship between the subduction dip angle and breaking distance. As shown in Fig.6, there is a positive correlation between the subduction dip angle and breaking distance, indicating that the effective elastic thickness of the lithosphere has a certain effect on the subduction. On the whole, the subduction dip angle increases as the breaking distance increases. Thus, we suggest that the subducting plate with a larger breaking distance is more likely to form a larger subduction angle.
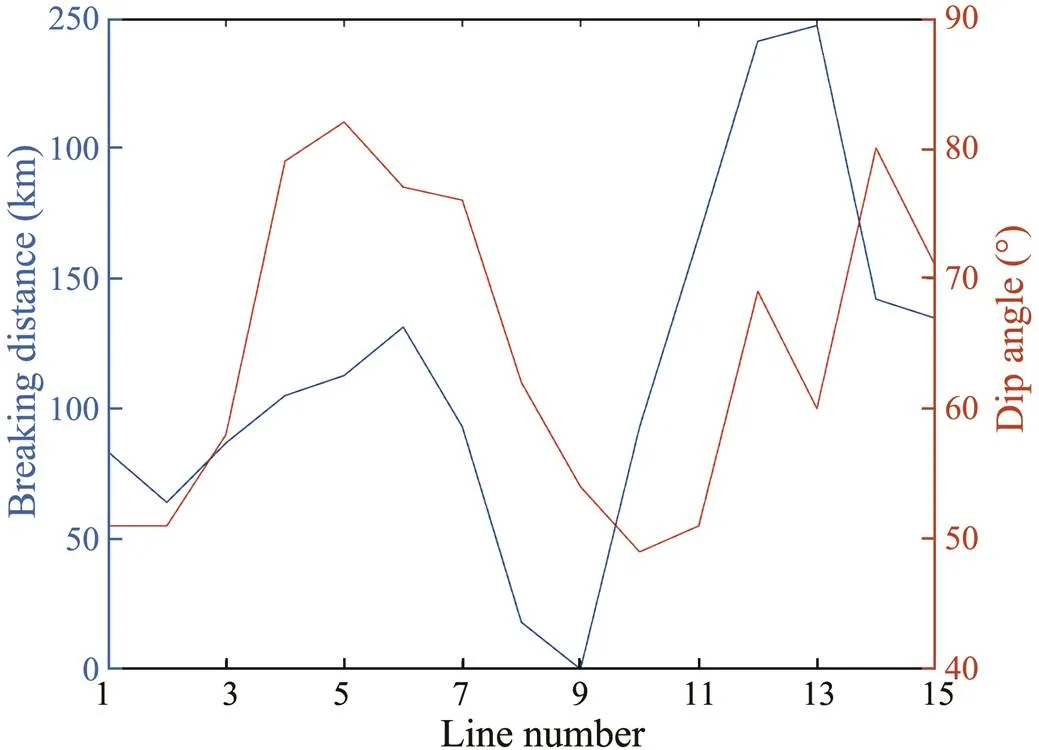
Fig.6 Plate-breaking distance versus subduction dip angle. The subduction dip angle data is from Xing et al. (2016).
Furthermore, according to the formula of the bending moment, under the same compressive stress and rigidity, a longer arm of force corresponds to a larger bending mo- ment, resulting in a more obvious bending deformation. The subducted plate is similar to an elastic plate subjected to compressive stress; thus, the breaking distance is the arm of force. Therefore, a larger breaking distance produces a larger bending moment, such that the subducting plate more easily bends and deforms, resulting in a larger subduction dip angle.
6 Conclusions
We obtained the spatial variations ofin the Mariana subduction zone and surrounding regions using the improved MWAT method. Thein the study region ranges from 0 to 47km. The results reveal that the pattern ofvariations coincides with tectonic provinces in the study area. The lithosphere of the trench-arc-basin system of the Mariana subduction zone is characterized by a low(2km). Thevalues of the MWG and Magellan Seamounts range from 13 to 15km. Theof the subducting plate decreases rapidly from the outer-rise region (40km) to the trench axis (1–2km). The transition from highvalues to lowvalues occurs at a breaking distance of 0–250km from the trench axis. Our analysis ofallowed us to reach the following conclusions:
1) The intermediatevalues in seamounts and highvalues on the seaward side of the outer-rise region reflectthe ‘fossil’ rheological state and current lithospheric streng- th of the Pacific plate, respectively.
2) The faulting induced by the downward bending ruptures the lithosphere and weakens lithospheric strength. Furthermore, as a large amount of seawater enters the mantle through faults, this phenomenon results in the significant serpentinization of the mantle, which further reduces the lithospheric strength.
3) The Ogasawara Plateau has the greatest breaking dis- tance. Therefore, we suggest that the Ogasawara Plateau increases the mass load of the subducting plate, resulting in a larger bending moment so that it is easier to break. In addition, the resistance of this plateau to subduction might induce a significant horizontal bending force, leading to more extensive lithospheric rupture.
4) A good positive correlation exists between the subduction dip angle and breaking distance. Thus, we suggest that the subducting plate with a larger breaking distance is likely to form a larger subduction angle.
Acknowledgements
This research was supported by the National Natural Science Foundation of China (Nos. 41676039 and 42070 61006), and the Shandong Young Teacher Growth Program.
Amiguet, E., Reynard, B., Caracas, R., Moortèle, B. V. D., Hi- lairet, N., and Wang, Y., 2012. Creep of phyllosilicates at the onset of plate tectonics., 345-348: 142-150, DOI: 10.1016/j.epsl.2012.06.033.
Arredondo, K. M., and Billen, M. I., 2012. Rapid weakening of subducting plates from trench-parallel estimates of flexural ri- gidity., 196-197: 1-13, DOI: 10.1016/j.pepi.2012.02.007.
Asada, M., Deschamps, A., Fujiwara, T., and Nakamura, Y., 2007. Submarine lava flow emplacement and faulting in the axial valley of two morphologically distinct spreading segments of the Mariana back-arc basin from Wadatsumi side-scan sonar images., 8 (4): Q04001, DOI: 10.1029/2006GC001418.
Audet, P., Jellinek, A. M., and Uno, H., 2007. Mechanical con- trols on the deformation of continents at convergent margins., 264 (1-2): 151-166, DOI: 10.1016/j.epsl.2007.09.024.
Bai, Y., Dong, D., Kirby, J. F., Williams, S. E., and Wang, Z., 2018. The effect of dynamic topography and gravity on lithospheric effective elastic thickness estimation: A case study., 214 (1): 623-634, DOI: 10.1093/ gji/ggy162.
Billen, M. I., and Gurnis, M., 2005. Constraints on subducting plate strength within the Kermadec Trench., 110 (B5): B05407, DOI: 10. 1029/2004JB003308.
Bodine, J. H., and Watts, A. B., 1979. On the lithospheric flexureseaward of the Bonin and Mariana Trenches., 43 (1): 132-148, DOI: 10.1016/0012-821 X(79)90162-6.
Brown, C. D., and Phillips, R. J., 2000. Crust-mantle decoupling by flexure of continental lithosphere., 105 (B6): 13221-13237, DOI: 10.1029/ 2000JB900069.
Bry, M., and White, N., 2007. Reappraising elastic thickness va- riation at oceanic trenches., 112 (B8): B08414, DOI: 10.1029/2005JB004190.
Burov, E. B., and Diament, M., 1995. The effective elastic thickness of () continental lithosphere: What does it really means?, 100 (B3): 3905-3927, DOI: 10.1029/94JB02770.
Christensen, D. H., and Ruff, L. J., 1983. Outer-rise earthquakes and seismic coupling., 10 (8): 697- 700, DOI: 10.1029/GL010i008p00697.
Ebinger, C. J., Bechtel, T. D., Forsyth, D. W., and Bowin, C. O., 1989. Effective elastic plate thickness beneath the East African and Afar Plateaus and dynamic compensation of the uplifts., 94 (B3): 2883-2901, DOI: 10.1029/JB094iB03p02883.
Escartín, J., Hirth, G., and Evans, B., 2001. Strength of slightly serpentinized peridotites: Implications for the tectonics of oceaniclithosphere., 29 (11): 1023-1026, DOI: 10.1130/0091- 7613(2001)029<1023:SOSSPI>2.0.CO;2.
Forsyth, D. W., 1985. Subsurface loading and estimates of the flexural rigidity of continental lithosphere., 90 (B14): 12623-12632, DOI: 10. 1029/JB090iB14p12623.
Fryer, P., 1996. Evolution of the Mariana convergent plate marginsystem., 34 (1): 89-125, DOI: 10.1029/ 95RG03476.
Fryer, P., and Smoot, N. C., 1985. Processes of seamount subduction in the Mariana and Izu-bonin Trenches., 64 (1-2): 77-90, DOI: 10.1016/0025-3227(85)90161-6.
Gardner, J. V., 2010. The west Mariana Ridge, western Pacific Ocean: Geomorphology and processes from new multibeam data., 122 (9-10): 1378-1388, DOI: 10.1130/B30149.1.
Hall, R., Ali, J. R., Anderson, C. D., and Baker, S. J., 1995. Origin and motion history of the Philippine Sea Plate., 251 (1-4): 229-250, DOI: 10.1016/0040-1951(95)00 038-0.
Hanks, T. C., 1971. The Kuril trench-Hokkaido rise system: Large shallow earthquakes and simple models of deformation., 23 (2): 173-189, DOI: 10.1111/j.1365-246X.1971.tb01811.x.
Hilde, T. W. C., 1983. Sediment subductionaccretion around the Pacific., 99 (2-4): 381-397, DOI: 10.1016/0040-1951(83)90114-2.
Ishizuka, O., Hickey-Vargas, R., Arculus, R. J., Yogodzinski, G. M., Savov, I. P., Kusano, Y.,., 2018. Age of Izu-Bonin- Mariana Arc basement., 481 (10): 80-90, DOI: 10.1016/j.epsl.2017.10.023.
Ishizuka, O., Tani, K., Reagan, M. K., Kanayama, K., Umino, S., and Harigane, Y., 2011. The timescales of subduction initia- tion and subsequent evolution of an oceanic island arc., 306 (3-4): 229-240, DOI: 10. 1016/j.epsl.2011.04.006.
Ji, F., Gao, J., Shen, Z., Li, F., Zhang, Q., and Li, Y., 2017. Va- riations of the effective elastic thickness over the Ross Sea and Transantarctic Mountains and implications for their structure and tectonics., 717: 127-138, DOI: 10.1016/j. tecto.2017.07.011.
Jiménez-Díaz, A., Ruiz, J., Pérez-Gussinyé, M., Kirby, J. F., Álvarez-Gómez, J. A., Tejero, R.,., 2014. Spatial variations of effective elastic thickness of the lithosphere in central America and surrounding regions., 391: 55-66, DOI: 10.1016/j.epsl.2014.01.042.
Kalnins, L. M., and Watts, A. B., 2009. Spatial variation in ef- fective elastic thickness in the western Pacific Ocean and theirimplications for Mesozoic volcanism., 286 (1-2): 89-100, DOI: 10.1016/j.epsl.2009.06. 018.
Kato, T., Beavan, J., Matsushima, T., Kotake, Y. J., Camacho, T., and Nakao, S., 2003. Geodetic evidence of back-arc spreading in the Mariana Trough., 30 (12): 1625, DOI: 10.1029/2002GL016757.
Kirby, J. F., and Swain, C. J., 2008. An accuracy assessment of the fan wavelet coherence method for elastic thickness estimate., 9 (3): Q03022, DOI: 10.1029/2007GC001773.
Koppers, A., Staudigel, H., and Wijbrans, J. R., 2000. Dating cry- stalline groundmass separates of altered Cretaceous seamount basalts by the40Ar/39Ar incremental heating technique., 166 (1): 139-158, DOI: 10.1016/S0009-2541(99) 00188-6.
Laske, G., Masters, G., Ma, Z., and Pasyanos, M., 2013. Update on CRUST 1.0-A 1-degree global model of Earth’ crust., 15: EGU2013-2658.
Lefeldt, M., Ranero, C. R., and Grevemeyer, I., 2012. Seismic evidence of tectonic control on the depth of water influx into incoming oceanic plates at subduction trenches., 13 (5): Q05013, DOI: 10.1029/2012 GC004043.
Ling, Z. L., Zhao, L. H., Zhang, T., Zhai, G. J., and Yang, F. L., 2021. The effective elastic thickness of the lithosphere in the Amerasia Basin, Arctic Ocean., 33 (4): 400-406, DOI: 10.1111/ter.12524.
Lowry, A. R., and Smith, R. B., 1995. Strength and rheology of the western U. S. Cordillera., 100 (B9): 17947-17963, DOI: 10.1029/JB090iB 14p12623.
Lowry, A. R., Ribe, N. M., and Smith, R. B., 2000. Dynamic elevation of the Cordillera, western United States., 105 (B10): 23371-23390, DOI: 10.1029/2000JB900182.
Maunder, B., Prytulak, J., Goes, S., and Reagan, M., 2020. Rapid subduction initiation and magmatism in the western Pacific driven by internal vertical forces., 11 (1): 1874, DOI: 10.1038/s41467-020-15737-4.
McNutt, M. K., 1984. Lithospheric flexure and thermal anomalies., 89 (B13): 11180- 11194, DOI: 10.1029/JB089iB13p11180.
Melosh, H. J., 1978. Dynamic support of the outer rise., 5 (5): 321-324, DOI: 10.1029/GL005i005p 00321.
Müller, R. D., 2008. Age, spreading rates, and spreading asymmetry of the world’s ocean crust., 9 (4): Q04006, DOI: 10.1029/2007GC001743.
Oakley, A., Taylor, B., and Moore, G., 2008. Pacific Plate subduction beneath the central Mariana and Izu-Bonin fore arcs: New insights from an old margin., 9 (4): Q06003, DOI: 10.1029/2007GC001820.
Okino, K., Shimakawa, Y., and Nagaoka, S., 1994. Evolution of the Shikoku Basin., 46 (6): 463-479, DOI: 10.5636/jgg.46.463.
Parker, R. L., 1973. The rapid calculation of potential anomalies., 31 (4): 447-455, DOI: 10. 1111/j.1365-246X.1973.tb06513.x.
Peitgen, H. O., and Saupe, D., 1988.. Springer Verlag, New York, 313pp.
Pérez-Gussinyé, M., Lowry, A. R., Watts, A. B., and Velicogna, I., 2004. On the recovery of effective elastic thickness using spectral methods: Examples from synthetic data and from the Fennoscandian Shield., 109 (B10): B10409, DOI: 10.1029/2003JB002788.
Pérez-Gussinyé, M., Metois, M., and Fernández, M., 2009a. Effective elastic thickness of Africa and its relationship to other proxies for lithospheric structure and surface tectonics., 287 (1-2): 152-167, DOI: 10. 1016/j.epsl.2009.08.004.
Pérez-Gussinyé, M., Swain, C. J., Kirby, J. F., and Lowry, A. R., 2009b. Spatial variations of the effective elastic thickness,T, using multitaper spectral estimation and wavelet methods: Exam-ples from synthetic data and application to South America., 10 (4): Q04005, DOI: 10.1 029/2008GC002229.
Ranero, C. R., Morgan, J. P., McIntosh, K., and Reichert, C., 2003.Bending-related faulting and mantle serpentinization at the mid- dle America Trench., 425 (6956): 367-373, DOI: 10.10 38/nature01961.
Ranero, C. R., Villaseor, A., Phipps Morgan, J., and Wdinrebe, W., 2005. Relationship between bending-faulting at trenches and intermediate-depth seismicity., 6 (12): Q12002, DOI: 10.1029/2005GC000997.
Ratheesh Kumar, R. T., and Windley, B. F., 2013. Spatial variations of effective elastic thickness over the Ninetyeast Ridge and implications for its structure and tectonic evolution., 608: 847-856, DOI: 10.1016/j.tecto.2013.07.034.
Ribeiro, J. M., Stern, R. J., Martinez, F., Ishizuka, O., Merle, S. G., and Kelley, K., 2013. Geodynamic evolution of a forearc rift in the southernmost Mariana Arc., 22 (4): 453- 476, DOI: 10.1111/iar.12039.
Schlindwein, V., and Schmid, F., 2016. Mid-ocean-ridge seismicityreveals extreme types of ocean lithosphere., 535 (7611): 276-279, DOI: 10.1038/nature18277.
Schwartz, S., Guillot, S., Reynard, B., Lafay, R., Debret, B., Nicollet, C.,., 2013. Pressure-temperature estimates of thelizardite/antigorite transition in high pressure serpentinites., 178 (9): 197-210, DOI: 10.1016/j.lithos.2012.11.023.
Sdrolias, M., and Müller, R. D., 2006. Controls on back-arc basinformation., 7 (4): Q04016, DOI: 10.1029/2005GC001090.
Stern, R. J., and Bloomer, S. H., 1992. Subduction zone infancy: Examples from the Eocene Izu-Bonin-Mariana and Jurassic California arcs., 104(12): 1621-1636, DOI: 10.1130/0016-7606(1992)104<1621:S ZIEFT>2.3.CO;2.
Swain, C. J., and Kirby, J. F., 2003. The effect of ‘noise’ on estimates of the elastic thickness of the continental lithosphere by the coherence method., 30 (11): 1574, DOI: 10.1029/2003GL017070.
Tassara, A., Swain, C., Hackney, R., and Kirby, J., 2007. Elastic thickness structure of South America estimated using wavelets and satellite-derived gravity data., 253 (1-2): 17-36, DOI: 10.1016/j.epsl.2006.10.008.
Wu, J., Suppe, J., Lu, R., and Kanda, R., 2016. Philippine Sea and East Asian Plate tectonics since 52Ma constrained by new sub- ducted slab reconstruction methods., 121: 4670-4741, DOI: 10.1002/2016 JB012923.
Xing, J., Hao, T., Hu, L. T., Sun, M., and Kim, K., 2016. Characteristics of the Japan and IBM subduction zones: Evidence from gravity and distribution of earthquake sources., 59 (1): 116-140, DOI: 10.6038/cjg201 60110 (in Chinese with English abstract).
Yang, A., and Fu, Y. T., 2018. Estimates of effective elastic thickness at subduction zones., 117: 75- 87, DOI: 10.1016/j.jog.2018.04.007.
Yang, T., Fu, R., and Huang, J., 2012. On the inversion of ef- fective elastic thickness of the lithosphere with Moho relief andtopography data., 55 (11): 3671-3680, DOI: 10.6038/j.issn.0001-5733.2012.11.014 (in Chinese with English abstract).
Zhang, B., Li, G., Li, S., and Dada, O. A., 2016. Docking and subduction of the West Pacific seamounts along the Mariana Trench and their effects., 51 (S1): 579- 592, DOI: 10.1002/gj.2760.
Zhang, F., Lin, J., and Zhan, W., 2014. Variations in oceanic plate bending along the Mariana Trench., 401: 206-214, DOI: 10.1016/j.epsl.2014.05.032.
Zhou, Z. Y., and Lin, J., 2018. Elasto-plastic deformation and plate weakening due to normal faulting in the subducting plate along the Mariana Trench., 734-735: 59-68, DOI: 10.1016/j.tecto.2018.04.008.
Zhou, Z. Y., Lin, J., and Zhang, F., 2018. Modeling of normal faulting in the subducting plates of the Tonga, Japan, Izu-Boninand Mariana Trenches: Implications for near-trench plate weak- ening., 37 (11): 53-60, DOI: 10.10 07/s13131-018-1146-z.
June 23, 2021;
March 6, 2022;
March 28, 2022
© Ocean University of China, Science Press and Springer-Verlag GmbH Germany 2022
. E-mail: zhaolihong@sdust.edu.cn
(Edited by Chen Wenwen)
猜你喜欢
杂志排行

Journal of Ocean University of China的其它文章
- The Role of Bottom Currents on the Morphological Development Around a Drowned Carbonate Platform, NW South China Sea
- Controls on the Gas Hydrate Occurrence in Lower Slope to Basin-Floor, Northeastern Bay of Bengal
- Geophysical Evidence for Carbonate Platform Periphery Gravity Flows in the Xisha Islands, South China Sea
- Seismic Characteristics and Hydrocarbon Accumulation Associated with Mud Diapir Structures in a Superimposed Basin in the Southern South China Sea Margin
- Simulation and Analysis of Back Siltation in a Navigation Channel Using MIKE 21
- Efficient Computational Approach for Predicting the 3D Acoustic Radiation of the Elastic Structure in Pekeris Waveguides