Wet Desulfurization of High-Sulfur Petroleum Coke Improved via Pre-calcination, H2O2 Treatment, and Ultrasound
2022-07-16WangGangMaoQiuyunLiuWeiYuZhouZhongQifan
Wang Gang; Mao Qiuyun; Liu Wei; Yu Zhou; Zhong Qifan
(1. School of Metallurgy and Enνironment, Central South Uniνersity, Changsha 410083, China;2. Department of Educational Science, Hunan First Normal Uniνersity, Changsha 410205, China)
Abstract: This work reports an improved method for the wet desulfurization of high-sulfur petroleum coke (petcoke)powder based on the combination of pre-calcination, H2O2, and ultrasound. The results demonstrated that over 45% of the sulfur atoms were efficiently removed from Tianjin coke and Qilu coke (particle size < 0.1 mm) by pre-calcination at 800°C for 6 h followed by desulfurization with HNO3 (8 mol/L) and H2O2 (2 mol/L) solution at a reaction temperature of 60 °C,a reaction time of 6 h, a liquid-to-solid ratio of 10 mL/g, and a 40 kHz ultrasonic power of 400 W. In addition, the specific surface area of the petcoke particles increased from 0.7 to 301.49 m2/g. After desulfurization, the pore size distribution of the petcoke particles was more concentrated on micropores compared with the samples prior to petcoke treatment. Reactive force field molecular dynamics simulation results indicated that HNO3 continuously oxidized the carbon atoms adjacent to sulfur atoms in the petcoke macromolecules and promoted sulfur removal from petcoke via the cleavage of C-S bonds. The sulfur transformation mechanism can be summarized as follows: thiophene sulfur → branched chain carbon sulfur → CO2S→ C2O2S → C2O3NS → C2O4S → CO2S.
Key words: sulfur removal; ultrasonic; petcoke; thiophene; ReaxFF
1 Introduction
Petroleum coke (petcoke) is a byproduct of heavy oil pyrolysis at high temperatures (485-505 °C) via the delayed coking process. Given its advantages of high carbon content (> 80%) and low ash content (< 1.5%)[1],petcoke has been widely employed as a raw material for carbon products. Petcoke is typically classified into lowsulfur petcoke (< 2%), midium-sulfur petcoke (2% - 4%),and high-sulfur petcoke (> 4%)[2]. Low-sulfur petcoke is extensively used for the production of graphite electrodes for steelmaking[3], batteries[4], and carbon anodes for aluminum electrolysis[5]. Medium-sulfur petcoke can also meet production requirements after calcination treatment to reduce the sulfur content[6]. However, high-sulfur petcoke is primarily used as a low-quality fuel owing to the lack of a suitable desulfurization method.
In recent years, with continued advances in oil refining technology[7], the sulfur content of petcoke has been reported to increase around the world[8]. Consequently,the output of high-quality petcoke (low sulfur content)can no longer meet industrial demand. Thus, developing techniques for the production of carbon materials from high-sulfur petcoke has become an urgent problem.The standard method for desulfurization is to increase the calcination temperature (thermal desulfurization)[9].Over 70% of the sulfur in petcoke can be removed via calcination at 1450 °C for 30 min[2,6]. However,most calcination equipment cannot tolerate such high temperatures for prolonged periods. Reductive desulfurization can reach a high desulfurization rate[2,10],albeit with a low coke yield. In these processes, reductive gases such as NH3and H2react with the sulfur and carbon atoms in the petcoke particles during high-temperature calcination to afford numerous small-molecule hydrocarbons[10], which occurs via the same mechanism as petcoke gasification for producing gas and gasoline[11].Oxidative desulfurization is widely used to remove sulfur from fuels owing to its mild operating conditions and low cost[12]. During the oxidation process, sulfide compounds are chemically converted into sulfones or sulfoxides with high polarity[13], which can be readily removed by absorption and solvent extraction[14]. However, the limited mass transfer of the oxidant into the reaction mixture can greatly influence the oxidant utilization and desulfurization rate[15]. Thus, the ultrasound-assisted oxidative desulfurization process was developed. In this process, the ultrasonic irradiation markedly enhances the mass transfer inside the reaction mixture owing to the cavitation effect[16], which mediates micro-mixing and micro-turbulence, while simultaneously generating reactive radicals such as ·OH and ·O[17]that promote oxidation. The desulfurization rate for oil subjected to ultrasound-assisted oxidative desulfurization has been reported to exceed 90%[18]. In contrast, the wet desulfurization of petcoke using HNO3solution may only lead to a desulfurization rate of approximately 30% petcoke[19]. Thus, the use of acids in conjunction with H2O2and ultrasonic irradiation may improve the desulfurization of petcoke.
Reactive force field (ReaxFF) molecular dynamics(MD) simulations enable the transformation of complex compounds during a reaction process to be visualized[20].This simulation approach has been widely applied to the investigation of coal pyrolysis, fuel combustion[21],and petcoke desulfurization[22]. In this study, the sulfur removal mechanism was explored via ReaxFF MD simulation in combination with experimental results obtained by X-ray photoelectron spectroscopy (XPS),thermogravimetry/derivative thermogravimetric (TG/dTG) analysis, pore distribution and specific surface area measurements, energy-dispersive X-ray spectroscopy(EDS), transmission electron microscopy (TEM),scanning electron microscopy (SEM), and Fouriertransform infrared (FT-IR) spectroscopy. In addition,an efficient wet desulfurization process involving precalcination, H2O2treatment, and ultrasound assistance is reported.
2 Experimental
2.1 Raw materials
As shown in Table 1 and Table 2, two typical raw petcoke materials (green petcoke) were used in this study: highsulfur petcoke (Tianjin coke) and medium-sulfur petcoke(Qilu coke). The green petcoke samples were sponge-like,with high carbon and volatile contents and low ash and metal contents. The contents of the eight metal elements in the samples (Table 2) were all extremely low, which is desirable for minimizing the experimental error due to catalytic reactions between the metal elements and sulfur[23-24].
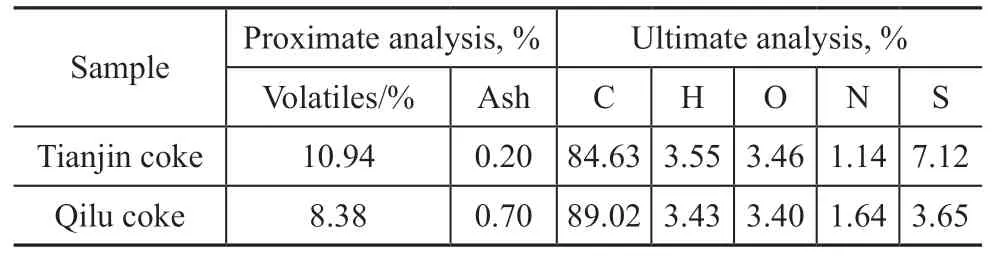
Table 1 Proximate and ultimate analysis of the dried petcoke samples

Table 2 Metal element analysis of the dried petcoke samples
As shown in Figure 1 and Table 3, XPS analysis revealed that the majority of the sulfur in the petcoke samples was in the form of thiophenes (ca. 164.2 eV[8]). Thiophene sulfur has been reported to exhibit the highest chemical stability of all organic sulfur compounds. Thus, the sulfur in these two petcoke was difficult to remove.

Table 3 XPS results for the forms of sulfur present in the petcoke samples
As the by-product of heavy oil pyrolysis via the delayed coking process, different kinds of petcoke possess similar carbon structures[23,25]. Here, Tianjin coke was selected for the following structural characterization. As shown in Figure 2(a), the sulfur and carbon atoms were evenly distributed in the petcoke structure based on the results of EDS analysis. The TG/dTG analysis of Tianjin coke in Figure 2(b) reveals that the petcoke sample lost weight with increasing temperature, indicating that it petcokecontained numerous volatile components such as smallmolecule hydrocarbons. The results of Brunauer-Emmett-Teller (BET) analysis petcoke after calcination at various temperatures ranging from 700 to 1000 °C for a total of 6 h are presented in Figure 2(c). The specific surface area of the original green petcoke sample was only 0.7 m2/g. Upon calcination at 700 °C, the specific surface area slightly increased to 14.2 m2/g. However, increasing the calcination temperature greatly increased the specific surface area,which reached a maximum value of 274.75 m2/g at 800 °C and then gradually decreased. This high specific surface area was expected to improve the contact and reaction efficiency between the sulfur atoms and desulfurization agents.

Figure 1 Sulfur XPS spectra of petcoke

Figure 2 (a) TEM and EDS analysis of Tianjin coke: (a1)TEM image, (a2) EDS analysis of carbon, and (a3) EDS analysis of sulfur. (b) TG/dTG analysis of Tianjin coke over the range of 20 – 1000 °C. (c) BET analysis of Tianjin coke samples after calcination at various temperatures
2.2 Experimental methods
2.2.1 Sample and reagent preparation
Petcoke particles (3 - 4 cm diameter) were first dried at 110 °C for 8 h then crushed into a fine powder (< 0.1 mm diameter) using a quartz mortar and pestle. The reagents used in this work are listed in Table 4. Except for sulfuric acid and aqua regia, which were used directly, the acids were prepared at a solution concentration of 8.0 mol/L in deionized water.
2.2.2 Traditional desulfurization
The petcoke samples were first treated with solutions of the desulfurization agents listed in Table 4 at 60 °C for 10 h. Then, the samples were washed three times with deionized water to obtain a neutral pH, collected by filtration, and dried at 110 °C for 8 h prior to further analysis. The performance of the various desulfurizationmethods was evaluated from the desulfurization rate, as defined in Equation (1).

Table 4 Raw reagents used in this study

Two enhanced methods were investigated in an effort to improve the desulfurization rate. In the first method, the petcoke was subjected to pre-calcination at 800 °C for 6 h to improve its specific surface area (Figure 2(c)). In the second method, the acids (8 mol/L) were mixed with H2O2(2 mol/L) to improve the oxidation ability of the desulfurization agents.
2.2.3 Ultrasound-assisted desulfurization
The petcoke was pre-calcined at 800 °C for 6 h then petcoke treated with a mixture of HNO3(8 mol/L) and H2O2(2 mol/L) and subjected to ultrasonic irradiation.The experimental apparatus is depicted in Figure 3. After desulfurization, the samples were processed in the same manner as for the traditional desulfurization experiments.
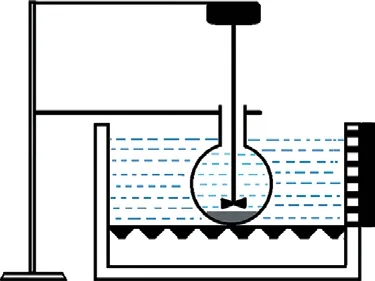
Figure 3 Schematic diagram of the experimental apparatus used for ultrasound-assisted desulfurization
2.2.4 Characterization
The analytical devices used in this study were as follows:(a) Vario MICRO cube (Elementar, Hanau, Germany); (b)Evolution 16/18 thermal analyzer (Setaram, France); (c)automatic surface area and pore size analyzer (TriStar II 3020,Micromeritics Instrument Corporation); (d) Nicolet 6700 FTIR spectrometer (Thermo Electron, USA); (e) TEM system equipped with EDS capability (Tecnai G2 F20, USA); (f)ESCALAB 250Xi X-ray photoelectron spectroscopy microprobe(Thermo Scientific, MA); and (g) SEM system (JSM-6360LV).
2.3 ReaxFF MD simulation
2.3.1 Model of the HNO3-petcoke system
In previous work, a model of petcoke was constructed in Materials Studio based on the results of analytical data such as ultimate analysis, XPS, and FT-IR spectroscopy.The molecular formula of the model petcoke system was C192H96N3O7S6, with a molecular weight of 2749.23. In addition, 293 HNO3molecules were used to simulate the desulfurization agent. The petcoke macromolecule was placed in the center of a simulation cell with dimensions of 37 Å × 37 Å × 37 Å and surrounded by the HNO3molecules,as depicted in Figure 4 as a ball-and-stick representation.

Figure 4 Molecular model of the HNO3-petcoke system
2.3.2 ReaxFF computational method
The ReaxFF-CHONSSiforce field[26]was used in the ADF package. As expressed in Equation (2), the ReaxFF potential energy function comprises the bond energy(Ebond), the over-coordinated atom in the energy contribution (Eover), three-body valence angle strain energy (Eangle), four-body torsional angle strain energy(Etors), Coulomb interaction (Ecoulomb), and non-bonded van der Waals interaction (EvdWaals)[27]:

A constant volume and temperature (NVT ensemble)were used with a bond order cutoff of 0.3 Å for molecular recognition and a bond order of 0.001 for valency and torsion angles. Simulation system was subjected to energy optimization using the conjugate gradient method then heated to the simulation temperature (1000, 1500, or 2000 K). The simulation temperature was set higher than the experimental temperature to accelerate the reaction kinetics[28]and enable sufficient simulation progress within a reasonable time frame. The simulation was performed for 1500 ps with a time step of 0.25 fs.
3 Results and Discussion
3.1 Traditional desulfurization
To explore the maximum efficiency of acidic desulfurization, the Tianjin and Qilu petcoke samples were treated with H3PO4, HCl, H2SO4(98%), HNO3, and aqua regia at 60 °C for 10 h with a liquid-to-solid ratio of 10 mL/g. The results are presented in Figure 5(a) and Figure 6(a). As mentioned above, the desulfurization of petcoke at low temperatures is determined by the oxidation ability of the desulfurization agent[29]. Aqua regia was included as a reference owing to its strongest oxidation ability among acids. The treatment with aqua regia removed approximately 30% of the total sulfur in the petcoke samples. Treatment with HCl, H3PO4, and HNO3led to desulfurization rates of 3.19%, 3.73%,and 21.49% for Tianjin coke and 3.47%, 6.14%, and 21.76% for Qilu coke, respectively. However, the sulfur content increased after treatment with H2SO4, which was tentatively ascribed to the reaction of sulfate ions with components of the petcoke[30]. Thus, H2SO4was disregarded in the subsequent experiments.As shown in Figure 5(b) and 6(b), the addition of H2O2improved the desulfurization rate for HCl, H3PO4, and HNO3. Pre-calcination also improved the desulfurization rate. These findings demonstrated that the combined methods examined in this study were effective. The optimal desulfurization rate was obtained by precalcination of the petcoke samples followed by treatment with HNO3(8 mol/L) and H2O2(2 mol/L) at 60 °C for 10 h.This procedure afforded desulfurization rates of 49.32%for Tianjin coke and 43.20% for Qilu coke.

Figure 5 (a) Desulfurization rate of Tianjin coke after treatment with various acids. (b) Desulfurization rate of Tianjin coke after acid treatment only (A), combined pre-calcination/acid treatment (B), combined acid/H2O2 treatment (C), and combined pre-calcination/acid/H2O2 treatment (D)

Figure 6 (a) Desulfurization rate of Qilu coke after treatment with various acids. (b) Desulfurization rate of Qilu coke after acid treatment only (A), combined pre-calcination/acid treatment (B), combined acid/H2O2 treatment (C), and combined precalcination/acid/H2O2 treatment (D)
3.2 Ultrasound-assisted desulfurization
3.2.1 Influence of reaction time
The effect of reaction time on the desulfurization rate is shown in Figure 7. Ultrasound assistance further improved the desulfurization rate for both petcoke samples. For Tianjin coke, a desulfurization rate of 50.36% was achieved after 3.5 h of reaction, slightly exceeding the desulfurization rate of 49.31% obtained after 10 h without ultrasound assistance. For Qilu coke, the desulfurization rate reached 44.52% after 5 h of reaction, in contrast to the desulfurization rate of 43.19% recorded after 10 h without ultrasound assistance. The desulfurization rate increased more rapidly for the ultrasound-assisted method than for the traditional method. After a reaction time of 6 h, the ultrasound-assisted desulfurization rate for Tianjin coke and Qilu coke reached 53.93% and 46.12%,respectively. Further increasing the reaction time had little effect on the desulfurization rate, and it was clear that sulfur removal from the petcoke essentially reached completion within the first 6 h. Thus, a reaction time of 6 h was used in the subsequent experiments.
3.2.2 Influence of reaction temperature
The temperature also plays an important role in desulfurization reactions. As shown in Figure 8, the desulfurization rate increased rapidly as the temperature was increased to 60 °C. Even at a reaction temperature of 40 °C, the ultrasound-assisted desulfurization rate for Tianjin coke reached 50.84%, surpassing the optimal traditional desulfurization rate measured at 60 °C. For Qilu coke, the ultrasound-assisted desulfurization rate reached 46.12% at 60 °C, whereas the desulfurization rate was only 42.94% without ultrasound assistance. These results further demonstrate that ultrasound treatment greatly enhanced the desulfurization rate.

Figure 7 Influence of reaction time on desulfurization rate for (a) Tianjin coke and (b) Qilu coke
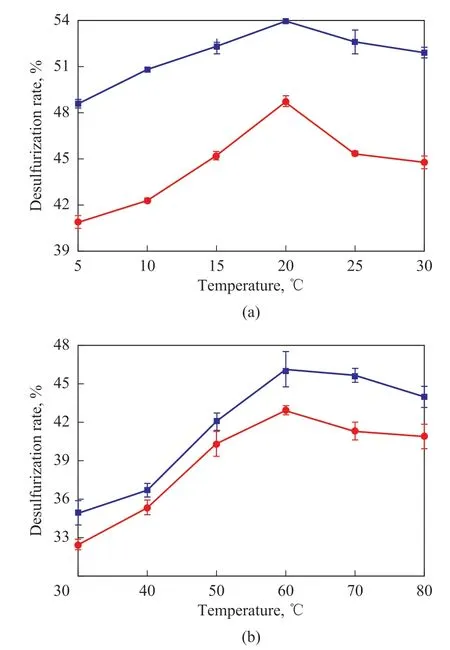
Figure 8 Influence of temperature on desulfurization rate for (a) Tianjin coke and (b) Qilu coke
At a reaction temperature of 60 °C, the ultrasoundassisted desulfurization rate for Tianjin coke and Qilu coke peaked at 53.93% and 46.12%, respectively.However, further increasing the temperature caused the desulfurization rate to decrease. This was ascribed to the decomposition of the desulfurization agents at higher temperatures, as shown in Equations (3) and (4)[31]:

Thus, a reaction temperature of 60 °C was considered suitable for desulfurization and used in the subsequent experiments.
3.2.3 Influence of liquid-to-solid ratio
As shown in Figure 9, the liquid-to-solid ratio had a marked effect on the desulfurization rate. At a liquidto-solid ratio of 5 mL/g, the ultrasound-assisted desulfurization rate was found to be 50.35% and 41.64% for Tianjin coke and Qilu coke, respectively.At a liquid-to-solid ratio of 10 mL/g, the ultrasoundassisted desulfurization rate reached its maximum values of petcoke53.93% for Tianjin coke and 46.12% for Qilu coke, in contrast to the maximum values of 48.75%and 42.94%, respectively, observed without ultrasound assistance. Thus, the desulfurization rate greatly improved with ultrasound treatment under the same conditions.

Figure 9 Influence of liquid-to-solid ratio on
3.2.4 Influence of ultrasonic power
As shown in Figure 10, the ultrasonic power also exerted a significant effect on the desulfurization rate, which improved markedly as the ultrasonic power was increased from 80 to 400 W. The desulfurization rate reached its maximum values of 53.94% for Tianjin coke and 46.12%for Qilu coke at an ultrasonic power of 400 W. Compared with the traditional method, the optimized desulfurization rate increased by an absolute value of over 4% with ultrasound assistance. This ability of ultrasonic irradiation to enhance the desulfurization process was ascribed to the energy generated upon bubble collapse promoting the dissociation of HNO3and H2O2to produce numerous reactive radicals such as ·OH and ·O and accelerate the oxidation process. Owing to equipment limitations (power range of 80-400 W), the effect of the ultrasonic power on the desulfurization process could not be further analyzed.Under the current conditions, the optimal ultrasonic power was considered to be 400 W.

Figure 10 Influence of ultrasonic power on desulfurization rate for coke samples
3.3 Properties of the green and desulfurized petcoke samples
As shown in Figure 11, SEM images revealed that the green petcoke samples (Figure 11(a1) and (b1)) had a different appearance to the processed petcoke samples.The surfaces of the green petcoke samples were coated with a layer of mulch. In contrast, the surfaces of the petcoke samples after pre-calcinationpetcoke (Figure 11(a2) and (b2)), traditional desulfurization (Figure 11(a3)and (b3)), and ultrasound-assisted desulfurization petcoke(Figure 11(a4) and (b4)) were clear and had lamella. The layer of mulch on the green petcoke samples may be the volatile components removed during calcination[11]. No notable differences in the surface appearance between the calcined petcoke and desulfurized petcoke samples were observed. The desulfurized petcoke could be further used as an industrial raw material to produce high-quality carbon products similar to common calcined coke.
As mentioned above, different kinds of petcoke have similar carbon structures[23,25]. Tianjin coke was selected for pore size distribution analysis. Changes in the pore size distribution may reflect the structural changes during the desulfurization process. As shown in Figure 12, the green petcoke sample contained few pores, in accordance with its low specific surface area (Figure 2(c)), and the pore radius distribution was mostly concentrated at values of 28, 40, and 55 Å. No micropores (pore radius < 10 Å) were identified. The calcined sample exhibited more pores, over half of the volume of which was concentrated at values of 11 and 23 Å. After desulfurization, the specific surface area increased to 301.49 m2/g, with the pore size distribution more concentrated on smaller pores (9 and 17 Å) compared with the calcined sample.Numerous micropores were observed in the petcoke particles after desulfurization. It was speculated that the desulfurization agents reacted with the functional groups or carbon structure to leave more pores on the petcoke particles. This trait is useful for the preparation of activated carbon and petcoke gasification.

Figure 11 SEM images of (A) Tianjin coke and (B) Qilu coke
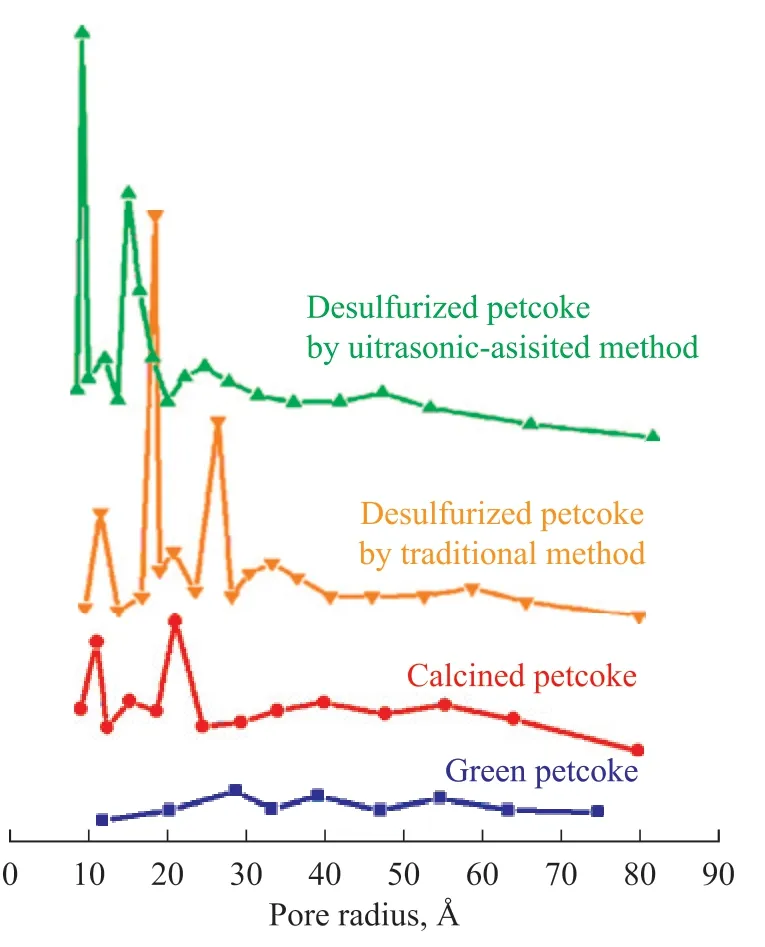
Figure 12 Pore size distributions for green, calcined, and desulfurized Tianjin coke
3.4 Mechanism of oxidative desulfurization
3.4.1 FT-IR analysis
FT-IR analysis was conducted to examine the changes in the functional groups present in the petcoke samples before and after desulfurization, as shown in Figure 13.The peaks at wavenumbers of approximately 3023 and 1309 cm−1correspond to the C-H bonds of the fivemembered thiophene ring structure, while the peak at 860 cm−1corresponds to the stretching vibrations of thiophene C-S bonds[32-33]. It can be seen that the peaks at 3023 and 1309 cm−1became weaker or disappeared for the desulfurized petcoke samples compared with those in the green petcoke samples. In addition, the characteristic peaks of nitro (-NO2, ca. 1380 and 1540 cm−1) and carboxyl (-COOH, ca. 1700 cm−1) groups appeared[34]. The above findings demonstrate that the thiophene moieties were damaged during desulfurization,allowing the HNO3to react with the petcoke structure and leave behind -NO2functional groups. In addition,the presence of the -COOH functional groups confirmed the oxidation of the petcoke by the acidic desulfurization agent. However, detailed analyses should be performed to further explore the oxidative desulfurization mechanism.

Figure 13 FT-IR spectra for coke samples
3.4.2 ReaxFF MD simulation
A ReaxFF MD simulation was conducted to further investigate the behavior of sulfur and oxygen during the desulfurization process. Ultrasonic irradiation can improve the mixing effects between petcoke and the desulfurization agents through cavitation, while not affecting the desulfurization mechanism[16]. Thus,the influence of ultrasound was not considered in the simulation. Figure 14 shows the role of HNO3during the desulfurization process. First, the reactive radicals such as ·OH and ·NO2generated from HNO3molecules attacked the carbon atoms adjacent to the thiophene sulfur atoms to form C-O and C-NO2groups. Then, the C-S bond was cleaved owing to the strong chemical affinity between carbon and oxygen, causing the thiophene sulfur to become incorporated in a new six-membered ring. Next, the six-membered ring was fractured under the attack of oxidative radicals, with carbon branched chain S formation. The carbon branched chain sulfur was not chemically stable and was easily removed from the petcoke. Thus, the carbon branched chain sulfur separated from the macromolecular structure to form CO2S under the attack of reactive radicals. Finally, CO2S reacted with·CO, ·O, and ·NO radicals to generate C2O2S, C2O3NS,C2O4S, and other unstable sulfur-containing products.C2O4S then underwent decomposition to afford CO2S.Thus, the sulfur transformation process in the presence of HNO3molecules can be summarized as follows:thiophene sulfur → carbon branched chain sulfur →CO2S → C2O2S → C2O3NS → C2O4S → CO2S.

Figure 14 Desulfurization process of thiophene sulfur atoms
The results of the ReaxFF MD simulation clearly depict the desulfurization process. The desulfurization agent (HNO3)continuously provided reactive radicals such as -·OH and -NO2··that oxidized the carbon atoms adjacent to the sulfur atoms in the petcoke macromolecules. It also destroyed the stable structure between carbon and sulfur, promoting sulfur removal from the petcoke and affording sulfur-containing products such as CO2S. Unfortunately, it was not feasible to verify the generation of these products by experimental methods owing to their extremely short lifetime. However,the simulated mechanism observed in this paper is partially consistent with previous work[22,35-36], which lends support to the validity of the current simulation results.
4 Conclusions
In conclusion, a highly efficient oxidative desulfurization method for high-sulfur petcoke was explored. The petcoke samples were pre-calcined at 800 °C for 6 h then desulfurized with a solution of HNO3(8 mol/L) and H2O2(2 mol/L) with a liquid-to-solid ratio of 10 mL/g, a temperature of 60 °C, a reaction time of 6 h, and a 40 kHz ultrasonic power of 400 W. This procedure efficiently removed over 45% of the thiophene-like sulfur atoms from the petcoke (particle size < 0.1 mm). It may be possible to further improve the desulfurization rate by decreasing the particle size, adding another acid, or increasing the ultrasonic power. Furthermore, ReaxFF MD simulation results provided key insights into the petcoke desulfurization mechanism.
As shown in the SEM images, the desulfurized petcoke was slightly damaged and could be further used to produce carbon materials in a similar manner to lowsulfur petcoke. BET analysis revealed that the specific surface area of the petcoke particles increased from 0.7 to 274.75 m2/g after calcination at 800 °C and reached 301.49 m2/g after desulfurization. This characteristic is desirable for gas/solution petcoke reactions. Abundant micropores were also formed in the petcoke particles after desulfurization, which is advantageous for activated carbon production and petcoke gasification.
Acknowledgments:This work was financially supported by the Scientific Research Project of Hunan Education Department(20C0410) and the Fundamental Research Funds for the Central Universities of Central South University.
杂志排行

中国炼油与石油化工的其它文章
- Amorphous Catalysts for Electrochemical Water Splitting
- Tetralin Hydrocracking Reaction Network to Single-Ring Aromatics on Bifunctional Catalysts
- Upgradation of Heavy Crude Oil Via Hydrodynamic Cavitation Through Variations in Asphaltenes
- Removal of Heteroaromatic Sulfur Compounds by a Non-noble Metal Fe Single-atom Adsorbent
- A High-Performance Composite Epoxy Coating Based on the Cooperative Enhancement of 2D Co2(OH)2BDC and Electrospun PAN Nanofiber Membrane
- Influence of Ethanol Addition on the Spray Auto-ignition Properties of Gasoline and Its Relationship with Octane Number